Estimated zip code population in 2022: 46,260 Zip code population in 2010: 46,369 Zip code population in 2000: 52,658
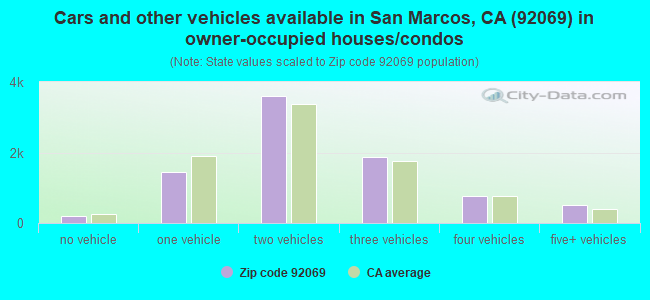
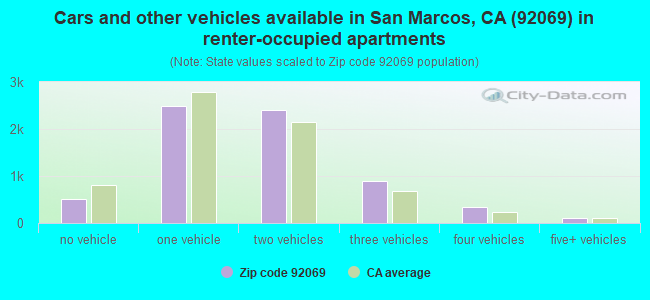
Houses and condos: 15,797 Renter-occupied apartments: 6,745
% of renters here:
44%
State:
44%
March 2022 cost of living index in zip code 92069: 122.9 (high, U.S. average is 100)
Land area: 16.5 sq. mi. Water area: 0.0 sq. mi.
Population density: 2,812 people per square mile
(average).
OSM Map
General Map
Google Map
MSN Map
OSM Map
General Map
Google Map
MSN Map
OSM Map
General Map
Google Map
MSN Map
OSM Map
General Map
Google Map
MSN Map
Please wait while loading the map...
Real estate property taxes paid for housing units in 2022:
This zip code:
0.7% ($4,941)
California:
0.7% ($4,831)
Median real estate property taxes paid for housing units with mortgages in 2022: $5,600 (0.7%) Median real estate property taxes paid for housing units with no mortgage in 2022: $2,964 (0.5%)
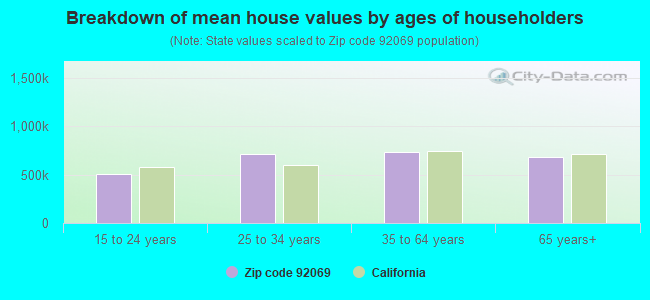
Estimated median house/condo value in 2022: $716,552
92069:
$716,552
California:
$715,900
According to our research of California and other state lists, there were 22 registered sex offenders living in 92069 zip code as of April 27, 2024. The ratio of all residents to sex offenders in zip code 92069 is 2,245 to 1. The ratio of registered sex offenders to all residents in this zip code is much lower than the state average.
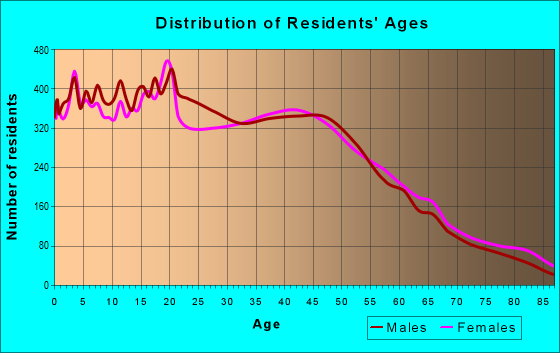
Median resident age:
This zip code:
36.3 years
California median age:
37.9 years
Average household size:
This zip code:
3.0 people
California:
2.8 people
Averages for the 2020 tax year for zip code 92069, filed in 2021:
Average Adjusted Gross Income (AGI) in 2020: $71,410 (Individual Income Tax Returns)
Here:
$71,410
State:
$95,910
Salary/wage: $63,866 (reported on 84.5% of returns)
Here:
$63,866
State:
$77,331
(% of AGI for various income ranges: 1318.1% for AGIs below $25k, 4034.0% for AGIs $25k-50k, 7365.8% for AGIs $50k-75k, 10560.2% for AGIs $75k-100k, 21696.9% for AGIs $100k-200k, 77159.3% for AGIs over 200k)
Taxable interest for individuals: $1,055 (reported on 31.7% of returns)
This zip code:
$1,055
California:
$2,294
(% of AGI for various income ranges: 13.4% for AGIs below $25k, 11.5% for AGIs $25k-50k, 35.1% for AGIs $50k-75k, 66.0% for AGIs $75k-100k, 111.2% for AGIs $100k-200k, 722.9% for AGIs over 200k)
Ordinary dividends: $3,580 (reported on 15.2% of returns)
Here:
$3,580
State:
$10,949
(% of AGI for various income ranges: 18.2% for AGIs below $25k, 18.5% for AGIs $25k-50k, 65.4% for AGIs $50k-75k, 84.4% for AGIs $75k-100k, 187.0% for AGIs $100k-200k, 1223.7% for AGIs over 200k)
Net capital gain/loss in AGI: +$19,042 (reported on 15.3% of returns)
Here:
+$19,042
State:
+$49,306
(% of AGI for various income ranges: 7.1% for AGIs below $25k, 12.1% for AGIs $25k-50k, 63.2% for AGIs $50k-75k, 117.8% for AGIs $75k-100k, 414.6% for AGIs $100k-200k, 13760.5% for AGIs over 200k)
Profit/loss from business: +$12,204 (reported on 17.3% of returns)
Here:
+$12,204
State:
+$15,671
(% of AGI for various income ranges: 187.0% for AGIs below $25k, 220.4% for AGIs $25k-50k, 293.9% for AGIs $50k-75k, 316.8% for AGIs $75k-100k, 515.9% for AGIs $100k-200k, 2646.8% for AGIs over 200k)
Taxable individual retirement arrangement distribution: $18,313 (reported on 6.0% of returns)
92069:
$18,313
California:
$23,505
(% of AGI for various income ranges: 44.2% for AGIs below $25k, 55.6% for AGIs $25k-50k, 168.8% for AGIs $50k-75k, 320.1% for AGIs $75k-100k, 463.3% for AGIs $100k-200k, 1187.1% for AGIs over 200k)
Self-employed (Keogh) retirement plans: $15,422 (reported on 0.4% of returns)
92069:
$15,422
California:
$30,163
(% of AGI for various income ranges: 23.7% for AGIs $100k-200k, 229.3% for AGIs over 200k)
Total itemized deductions: $31,159 (reported on 14.0% of returns)
Here:
$31,159
State:
$39,517
(% of AGI for various income ranges: 68.0% for AGIs below $25k, 132.7% for AGIs $25k-50k, 457.0% for AGIs $50k-75k, 901.7% for AGIs $75k-100k, 2314.0% for AGIs $100k-200k, 6782.9% for AGIs over 200k)
Charity contributions: $5,533 (reported on 11.1% of returns)
Here:
$5,533
State:
$12,598
(% of AGI for various income ranges: 4.3% for AGIs below $25k, 10.9% for AGIs $25k-50k, 40.5% for AGIs $50k-75k, 101.5% for AGIs $75k-100k, 306.8% for AGIs $100k-200k, 1384.6% for AGIs over 200k)
Taxes paid: $8,776 (reported on 14.0% of returns)
92069:
$8,776
State:
$8,807
(% of AGI for various income ranges: 14.6% for AGIs below $25k, 27.0% for AGIs $25k-50k, 121.2% for AGIs $50k-75k, 269.7% for AGIs $75k-100k, 711.0% for AGIs $100k-200k, 1765.9% for AGIs over 200k)
Earned income credit: $2,054 (reported on 12.5% of returns)
Here:
$2,054
State:
$2,074
(% of AGI for various income ranges: 70.4% for AGIs below $25k, 62.2% for AGIs $25k-50k, 1.5% for AGIs $50k-75k)
Percentage of individuals using paid preparers for their 2020 taxes: 93.1%
Here:
93%
State:
92%
(% for various income ranges: 91.7% for AGIs below $25k, 93.4% for AGIs $25k-50k, 93.0% for AGIs $50k-75k, 94.2% for AGIs $75k-100k, 93.9% for AGIs $100k-200k, 94.7% for AGIs over 200k)
Averages for the 2012 tax year for zip code 92069, filed in 2013:
Average Adjusted Gross Income (AGI) in 2012: $54,300 (Individual Income Tax Returns)
Here:
$54,300
State:
$72,726
Salary/wage: $49,856 (reported on 85.6% of returns)
Here:
$49,856
State:
$59,079
(% of AGI for various income ranges: 78.2% for AGIs below $25k, 82.8% for AGIs $25k-50k, 79.9% for AGIs $50k-75k, 81.9% for AGIs $75k-100k, 83.0% for AGIs $100k-200k, 61.6% for AGIs over 200k)
Taxable interest for individuals: $906 (reported on 32.7% of returns)
This zip code:
$906
California:
$2,146
(% of AGI for various income ranges: 0.7% for AGIs below $25k, 0.5% for AGIs $25k-50k, 0.4% for AGIs $50k-75k, 0.6% for AGIs $75k-100k, 0.4% for AGIs $100k-200k, 1.0% for AGIs over 200k)
Ordinary dividends: $2,997 (reported on 13.9% of returns)
Here:
$2,997
State:
$9,308
(% of AGI for various income ranges: 0.8% for AGIs below $25k, 0.6% for AGIs $25k-50k, 0.9% for AGIs $50k-75k, 0.6% for AGIs $75k-100k, 0.6% for AGIs $100k-200k, 1.4% for AGIs over 200k)
Net capital gain/loss in AGI: +$5,795 (reported on 11.9% of returns)
Here:
+$5,795
State:
+$30,460
(% of AGI for various income ranges: 0.3% for AGIs $50k-75k, 0.2% for AGIs $75k-100k, 0.7% for AGIs $100k-200k, 6.5% for AGIs over 200k)
Profit/loss from business: +$13,539 (reported on 17.1% of returns)
Here:
+$13,539
State:
+$17,064
(% of AGI for various income ranges: 10.6% for AGIs below $25k, 5.6% for AGIs $25k-50k, 3.7% for AGIs $50k-75k, 2.9% for AGIs $75k-100k, 2.5% for AGIs $100k-200k, 4.2% for AGIs over 200k)
Taxable individual retirement arrangement distribution: $15,242 (reported on 7.1% of returns)
92069:
$15,242
California:
$19,557
(% of AGI for various income ranges: 2.0% for AGIs below $25k, 1.7% for AGIs $25k-50k, 2.5% for AGIs $50k-75k, 2.3% for AGIs $75k-100k, 2.0% for AGIs $100k-200k, 1.5% for AGIs over 200k)
Self-employment retirement plans: $23,800 (reported on 0.4% of returns)
92069:
$23,800
California:
$24,530
(% of AGI for various income ranges: 0.2% for AGIs below $25k, 0.1% for AGIs $100k-200k, 0.6% for AGIs over 200k)
Total itemized deductions: $27,152 (26% of AGI, reported on 33.5% of returns)
Here:
$27,152
State:
$34,004
Here:
25.6% of AGI
State:
22.7% of AGI
(% of AGI for various income ranges: 8.2% for AGIs below $25k, 10.4% for AGIs $25k-50k, 16.7% for AGIs $50k-75k, 19.1% for AGIs $75k-100k, 20.9% for AGIs $100k-200k, 17.9% for AGIs over 200k)
Charity contributions: $2,905 (reported on 27.2% of returns)
Here:
$2,905
State:
$4,659
(% of AGI for various income ranges: 0.4% for AGIs below $25k, 0.7% for AGIs $25k-50k, 1.4% for AGIs $50k-75k, 1.6% for AGIs $75k-100k, 1.9% for AGIs $100k-200k, 1.8% for AGIs over 200k)
Taxes paid: $9,795 (reported on 33.5% of returns)
92069:
$9,795
State:
$14,448
(% of AGI for various income ranges: 1.6% for AGIs below $25k, 2.6% for AGIs $25k-50k, 4.6% for AGIs $50k-75k, 6.1% for AGIs $75k-100k, 8.0% for AGIs $100k-200k, 9.4% for AGIs over 200k)
Earned income credit: $2,325 (reported on 17.7% of returns)
Here:
$2,325
State:
$2,286
(% of AGI for various income ranges: 5.5% for AGIs below $25k, 1.4% for AGIs $25k-50k)
Percentage of individuals using paid preparers for their 2012 taxes: 61.5%
Here:
61%
State:
64%
(% for various income ranges: 61.6% for AGIs below $25k, 63.1% for AGIs $25k-50k, 61.2% for AGIs $50k-75k, 58.5% for AGIs $75k-100k, 59.0% for AGIs $100k-200k, 68.1% for AGIs over 200k)
Averages for the 2004 tax year for zip code 92069, filed in 2005:
Average Adjusted Gross Income (AGI) in 2004: $47,516 (Individual Income Tax Returns)
Here:
$47,516
State:
$58,600
Salary/wage: $45,321 (reported on 84.8% of returns)
Here:
$45,321
State:
$49,455
(% of AGI for various income ranges: 159.3% for AGIs below $10k, 79.2% for AGIs $10k-25k, 82.3% for AGIs $25k-50k, 81.1% for AGIs $50k-75k, 85.1% for AGIs $75k-100k, 76.8% for AGIs over 100k)
Taxable interest for individuals: $1,209 (reported on 46.6% of returns)
This zip code:
$1,209
California:
$2,365
(% of AGI for various income ranges: 7.4% for AGIs below $10k, 1.8% for AGIs $10k-25k, 1.1% for AGIs $25k-50k, 1.0% for AGIs $50k-75k, 0.9% for AGIs $75k-100k, 1.1% for AGIs over 100k)
Taxable dividends: $2,313 (reported on 19.8% of returns)
Here:
$2,313
State:
$4,746
(% of AGI for various income ranges: 6.0% for AGIs below $10k, 1.1% for AGIs $10k-25k, 0.8% for AGIs $25k-50k, 0.9% for AGIs $50k-75k, 0.6% for AGIs $75k-100k, 1.0% for AGIs over 100k)
Net capital gain/loss: +$7,235 (reported on 17.2% of returns)
Here:
+$7,235
State:
+$23,418
(% of AGI for various income ranges: -3.5% for AGIs below $10k, 0.1% for AGIs $10k-25k, 0.4% for AGIs $25k-50k, 0.8% for AGIs $50k-75k, 1.1% for AGIs $75k-100k, 6.1% for AGIs over 100k)
Profit/loss from business: +$12,524 (reported on 17.2% of returns)
Here:
+$12,524
State:
+$16,826
(% of AGI for various income ranges: 11.8% for AGIs below $10k, 7.6% for AGIs $10k-25k, 5.5% for AGIs $25k-50k, 3.4% for AGIs $50k-75k, 3.2% for AGIs $75k-100k, 4.2% for AGIs over 100k)
IRA payment deduction: $3,178 (reported on 2.8% of returns)
92069:
$3,178
California:
$3,192
(% of AGI for various income ranges: 0.7% for AGIs below $10k, 0.2% for AGIs $10k-25k, 0.2% for AGIs $25k-50k, 0.2% for AGIs $50k-75k, 0.2% for AGIs $75k-100k, 0.1% for AGIs over 100k)
Self-employed pension: $10,066 (reported on 0.9% of returns)
Here:
$10,066
California:
$17,688
(% of AGI for various income ranges: 0.5% for AGIs below $10k, 0.1% for AGIs $25k-50k, 0.1% for AGIs $50k-75k, 0.1% for AGIs $75k-100k, 0.3% for AGIs over 100k)
Total itemized deductions: $25,109 (31% of AGI, reported on 40.8% of returns)
Here:
$25,109
State:
$28,113
Here:
30.5% of AGI
State:
25.3% of AGI
(% of AGI for various income ranges: 38.5% for AGIs below $10k, 11.5% for AGIs $10k-25k, 17.0% for AGIs $25k-50k, 24.3% for AGIs $50k-75k, 25.8% for AGIs $75k-100k, 22.9% for AGIs over 100k)
Charity contributions deductions: $2,686 (3% of AGI, reported on 34.6% of returns)
Here:
$2,686
State:
$3,923
Here:
3.1% of AGI
State:
3.3% of AGI
(% of AGI for various income ranges: 1.5% for AGIs below $10k, 0.8% for AGIs $10k-25k, 1.3% for AGIs $25k-50k, 2.2% for AGIs $50k-75k, 2.2% for AGIs $75k-100k, 2.4% for AGIs over 100k)
Total tax: $6,302 (reported on 74.0% of returns)
92069:
$6,302
State:
$10,761
(% of AGI for various income ranges: 6.6% for AGIs below $10k, 4.1% for AGIs $10k-25k, 5.9% for AGIs $25k-50k, 7.5% for AGIs $50k-75k, 8.7% for AGIs $75k-100k, 15.0% for AGIs over 100k)
Earned income credit: $1,705 (reported on 14.6% of returns)
Here:
$1,705
State:
$1,763
Percentage of individuals using paid preparers for their 2004 taxes: 64.5%
Here:
64%
State:
66%
(% for various income ranges: 56.1% for AGIs below $10k, 68.3% for AGIs $10k-25k, 65.7% for AGIs $25k-50k, 63.4% for AGIs $50k-75k, 63.3% for AGIs $75k-100k, 66.8% for AGIs over 100k)
Likely homosexual households (counted as self-reported same-sex unmarried-partner households)
Lesbian couples: 0.2% of all households
Gay men: 0.0% of all households
Household received Food Stamps/SNAP in the past 12 months: 1,471 Household did not receive Food Stamps/SNAP in the past 12 months: 13,622
Women who had a birth in the past 12 months: 672 (508 now married, 163 unmarried) Women who did not have a birth in the past 12 months: 10,724 (4,306 now married, 6,416 unmarried)
Housing units in zip code 92069 with a mortgage: 5,949 (493 second mortgage, 14 home equity loan, 351 both second mortgage and home equity loan) Houses without a mortgage: 64
Median monthly owner costs for units with a mortgage: $2,799 Median monthly owner costs for units without a mortgage: $667
Residents with income below the poverty level in 2022:
This zip code:
11.4%
Whole state:
12.2%
Residents with income below 50% of the poverty level in 2022:
This zip code:
5.9%
Whole state:
6.2%
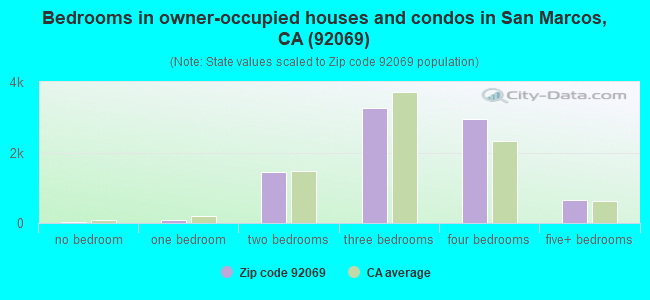
Median number of rooms in houses and condos:
Here:
6.1
State:
6.0
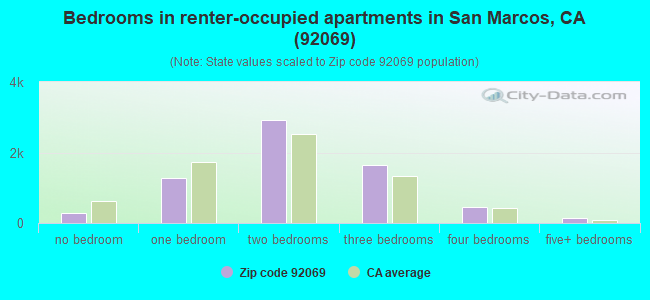
Median number of rooms in apartments:
Here:
4.3
State:
3.9
Notable locations in this zip code not listed on our city pages
Notable locations in zip code 92069: Twin Oaks Valley Golf Course (A), San Marcos Community Center (B), San Marcos City Hall (C), San Marcos Chamber of Commerce (D), San Marcos Branch San Diego County Library (E), F H Corby Smith Community Gymnasium (F), San Marcos Fire Protection District Station 3 (G), San Marcos Fire Protection District Station 1 (H). Display/hide their locations on the map
Shopping Centers: North County Factory Outlet Center Shopping Center (1), Mission Center Shopping Center (2), Vallecitos Town Center Shopping Center (3). Display/hide their locations on the map
Parks in zip code 92069 include: Helen Bougher Memorial Park (1), Walnut Grove Park (2), Woodland Park (3), Cerro de las Posas Park (4), Knob Hill Park (5). Display/hide their locations on the map
6,718 married couples with children.
2,765 single-parent households (541 men, 2,224 women).
58.6% of residents of 92069 zip code speak English at home.
30.6% of residents speak Spanish at home (60% very well, 16% well, 17% not well, 7% not at all).
2.8% of residents speak other Indo-European language at home (80% very well, 15% well, 5% not well, 1% not at all).
7.1% of residents speak Asian or Pacific Island language at home (53% very well, 24% well, 23% not well).
0.4% of residents speak other language at home (78% very well, 13% well, 9% not well).
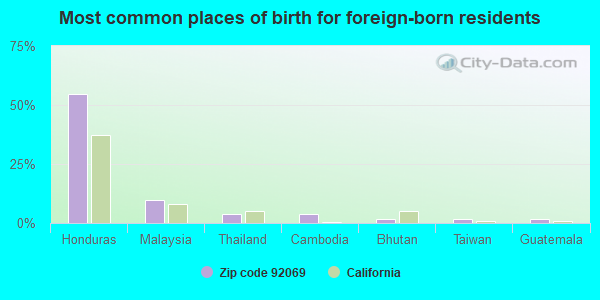
Foreign born population: 12,587 (27.2%) (54.0% of them are naturalized citizens)
Major facilities with environmental interests located in this zip code:
HUGHES CIRCUITS INC (540 S PACIFIC ST in SAN MARCOS, CA)
STATE MASTER (California - Hazardous Waste Tracking) - HAZARDOU WASTE PROGRAM HAZARDOUS WASTE BIENNIAL REPORTER (Resource Conservation and Recovery Act (tracking hazardous waste)) Large Quantity Generators, more that 1000 kg of hazardous waste/month (Resource Conservation and Recovery Act (tracking hazardous waste)) Large Quantity Generators, more that 1000 kg of hazardous waste/month (Resource Conservation and Recovery Act (tracking hazardous waste)) - notification Business NAICS classification: BARE PRINTED CIRCUIT BOARD MANUFACTURING. Organizations: JERRY HUGHES (CONTACT/OPERATOR)
NAPP SYSTEMS USA INCORPORATED (360 SOUTH PACIFIC STREET in SAN MARCOS, CA)
STATE MASTER (California - Hazardous Waste Tracking) - HAZARDOU WASTE PROGRAM CRITERIA AND HAZARDOUS AIR POLLUTANT INVENTORY (Inventory of air pollution sources) National Pollutant Discharge Elimination System NON-MAJOR (Tracking pollutant discharge elimination systems) - permit HAZARDOUS WASTE BIENNIAL REPORTER (Resource Conservation and Recovery Act (tracking hazardous waste)) Small Quantity Generators, between 100 kg and 1000 kg of hazardous waste/month (Resource Conservation and Recovery Act (tracking hazardous waste)) - notification TRI REPORTER (Tracking of toxic chemicals releasing facilities) Business SIC classification: PLATEMAKING AND RELATED SERVICES; COATING, ENGRAVING, AND ALLIED SERVICES Organizations: MACDERMID INC (CONTACT/OWNER)
Alternative names: MACDERMID PRINTING SOLUTIONS, NAPP SYS. INC., NAPP SYS. INC.
CHEVRON STATION NO 202870 (1200 W SAN MARCOS BLVD in SAN MARCOS, CA)
STATE MASTER (California - Hazardous Waste Tracking) - HAZARDOU WASTE PROGRAM CRITERIA AND HAZARDOUS AIR POLLUTANT INVENTORY (Inventory of air pollution sources) Large Quantity Generators, more that 1000 kg of hazardous waste/month (Resource Conservation and Recovery Act (tracking hazardous waste)) Business SIC classification: GASOLINE SERVICE STATIONS Organizations: CHEVRON STATIONS INC. (CONTACT/OPERATOR)
, CHEVRON PRODUCTS CO. (CONTACT/OWNER)
FLUID COMPONENTS INC (1755 LA COSTA MEADOWS DR in SAN MARCOS, CA)
STATE MASTER (California - Hazardous Waste Tracking) - HAZARDOU WASTE PROGRAM Small Quantity Generators, between 100 kg and 1000 kg of hazardous waste/month (Resource Conservation and Recovery Act (tracking hazardous waste)) - notification Alternative names: FLUID COMPONENTS INTL LLC
HUNTER INDUSTRIES (1940 DIAMOND ST in SAN MARCOS, CA)
STATE MASTER (California - Hazardous Waste Tracking) - HAZARDOU WASTE PROGRAM CRITERIA AND HAZARDOUS AIR POLLUTANT INVENTORY (Inventory of air pollution sources) Small Quantity Generators, between 100 kg and 1000 kg of hazardous waste/month (Resource Conservation and Recovery Act (tracking hazardous waste)) Business SIC classification: FARM MACHINERY AND EQUIPMENT Business NAICS classification: OTHER METAL VALVE AND PIPE FITTING MANUFACTURING.
AMISTAR (237 VIA VERA CRUZ in SAN MARCOS, CA)
STATE MASTER (California - Hazardous Waste Tracking) - HAZARDOU WASTE PROGRAM Small Quantity Generators, between 100 kg and 1000 kg of hazardous waste/month (Resource Conservation and Recovery Act (tracking hazardous waste)) - notification Business NAICS classification: ELECTRONIC CONNECTOR MANUFACTURING. Organizations: CORPORATION (CONTACT/OWNER)
GOLDEN STATE GRAPHICS (177 VALLECITOS DE ORO in SAN MARCOS, CA)
STATE MASTER (California - Hazardous Waste Tracking) - HAZARDOU WASTE PROGRAM CRITERIA AND HAZARDOUS AIR POLLUTANT INVENTORY (Inventory of air pollution sources) Small Quantity Generators, between 100 kg and 1000 kg of hazardous waste/month (Resource Conservation and Recovery Act (tracking hazardous waste)) - notification Business SIC classification: COMMERCIAL ART AND GRAPHIC DESIGN Business NAICS classification: COMMERCIAL LITHOGRAPHIC PRINTING. Organizations: ALAN KATZ (CONTACT/OWNER)
Alternative names: GSG LLC, REPRINTS INC
GRANDWOOD INC (1305 ARMORLITE DR in SAN MARCOS, CA)
STATE MASTER (California - Hazardous Waste Tracking) - HAZARDOU WASTE PROGRAM CRITERIA AND HAZARDOUS AIR POLLUTANT INVENTORY (Inventory of air pollution sources) Small Quantity Generators, between 100 kg and 1000 kg of hazardous waste/month (Resource Conservation and Recovery Act (tracking hazardous waste)) Business SIC classification: WOOD HOUSEHOLD FURNITURE, EXCEPT UPHOLSTERED Business NAICS classification: NONUPHOLSTERED WOOD HOUSEHOLD FURNITURE MANUFACTURING.
EQUILON ENTERPRISES (679 SAN MARCOS SAP NO 121715 in SAN MARCOS, CA) . Federal Facility
STATE MASTER (California - Hazardous Waste Tracking) - HAZARDOU WASTE PROGRAM CRITERIA AND HAZARDOUS AIR POLLUTANT INVENTORY (Inventory of air pollution sources) Small Quantity Generators, between 100 kg and 1000 kg of hazardous waste/month (Resource Conservation and Recovery Act (tracking hazardous waste)) - notification Business SIC classification: GASOLINE SERVICE STATIONS Alternative names: TEXACO #121715, TEXACO SERVICE STATION
CHEVRON STATION 9 3496 (110 RANCHO SANTE FE RD in SAN MARCOS, CA)
STATE MASTER (California - Hazardous Waste Tracking) - HAZARDOU WASTE PROGRAM CRITERIA AND HAZARDOUS AIR POLLUTANT INVENTORY (Inventory of air pollution sources) Small Quantity Generators, between 100 kg and 1000 kg of hazardous waste/month (Resource Conservation and Recovery Act (tracking hazardous waste)) - notification Business SIC classification: GASOLINE SERVICE STATIONS Organizations: CHEVRON USA PRODUCTS CO (CONTACT/OWNER)
Alternative names: CHEVRON 93496, CHEVRON / RANCHO SANTA FE RD
IMEB INCORPORATED (170 VALLECITOS DE ORO in SAN MARCOS, CA)
STATE MASTER (California - Hazardous Waste Tracking) - HAZARDOU WASTE PROGRAM Small Quantity Generators, between 100 kg and 1000 kg of hazardous waste/month (Resource Conservation and Recovery Act (tracking hazardous waste)) Organizations: JOHN O`BRIEN (CONTACT/OPERATOR)
ALVIN M DUNN ELEMENTARY SCHOOL (3697 LA MIRADA in SAN MARCOS, CA)
(Geographic Names Information System) (National Center for Education Statistics) - STATE ID-6039069 Organizations: SAN MARCOS UNIFIED (SCHOOL DISTRICT)
Alternative names: DUNN (ALVIN M.) ELEMENTARY
CASEYS AUTO MACHINE (120 N PACIFIC ST STE G3 in SAN MARCOS, CA)
STATE MASTER (California - Hazardous Waste Tracking) - HAZARDOU WASTE PROGRAM Small Quantity Generators, between 100 kg and 1000 kg of hazardous waste/month (Resource Conservation and Recovery Act (tracking hazardous waste)) - notification Organizations: CASEY RUMMERFIELD (CONTACT/OWNER)
Housing units lacking complete plumbing facilities: 0.5% Housing units lacking complete kitchen facilities: 0.8%
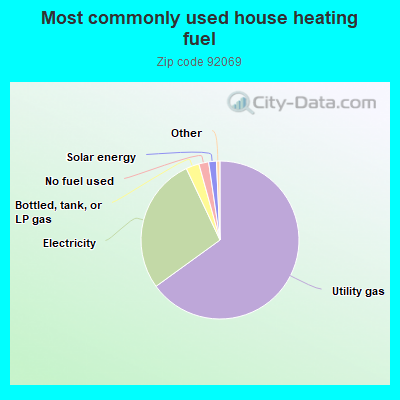
65.1%Utility gas
28.0%Electricity
2.7%Bottled, tank, or LP gas
2.0%No fuel used
1.6%Solar energy
Population in 1990: 45,382. Population change in the 1990s: +7,276 (+16.0%).
Place of birth for U.S.-born residents:
This state: 25,048
Northeast: 1,886
Midwest: 2,318
South: 1,904
West: 1,925
46% of the 92069 zip code residents lived in the same house 5 years ago. Out of people who lived in different houses, 75% lived in this county. Out of people who lived in different counties, 50% lived in California.
91% of the 92069 zip code residents lived in the same house 1 year ago. Out of people who lived in different houses, 69% moved from this county. Out of people who lived in different houses, 11% moved from different county within same state. Out of people who lived in different houses, 11% moved from different state. Out of people who lived in different houses, 9% moved from abroad.
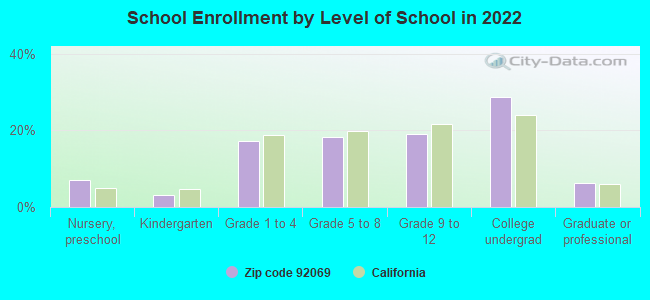
Private vs. public school enrollment:
Students in private schools in grades 1 to 8 (elementary and middle school): 258
Here:
5.5%
California:
10.5%
Students in private schools in grades 9 to 12 (high school): 98
Here:
3.9%
California:
8.5%
Students in private undergraduate colleges: 326
Here:
8.6%
California:
15.9%
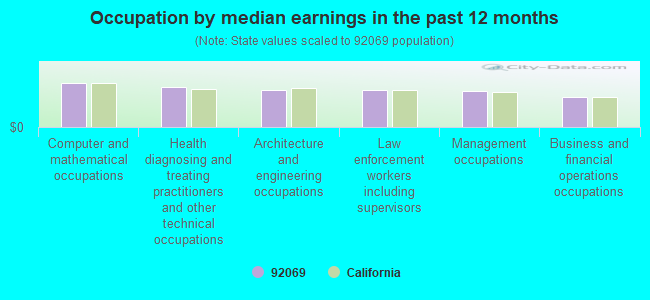
Occupation by median earnings in the past 12 months ($)
111,229Computer and mathematical occupations
100,899Health diagnosing and treating practitioners and other technical occupations
93,680Architecture and engineering occupations
93,063Law enforcement workers including supervisors
90,933Management occupations
76,184Business and financial operations occupations
Companies with biggest federal contracts located in this zip code (SAN MARCOS, CA):
TRUAX ENGINEERING INC (1475 PALOMAR DRIVE; small business) : $3,568,826 in 6 contractsfrom 1999 to 2002
Contracts for Defense Missile and Space Systems -- Management and Support (R&D), Defense Missile and Space Systems -- Engineering Development (R&D) by Air Force Signed by year:2000: $3,148,120; 2001: $0; 2002: $171,000; 2003: $0; 2004: $0; 2005: $0; 2006: $0.
Biggest contracts:
$2,432,737 with Air Force for Defense Missile and Space Systems -- Management and Support (R&D). Signed on 2000-09-12. Completion date: 2002-09-04.
$690,433, same as above.Signed on 2000-11-13. Completion date: 2001-09-15.
$171,000, same as above.Signed on 2002-09-23. Completion date: 2003-09-30.
$128,706, same as above.Signed on 1999-11-29. Completion date: 2000-09-07.
MCP COMPUTER PRODUCTS INC (1565-103 CREEK STREET; small business) : $1,905,845 in 29 contractsfrom 2001 to 2006
Contracts for Other ADP and Telecommunications Services (includes data storage on tapes, compact disks, etc.), Other Professional Services, ADP Input/Output and Storage Devices, ADP Support Equipment, and moreby Federal Technology Service, Office of the Assistant Secretary for Administration and Management, Department of Veterans Affairs, Army, and others Signed by year:2000: $0; 2001: $51,000; 2002: $30,000; 2003: $23,772; 2004: $170,034; 2005: $0; 2006: $1,631,039.
Biggest contracts:
$543,533 with Federal Technology Service for Other ADP and Telecommunications Services (includes data storage on tapes, compact disks, etc.). Taking place in MD. Signed on 2006-09-29. Completion date: 2006-10-30.
$309,770 with Office of the Assistant Secretary for Administration and Management for Other Professional Services. Taking place in DC. Signed on 2006-07-11. Completion date: 2006-08-11.
$161,540 with Department of Veterans Affairs for ADP Input/Output and Storage Devices. Signed on 2006-09-22. Completion date: 2007-12-31.
$89,842 with Federal Technology Service for Other ADP and Telecommunications Services (includes data storage on tapes, compact disks, etc.). Taking place in MD. Signed on 2006-09-29. Completion date: 2006-10-30.
TRACER ENVIRONMENTAL SCIENCES (970 LOS VALLECITOS BLVD ,; small business) : $1,186,376 in 7 contractsfrom 2003 to 2005
Contracts for Combination and Miscellaneous Instruments, Boxes, Cartons, and Crates, Other Research and Development -- Engineering Development (R&D), Decontaminating and Impregnating Equipment, and moreby Air Force, Army Signed by year:2000: $0; 2001: $0; 2002: $0; 2003: $903,930; 2004: $49,451; 2005: $232,995; 2006: $0.
Biggest contracts:
$927,804 with Air Force for Combination and Miscellaneous Instruments. Signed on 2003-02-20. Completion date: 2003-12-31.
$132,769 with Air Force for Boxes, Cartons, and Crates. Taking place in FL. Signed on 2005-04-15. Completion date: 2005-12-31.
$98,774 with Air Force for Other Research and Development -- Engineering Development (R&D). Signed on 2005-04-22. Completion date: 2005-12-31.
$60,000 with Army for Decontaminating and Impregnating Equipment. Signed on 2003-09-15. Completion date: 2003-11-10.
DEDRICK FAMILY PARTNERSHIP (; small business) : $864,856 in 30 contractsfrom 2003 to 2006
Contracts for Lease or Rental of Facilities -- Office Buildings by Public Buildings Service Signed by year:2000: $0; 2001: $0; 2002: $0; 2003: $284,216; 2004: $87,096; 2005: $261,288; 2006: $232,256.
Biggest contracts:
$29,032 with Public Buildings Service for Lease or Rental of Facilities -- Office Buildings. Signed on 2006-07-01. Completion date: 2006-09-30.
$29,032, same as above.Signed on 2006-07-01. Completion date: 2006-09-30.
$29,032, same as above.Signed on 2006-07-01. Completion date: 2006-09-30.
$29,032, same as above.Signed on 2006-04-01. Completion date: 2006-09-30.
INDEPENDENT ENERGY SOLUTIONS (1273 LINDA VISTA DRIVE; small business)
$774,954 with Navy for Solar Electric Power Systems. Signed on 2004-11-03. Completion date: 2005-10-31.
DIAMOND ENVIRONMENTAL SERVICES (807 E MISSION RD; small business) : $741,960 in 24 contractsfrom 2002 to 2006
Contracts for Waste Treatment and Storage, Facilities Operations Support Services, Individual Equipment, Lease or Rental of Equipment -- Toiletries, and moreby Navy, Army Signed by year:2000: $0; 2001: $0; 2002: $284,654; 2003: $104,184; 2004: $193,334; 2005: $150,720; 2006: $9,068.
Biggest contracts:
$170,106 with Navy for Waste Treatment and Storage. Signed on 2002-10-01. Completion date: 2003-08-31.
$114,548, same as above.Signed on 2002-10-17. Completion date: 2003-08-31.
$104,022, same as above.Signed on 2005-09-14. Completion date: 2006-08-31.
$101,778, same as above.Signed on 2003-08-29. Completion date: 2004-08-31.
AETHERCOMM INC (2910 NORMAN STRASSE RD; small business) : $666,127 in 15 contractsfrom 2000 to 2006
Contracts for Amplifiers, Electrical and Electronic assemblies, Boards, Cards, and Associated Hardware, Miscellaneous Communication Equipment, Ammunition -- Advanced Development (R&D), and moreby Defense Logistics Agency, Navy, Army, Air Force, and others Signed by year:2000: $153,475; 2001: $73,504; 2002: $75,140; 2003: $0; 2004: $169,440; 2005: $119,820; 2006: $74,748.
Biggest contracts:
$99,960 with Defense Logistics Agency for Amplifiers. Signed on 2004-09-24. Completion date: 2005-01-25.
$90,000 with Navy for Electrical and Electronic assemblies, Boards, Cards, and Associated Hardware. Signed on 2005-01-20. Completion date: 2005-07-05.
$75,140 with Army for Miscellaneous Communication Equipment. Signed on 2002-12-11. Completion date: 2003-08-31.
$74,748 with Air Force for Ammunition -- Advanced Development (R&D). Signed on 2006-06-06. Completion date: 2007-03-09.
CALIFORNIA TREE SERVICE, INC (334 MULBERRY DRIVE; small business) : $387,583 in 18 contractsfrom 2004 to 2006
Contracts for Landscaping/Groundskeeping Services, Maintenance, Repair or Alteration of Real Property -- Miscellaneous Buildings by Navy Signed by year:2000: $0; 2001: $0; 2002: $0; 2003: $0; 2004: $76,310; 2005: $243,021; 2006: $68,252.
Biggest contracts:
$68,252 with Navy for Landscaping/Groundskeeping Services. Signed on 2006-03-16. Completion date: 2006-06-08.
$53,101, same as above.Signed on 2005-12-13. Completion date: 2006-02-17.
$34,730 with Navy for Maintenance, Repair or Alteration of Real Property -- Miscellaneous Buildings. Signed on 2005-01-25. Completion date: 2005-02-28.
$29,958 with Navy for Landscaping/Groundskeeping Services. Signed on 2004-09-17. Completion date: 2004-10-15.
MARDEN SUSCO LLC (1550 LINDA VISTA DR) : $387,153 in 4 contractsfrom 2000 to 2004
$284,692 with Navy for Waste Disposal Equipment. Signed on 2004-03-12. Completion date: 2004-05-07.
$42,895 with Navy for Hose, Pipe, Tube, Lubrication, and Railing Fittings. Signed on 2003-04-02. Completion date: 2003-05-16.
$31,478, same as above.Signed on 2002-10-09. Completion date: 2002-10-31.
$28,088 with Navy for Fire Fighting Equipment. Signed on 2000-09-23. Completion date: 2000-10-20.
D-S-P (504 CALLE CAPISTRANO; small business) : $191,725 in 9 contractsfrom 2001 to 2005
Contracts for Other Management Support Services, Data Collection Services, Court Reporting Services by Navy Signed by year:2000: $0; 2001: $27,700; 2002: $75,600; 2003: $6,600; 2004: $103,200; 2005: -$21,375; 2006: $0.
Biggest contracts:
$66,800 with Navy for Other Management Support Services. Signed on 2002-06-05. Completion date: 2003-12-05.
$58,300 with Navy for Data Collection Services. Signed on 2004-04-21. Completion date: 2005-04-21.
$40,500 with Navy for Court Reporting Services. Signed on 2004-04-29. Completion date: 2006-04-30.
$27,700 with Navy for Other Management Support Services. Signed on 2001-03-12. Completion date: 2000-12-31.
Top industries in this zip code by the number of employees in 2005:
Administrative and Support and Waste Management and Remediation Services: Temporary Help Services (500-999 employees: 2 establishments, 250-499 employees: 1 establishment, 100-249 employees: 1 establishment, 50-99 employees: 1 establishment, 20-49 employees: 1 establishment, 5-9 employees: 1 establishment, 1-4 employees: 1 establishment)
2005 - 2018 National Fire Incident Reporting System (NFIRS) incidents
According to the data from the years 2005 - 2018 the average number of fires per year is 84. The highest number of fire incidents - 132 took place in 2007, and the least - 61 in 2009. The data has a decreasing trend.
When looking into fire subcategories, the most incidents belonged to: Structure Fires (35.3%), and Outside Fires (35.3%).
Fire incident types reported to NFIRS in Zip Code 92069


 Nearest zip codes: 92078, 92026, 92084, 92081, 92029, 92083.
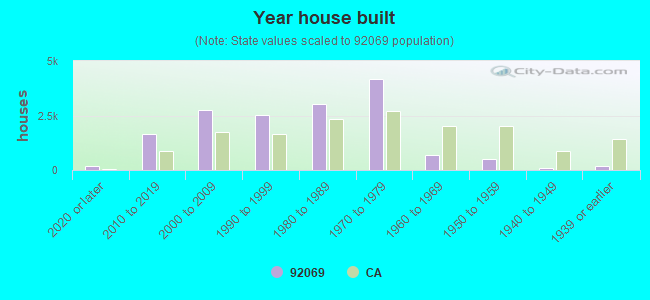


 According to the data from the years 2005 - 2018 the average number of fires per year is 84. The highest number of fire incidents - 132 took place in 2007, and the least - 61 in 2009. The data has a decreasing trend.
 When looking into fire subcategories, the most incidents belonged to: Structure Fires (35.3%), and Outside Fires (35.3%).