Estimated zip code population in 2022: 39,718 Zip code population in 2010: 43,267 Zip code population in 2000: 47,123
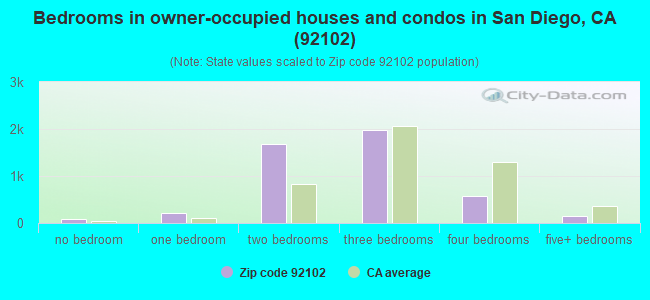
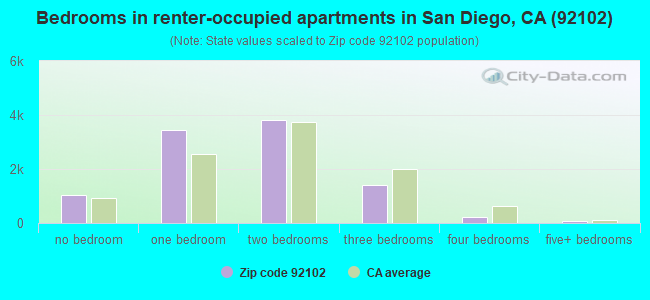
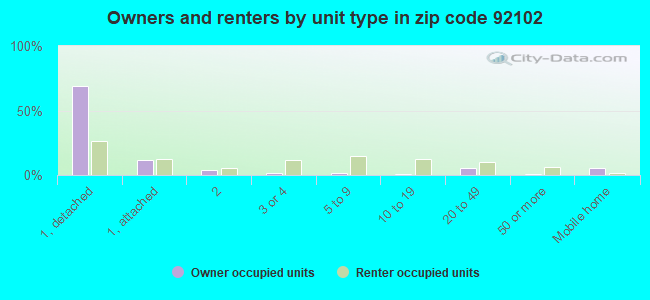
Houses and condos: 16,033 Renter-occupied apartments: 9,986
% of renters here:
68%
State:
44%
March 2022 cost of living index in zip code 92102: 122.9 (high, U.S. average is 100)
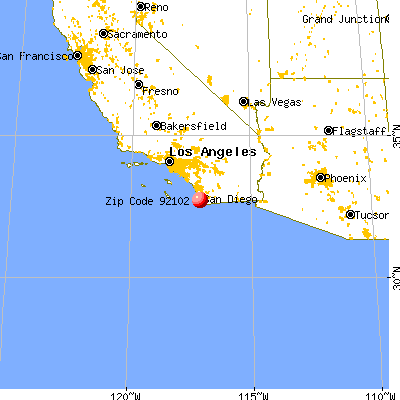
Land area: 4.6 sq. mi. Water area: 0.0 sq. mi.
Population density: 8,569 people per square mile
(high).
OSM Map
General Map
Google Map
MSN Map
OSM Map
General Map
Google Map
MSN Map
OSM Map
General Map
Google Map
MSN Map
OSM Map
General Map
Google Map
MSN Map
Please wait while loading the map...
Real estate property taxes paid for housing units in 2022:
This zip code:
0.4% ($2,670)
California:
0.7% ($4,831)
Median real estate property taxes paid for housing units with mortgages in 2022: $3,109 (0.5%) Median real estate property taxes paid for housing units with no mortgage in 2022: $1,423 (0.3%)
Estimated median house/condo value in 2022: $595,805
92102:
$595,805
California:
$715,900
According to our research of California and other state lists, there were 46 registered sex offenders living in 92102 zip code as of April 27, 2024. The ratio of all residents to sex offenders in zip code 92102 is 987 to 1. The ratio of registered sex offenders to all residents in this zip code is lower than the state average.
Median resident age:
This zip code:
34.4 years
California median age:
37.9 years
Average household size:
This zip code:
2.6 people
California:
2.8 people
Averages for the 2020 tax year for zip code 92102, filed in 2021:
Average Adjusted Gross Income (AGI) in 2020: $47,570 (Individual Income Tax Returns)
Here:
$47,570
State:
$95,910
Salary/wage: $43,732 (reported on 87.2% of returns)
Here:
$43,732
State:
$77,331
(% of AGI for various income ranges: 1293.0% for AGIs below $25k, 3971.6% for AGIs $25k-50k, 7291.9% for AGIs $50k-75k, 11342.1% for AGIs $75k-100k, 20044.0% for AGIs $100k-200k, 74570.8% for AGIs over 200k)
Taxable interest for individuals: $558 (reported on 18.1% of returns)
This zip code:
$558
California:
$2,294
(% of AGI for various income ranges: 3.8% for AGIs below $25k, 5.5% for AGIs $25k-50k, 14.4% for AGIs $50k-75k, 18.5% for AGIs $75k-100k, 54.4% for AGIs $100k-200k, 574.2% for AGIs over 200k)
Ordinary dividends: $2,730 (reported on 8.7% of returns)
Here:
$2,730
State:
$10,949
(% of AGI for various income ranges: 6.5% for AGIs below $25k, 9.9% for AGIs $25k-50k, 24.0% for AGIs $50k-75k, 56.0% for AGIs $75k-100k, 145.0% for AGIs $100k-200k, 1587.5% for AGIs over 200k)
Net capital gain/loss in AGI: +$8,411 (reported on 9.2% of returns)
Here:
+$8,411
State:
+$49,306
(% of AGI for various income ranges: 3.6% for AGIs below $25k, 11.7% for AGIs $25k-50k, 45.5% for AGIs $50k-75k, 96.8% for AGIs $75k-100k, 331.4% for AGIs $100k-200k, 9061.7% for AGIs over 200k)
Profit/loss from business: +$9,678 (reported on 16.3% of returns)
Here:
+$9,678
State:
+$15,671
(% of AGI for various income ranges: 171.0% for AGIs below $25k, 148.8% for AGIs $25k-50k, 139.0% for AGIs $50k-75k, 254.7% for AGIs $75k-100k, 714.9% for AGIs $100k-200k, 4110.8% for AGIs over 200k)
Taxable individual retirement arrangement distribution: $14,704 (reported on 2.1% of returns)
92102:
$14,704
California:
$23,505
(% of AGI for various income ranges: 9.2% for AGIs below $25k, 18.7% for AGIs $25k-50k, 44.2% for AGIs $50k-75k, 104.7% for AGIs $75k-100k, 190.1% for AGIs $100k-200k, 1327.5% for AGIs over 200k)
Self-employed (Keogh) retirement plans: $25,575 (reported on 0.2% of returns)
92102:
$25,575
California:
$30,163
(% of AGI for various income ranges: 852.5% for AGIs over 200k)
Total itemized deductions: $28,205 (reported on 6.1% of returns)
Here:
$28,205
State:
$39,517
(% of AGI for various income ranges: 22.2% for AGIs below $25k, 74.0% for AGIs $25k-50k, 223.3% for AGIs $50k-75k, 586.2% for AGIs $75k-100k, 1334.6% for AGIs $100k-200k, 8176.7% for AGIs over 200k)
Charity contributions: $5,009 (reported on 4.5% of returns)
Here:
$5,009
State:
$12,598
(% of AGI for various income ranges: 1.0% for AGIs below $25k, 7.5% for AGIs $25k-50k, 20.8% for AGIs $50k-75k, 66.5% for AGIs $75k-100k, 145.8% for AGIs $100k-200k, 1728.3% for AGIs over 200k)
Taxes paid: $7,970 (reported on 6.1% of returns)
92102:
$7,970
State:
$8,807
(% of AGI for various income ranges: 4.2% for AGIs below $25k, 16.4% for AGIs $25k-50k, 61.0% for AGIs $50k-75k, 200.1% for AGIs $75k-100k, 451.6% for AGIs $100k-200k, 1795.0% for AGIs over 200k)
Earned income credit: $2,144 (reported on 19.7% of returns)
Here:
$2,144
State:
$2,074
(% of AGI for various income ranges: 102.0% for AGIs below $25k, 66.7% for AGIs $25k-50k, 0.6% for AGIs $50k-75k)
Percentage of individuals using paid preparers for their 2020 taxes: 92.7%
Here:
93%
State:
92%
(% for various income ranges: 91.4% for AGIs below $25k, 92.8% for AGIs $25k-50k, 93.4% for AGIs $50k-75k, 94.0% for AGIs $75k-100k, 93.8% for AGIs $100k-200k, 97.5% for AGIs over 200k)
Averages for the 2012 tax year for zip code 92102, filed in 2013:
Average Adjusted Gross Income (AGI) in 2012: $34,475 (Individual Income Tax Returns)
Here:
$34,475
State:
$72,726
Salary/wage: $32,527 (reported on 88.9% of returns)
Here:
$32,527
State:
$59,079
(% of AGI for various income ranges: 82.3% for AGIs below $25k, 89.9% for AGIs $25k-50k, 88.1% for AGIs $50k-75k, 84.3% for AGIs $75k-100k, 79.6% for AGIs $100k-200k, 57.6% for AGIs over 200k)
Taxable interest for individuals: $442 (reported on 16.2% of returns)
This zip code:
$442
California:
$2,146
(% of AGI for various income ranges: 0.2% for AGIs below $25k, 0.1% for AGIs $25k-50k, 0.2% for AGIs $50k-75k, 0.3% for AGIs $75k-100k, 0.4% for AGIs $100k-200k, 0.3% for AGIs over 200k)
Ordinary dividends: $2,592 (reported on 6.4% of returns)
Here:
$2,592
State:
$9,308
(% of AGI for various income ranges: 0.3% for AGIs below $25k, 0.3% for AGIs $25k-50k, 0.4% for AGIs $50k-75k, 0.5% for AGIs $75k-100k, 0.8% for AGIs $100k-200k, 1.6% for AGIs over 200k)
Net capital gain/loss in AGI: +$8,171 (reported on 5.5% of returns)
Here:
+$8,171
State:
+$30,460
(% of AGI for various income ranges: 0.6% for AGIs $75k-100k, 1.3% for AGIs $100k-200k, 15.3% for AGIs over 200k)
Profit/loss from business: +$10,512 (reported on 14.6% of returns)
Here:
+$10,512
State:
+$17,064
(% of AGI for various income ranges: 9.4% for AGIs below $25k, 3.2% for AGIs $25k-50k, 2.6% for AGIs $50k-75k, 3.1% for AGIs $75k-100k, 4.0% for AGIs $100k-200k, 3.1% for AGIs over 200k)
Taxable individual retirement arrangement distribution: $11,648 (reported on 2.6% of returns)
92102:
$11,648
California:
$19,557
(% of AGI for various income ranges: 0.4% for AGIs below $25k, 0.5% for AGIs $25k-50k, 0.9% for AGIs $50k-75k, 1.3% for AGIs $75k-100k, 2.6% for AGIs $100k-200k)
Self-employment retirement plans: $14,375 (reported on 0.2% of returns)
92102:
$14,375
California:
$24,530
Total itemized deductions: $20,205 (26% of AGI, reported on 16.1% of returns)
Here:
$20,205
State:
$34,004
Here:
26.0% of AGI
State:
22.7% of AGI
(% of AGI for various income ranges: 3.6% for AGIs below $25k, 6.5% for AGIs $25k-50k, 10.6% for AGIs $50k-75k, 14.1% for AGIs $75k-100k, 17.2% for AGIs $100k-200k, 15.2% for AGIs over 200k)
Charity contributions: $2,376 (reported on 11.8% of returns)
Here:
$2,376
State:
$4,659
(% of AGI for various income ranges: 0.2% for AGIs below $25k, 0.5% for AGIs $25k-50k, 1.0% for AGIs $50k-75k, 1.2% for AGIs $75k-100k, 1.6% for AGIs $100k-200k, 1.5% for AGIs over 200k)
Taxes paid: $6,235 (reported on 16.0% of returns)
92102:
$6,235
State:
$14,448
(% of AGI for various income ranges: 0.5% for AGIs below $25k, 1.2% for AGIs $25k-50k, 2.8% for AGIs $50k-75k, 4.7% for AGIs $75k-100k, 6.6% for AGIs $100k-200k, 7.9% for AGIs over 200k)
Earned income credit: $2,381 (reported on 27.2% of returns)
Here:
$2,381
State:
$2,286
(% of AGI for various income ranges: 7.3% for AGIs below $25k, 1.2% for AGIs $25k-50k)
Percentage of individuals using paid preparers for their 2012 taxes: 63.2%
Here:
63%
State:
64%
(% for various income ranges: 64.5% for AGIs below $25k, 62.7% for AGIs $25k-50k, 59.5% for AGIs $50k-75k, 57.9% for AGIs $75k-100k, 63.5% for AGIs $100k-200k, 76.9% for AGIs over 200k)
Averages for the 2004 tax year for zip code 92102, filed in 2005:
Average Adjusted Gross Income (AGI) in 2004: $28,947 (Individual Income Tax Returns)
Here:
$28,947
State:
$58,600
Salary/wage: $27,846 (reported on 90.4% of returns)
Here:
$27,846
State:
$49,455
(% of AGI for various income ranges: 104.2% for AGIs below $10k, 89.4% for AGIs $10k-25k, 92.1% for AGIs $25k-50k, 89.7% for AGIs $50k-75k, 84.8% for AGIs $75k-100k, 63.7% for AGIs over 100k)
Taxable interest for individuals: $689 (reported on 22.5% of returns)
This zip code:
$689
California:
$2,365
(% of AGI for various income ranges: 1.7% for AGIs below $10k, 0.4% for AGIs $10k-25k, 0.3% for AGIs $25k-50k, 0.4% for AGIs $50k-75k, 0.7% for AGIs $75k-100k, 1.2% for AGIs over 100k)
Taxable dividends: $1,846 (reported on 6.9% of returns)
Here:
$1,846
State:
$4,746
(% of AGI for various income ranges: 0.8% for AGIs below $10k, 0.2% for AGIs $10k-25k, 0.2% for AGIs $25k-50k, 0.5% for AGIs $50k-75k, 0.9% for AGIs $75k-100k, 1.1% for AGIs over 100k)
Net capital gain/loss: +$9,049 (reported on 5.8% of returns)
Here:
+$9,049
State:
+$23,418
(% of AGI for various income ranges: 0.1% for AGIs below $10k, 0.2% for AGIs $10k-25k, 0.2% for AGIs $25k-50k, 0.3% for AGIs $50k-75k, 1.2% for AGIs $75k-100k, 11.7% for AGIs over 100k)
Profit/loss from business: +$8,364 (reported on 11.7% of returns)
Here:
+$8,364
State:
+$16,826
(% of AGI for various income ranges: 11.0% for AGIs below $10k, 4.9% for AGIs $10k-25k, 2.1% for AGIs $25k-50k, 2.6% for AGIs $50k-75k, 3.4% for AGIs $75k-100k, 3.7% for AGIs over 100k)
IRA payment deduction: $2,302 (reported on 1.3% of returns)
92102:
$2,302
California:
$3,192
(% of AGI for various income ranges: 0.2% for AGIs below $10k, 0.1% for AGIs $10k-25k, 0.1% for AGIs $25k-50k, 0.1% for AGIs $50k-75k, 0.1% for AGIs $75k-100k, 0.1% for AGIs over 100k)
Self-employed pension: $8,727 (reported on 0.3% of returns)
Here:
$8,727
California:
$17,688
Total itemized deductions: $18,330 (31% of AGI, reported on 18.1% of returns)
Here:
$18,330
State:
$28,113
Here:
30.5% of AGI
State:
25.3% of AGI
(% of AGI for various income ranges: 9.8% for AGIs below $10k, 5.4% for AGIs $10k-25k, 9.5% for AGIs $25k-50k, 16.1% for AGIs $50k-75k, 19.7% for AGIs $75k-100k, 17.0% for AGIs over 100k)
Charity contributions deductions: $2,273 (4% of AGI, reported on 14.2% of returns)
Here:
$2,273
State:
$3,923
Here:
3.5% of AGI
State:
3.3% of AGI
(% of AGI for various income ranges: 0.5% for AGIs below $10k, 0.4% for AGIs $10k-25k, 0.8% for AGIs $25k-50k, 1.6% for AGIs $50k-75k, 2.2% for AGIs $75k-100k, 2.0% for AGIs over 100k)
Total tax: $3,609 (reported on 62.4% of returns)
92102:
$3,609
State:
$10,761
(% of AGI for various income ranges: 3.7% for AGIs below $10k, 3.3% for AGIs $10k-25k, 5.9% for AGIs $25k-50k, 9.3% for AGIs $50k-75k, 11.0% for AGIs $75k-100k, 17.8% for AGIs over 100k)
Earned income credit: $1,848 (reported on 27.1% of returns)
Here:
$1,848
State:
$1,763
Percentage of individuals using paid preparers for their 2004 taxes: 69.4%
Here:
69%
State:
66%
(% for various income ranges: 66.0% for AGIs below $10k, 73.6% for AGIs $10k-25k, 67.5% for AGIs $25k-50k, 64.1% for AGIs $50k-75k, 66.2% for AGIs $75k-100k, 73.4% for AGIs over 100k)
Likely homosexual households (counted as self-reported same-sex unmarried-partner households)
Lesbian couples: 0.1% of all households
Gay men: 0.5% of all households
Household received Food Stamps/SNAP in the past 12 months: 2,382 Household did not receive Food Stamps/SNAP in the past 12 months: 12,462
Women who had a birth in the past 12 months: 572 (386 now married, 186 unmarried) Women who did not have a birth in the past 12 months: 10,545 (3,535 now married, 7,037 unmarried)
Housing units in zip code 92102 with a mortgage: 3,436 (179 second mortgage, 29 home equity loan, 132 both second mortgage and home equity loan) Houses without a mortgage: 35
Median monthly owner costs for units with a mortgage: $2,304 Median monthly owner costs for units without a mortgage: $582
Residents with income below the poverty level in 2022:
This zip code:
16.6%
Whole state:
12.2%
Residents with income below 50% of the poverty level in 2022:
This zip code:
9.1%
Whole state:
6.2%
Median number of rooms in houses and condos:
Here:
5.3
State:
6.0
Median number of rooms in apartments:
Here:
3.6
State:
3.9
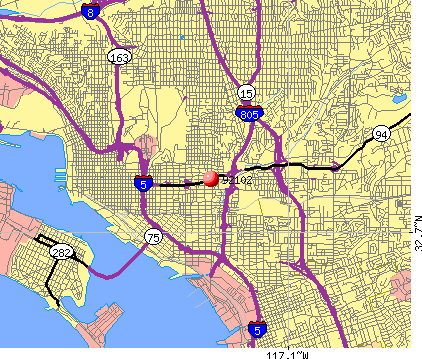
Notable locations in this zip code not listed on our city pages
Notable locations in zip code 92102: Balboa Park Municipal Golf Course (A), Valencia Park Branch San Diego Public Library (B), Villa Montezuma (C), Golden Hill Community Center (D), San Diego Fire - Rescue Department Station 11 (E). Display/hide their locations on the map
Churches in zip code 92102 include: Apostolic Faith Temple (A), Bethel African Methodist Episcopal Church (B), Buddhist Temple of San Diego (C), Christ Church of San Diego (D), Christ United Presbyterian Church (E), Iglesia Presbiteriana Hispana (F), Kingdom Hall of Jehovahs Witnesses (G), San Diego Church of Christ (H), Second Church (I). Display/hide their locations on the map
4,061 married couples with children.
2,955 single-parent households (564 men, 2,391 women).
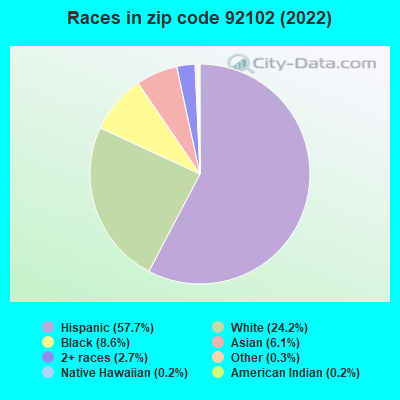
46.0% of residents of 92102 zip code speak English at home.
47.6% of residents speak Spanish at home (59% very well, 16% well, 16% not well, 9% not at all).
0.7% of residents speak other Indo-European language at home (95% very well, 5% well).
4.6% of residents speak Asian or Pacific Island language at home (38% very well, 28% well, 26% not well, 8% not at all).
0.7% of residents speak other language at home (59% very well, 27% well, 14% not well).
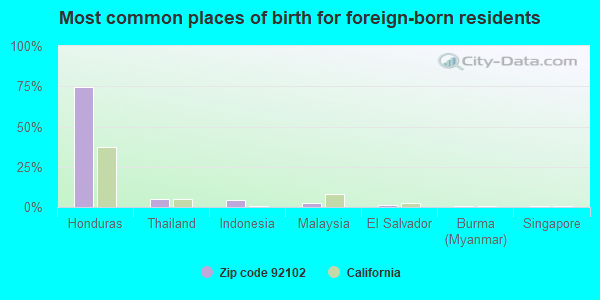
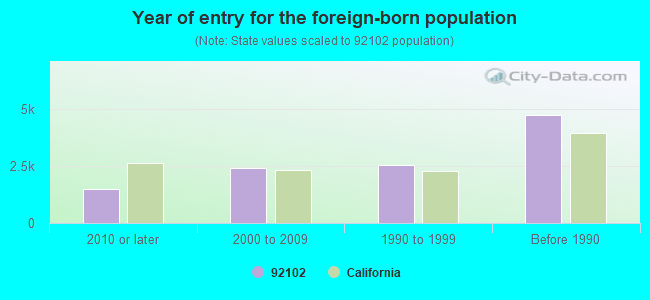
Foreign born population: 10,717 (27.0%) (47.7% of them are naturalized citizens)
Major facilities with environmental interests located in this zip code:
LUPES RADIATOR SHOP (2660-B IMPERIAL AVE in SAN DIEGO, CA)
STATE MASTER (California - Hazardous Waste Tracking) - HAZARDOU WASTE PROGRAM Small Quantity Generators, between 100 kg and 1000 kg of hazardous waste/month (Resource Conservation and Recovery Act (tracking hazardous waste)) - notification Organizations: JOSE GUADALUPE NODAL OWNER (CONTACT/OWNER)
MOHR MAN (3386 SUNRISE in SAN DIEGO, CA)
STATE MASTER (California - Hazardous Waste Tracking) - HAZARDOU WASTE PROGRAM Small Quantity Generators, between 100 kg and 1000 kg of hazardous waste/month (Resource Conservation and Recovery Act (tracking hazardous waste)) - notification Business NAICS classification: OTHER COMMERCIAL AND SERVICE INDUSTRY MACHINERY MANUFACTURING. Organizations: BARRY MOHR (CONTACT/OWNER)
Alternative names: MOHR MANUFACTURING
CALIFORNIA PLATING (2802 IMPERIAL AVE in SAN DIEGO, CA)
STATE MASTER (California - Hazardous Waste Tracking) - HAZARDOU WASTE PROGRAM CRITERIA AND HAZARDOUS AIR POLLUTANT INVENTORY (Inventory of air pollution sources) Small Quantity Generators, between 100 kg and 1000 kg of hazardous waste/month (Resource Conservation and Recovery Act (tracking hazardous waste)) Business SIC classification: ELECTROPLATING, PLATING, POLISHING, ANODIZING, AND COLORING Business NAICS classification: AUTOMOTIVE BODY, PAINT, AND INTERIOR REPAIR AND MAINTENANCE.
MONTBLEAU AND ASSOC INC (555 RAVEN ST in SAN DIEGO, CA)
STATE MASTER (California - Hazardous Waste Tracking) - HAZARDOU WASTE PROGRAM Small Quantity Generators, between 100 kg and 1000 kg of hazardous waste/month (Resource Conservation and Recovery Act (tracking hazardous waste)) - notification Organizations: RON MONTBLEAU (CONTACT/OWNER)
NATIONAL BRAKE SERVICE INC (2040 IMPERIAL AVE in SAN DIEGO, CA)
STATE MASTER (California - Hazardous Waste Tracking) - HAZARDOU WASTE PROGRAM Small Quantity Generators, between 100 kg and 1000 kg of hazardous waste/month (Resource Conservation and Recovery Act (tracking hazardous waste)) Business NAICS classification: GENERAL AUTOMOTIVE REPAIR.
HORTON ELEMENTARY (5050 GUYMON ST. in SAN DIEGO, CA)
(National Center for Education Statistics) - STATE ID-6039754 Organizations: SAN DIEGO UNIFIED (SCHOOL DISTRICT)
KIMBROUGH (JACK) ELEMENTARY (321 HOITT ST. in SAN DIEGO, CA)
(National Center for Education Statistics) - STATE ID-6114292 Organizations: SAN DIEGO UNIFIED (SCHOOL DISTRICT)
KING (MARTIN LUTHER) ELEMENTARY (415 31ST ST. in SAN DIEGO, CA)
(National Center for Education Statistics) - STATE ID-6040190 Organizations: SAN DIEGO UNIFIED (SCHOOL DISTRICT)
MCGILL SCHOOL OF SUCCESS (3025 FIR ST. in SAN DIEGO, CA)
(National Center for Education Statistics) - STATE ID-6113211 Organizations: SAN DIEGO UNIFIED (SCHOOL DISTRICT)
CHOLLAS/MEAD ELEMENTARY (545 45TH ST. in SAN DIEGO, CA)
(National Center for Education Statistics) - STATE ID-6039382 Organizations: SAN DIEGO UNIFIED (SCHOOL DISTRICT)
GRANT HILL SUB (INTERSECTION OF 30TH in SAN DIEGO, CA)
Large Quantity Generators, more that 1000 kg of hazardous waste/month (Resource Conservation and Recovery Act (tracking hazardous waste)) Organizations: SAN DIEGO GAS AND ELECTRIC (CONTACT/OPERATOR)
MT HOPE CEMETERY (3751 MARTIN L KING WAY in SAN DIEGO, CA)
(Resource Conservation and Recovery Act (tracking hazardous waste)) Organizations: CITY OF SAN DIEGO (CONTACT/OWNER)
JOHANSON DIELECTRICS, INC. (823 GATEWAY CENTER WAY in SAN DIEGO, CA)
HAZARDOUS WASTE BIENNIAL REPORTER (Resource Conservation and Recovery Act (tracking hazardous waste)) Large Quantity Generators, more that 1000 kg of hazardous waste/month (Resource Conservation and Recovery Act (tracking hazardous waste)) Business NAICS classification: SEMICONDUCTOR AND RELATED DEVICE MANUFACTURING.
Housing units lacking complete plumbing facilities: 0.8% Housing units lacking complete kitchen facilities: 2.0%
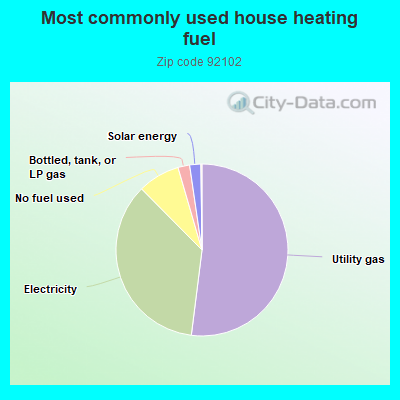
52.0%Utility gas
35.6%Electricity
7.9%No fuel used
2.2%Bottled, tank, or LP gas
2.1%Solar energy
Population in 1990: 45,265. Population change in the 1990s: +1,858 (+4.1%).
Place of birth for U.S.-born residents:
This state: 21,890
Northeast: 1,512
Midwest: 1,502
South: 2,397
West: 1,047
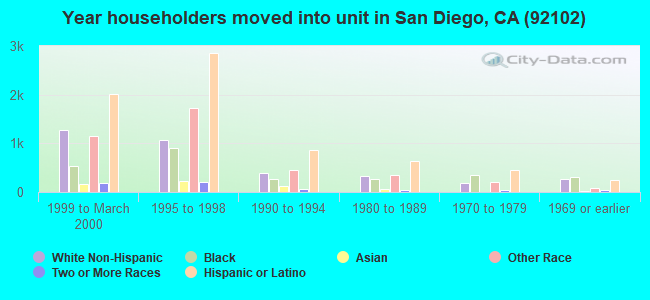
46% of the 92102 zip code residents lived in the same house 5 years ago. Out of people who lived in different houses, 84% lived in this county. Out of people who lived in different counties, 50% lived in California.
87% of the 92102 zip code residents lived in the same house 1 year ago. Out of people who lived in different houses, 69% moved from this county. Out of people who lived in different houses, 9% moved from different county within same state. Out of people who lived in different houses, 18% moved from different state. Out of people who lived in different houses, 2% moved from abroad.
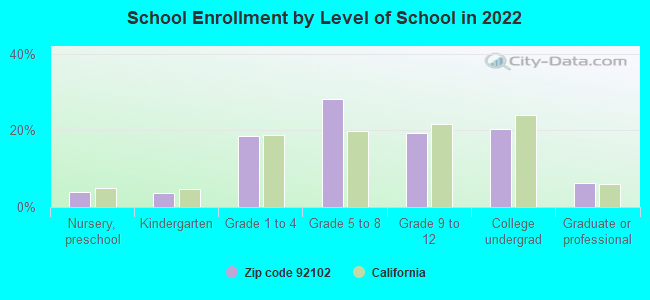
Private vs. public school enrollment:
Students in private schools in grades 1 to 8 (elementary and middle school): 119
Here:
2.9%
California:
10.5%
Students in private schools in grades 9 to 12 (high school): 67
Here:
3.9%
California:
8.5%
Students in private undergraduate colleges: 274
Here:
15.1%
California:
15.9%
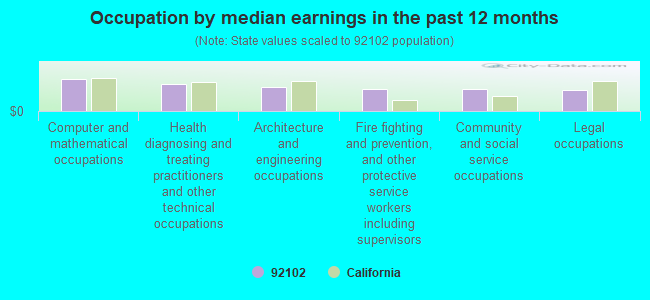
Occupation by median earnings in the past 12 months ($)
110,651Computer and mathematical occupations
95,352Health diagnosing and treating practitioners and other technical occupations
84,544Architecture and engineering occupations
76,635Fire fighting and prevention, and other protective service workers including supervisors
76,420Community and social service occupations
74,466Legal occupations
Companies with biggest federal contracts located in this zip code (SAN DIEGO, CA):
GERWEND ENTERPRISES INC (2952 MARKET STREET) : $57,507,546 in 772 contractsfrom 1999 to 2006
Contracts for Other Housekeeping Services, Operation of Government-Owned Facilities -- Other Administrative Facilities and Service Buildings, Custodial Janitorial Services, Logistics Support Services, and moreby Navy, Department of Veterans Affairs, United States Coast Guard (disused code: now 7008), Army, and others Signed by year:2000: $13,933,851; 2001: $12,371,762; 2002: $26,468,929; 2003: $698,807; 2004: $1,447,424; 2005: $1,179,944; 2006: $517,054.
Biggest contracts:
$3,789,781 with Navy for Other Housekeeping Services. Taking place in VA. Signed on 2000-12-19. Completion date: 2001-04-30.
$929,552, same as above.Signed on 2002-03-09. Completion date: 2003-03-08.
$910,737 with Navy for Other Housekeeping Services. Signed on 2000-10-01. Completion date: 2001-08-31.
$706,590 with Navy for Other Housekeeping Services. Taking place in VA. Signed on 2001-12-06. Completion date: 2002-08-31.
NAVAL COATING INC (3475 E STREET; small business) : $11,504,920 in 45 contractsfrom 2002 to 2006
Contracts for Maintenance, Repair and Rebuilding of Equipment -- Ship and Marine Equipment by Navy Signed by year:2000: $0; 2001: $0; 2002: $2,060,757; 2003: $3,309,228; 2004: $3,209,794; 2005: $1,775,141; 2006: $1,150,000.
Biggest contracts:
$654,805 with Navy for Maintenance, Repair and Rebuilding of Equipment -- Ship and Marine Equipment. Signed on 2004-10-20. Completion date: 2005-09-30.
$550,000, same as above.Signed on 2005-01-26. Completion date: 2005-09-30.
$517,114, same as above.Signed on 2004-09-20. Completion date: 2004-09-30.
$500,000, same as above.Signed on 2005-12-01. Completion date: 2006-09-30.
E & E INDUSTRIES, INC (4931 MARKET ST; small business) : $8,909,608 in 90 contractsfrom 1999 to 2006
Contracts for Maintenance, Repair and Rebuilding of Equipment -- Electrical and Electronic Equipment Components, Maintenance, Repair or Alteration of Real Property -- Office Buildings, Lease or Rental of Equipment -- Construction, Mining, Excavating, and Highway Maintenance Equipment, Maintenance, Repair or Alteration of Real Property -- Other Administrative Facilities and Service Buildings, and moreby Navy, Air Force, Department of Defense, Department of Veterans Affairs, and others Signed by year:2000: $1,711,562; 2001: $367,090; 2002: $1,310,344; 2003: $1,926,390; 2004: $1,781,251; 2005: $1,068,182; 2006: $255,578.
Biggest contracts:
$902,945 with Navy for Maintenance, Repair and Rebuilding of Equipment -- Electrical and Electronic Equipment Components. Signed on 2003-10-01. Completion date: 2004-09-30.
$640,000 with Air Force for Maintenance, Repair or Alteration of Real Property -- Office Buildings. Signed on 2003-01-16. Completion date: 2003-09-30.
$600,638, same as above.Signed on 2005-10-03. Completion date: 2008-09-30.
$599,969, same as above.Signed on 2002-01-03. Completion date: 2002-09-30.
WESTERN PUMP, INC (3235 F ST; small business) : $2,797,431 in 151 contractsfrom 1999 to 2006
Contracts for Facilities Operations Support Services, Surveillance Services, Maintenance, Repair or Alteration of Real Property -- Fuel Supply Facilities, Maintenance, Repair and Rebuilding of Equipment -- Fuels, Lubricants, Oils, and Waxes, and moreby Navy, U.S. Customs Service, Air Force Signed by year:2000: $54,150; 2001: $271,467; 2002: $719,833; 2003: $458,470; 2004: $503,666; 2005: $490,241; 2006: $243,967.
Biggest contracts:
$242,539 with Navy for Facilities Operations Support Services. Signed on 2005-09-28. Completion date: 2006-09-30.
$229,846 with Navy for Surveillance Services. Signed on 2002-09-19. Completion date: 2004-09-30.
$196,035 with Navy for Maintenance, Repair or Alteration of Real Property -- Fuel Supply Facilities. Signed on 2003-03-11. Completion date: 2004-03-11.
$190,288, same as above.Signed on 2002-03-11. Completion date: 2002-03-11.
PAIGE SITTA & ASSOCIATES INC (3113 MARKET ST STE B; small business) : $2,038,904 in 37 contractsfrom 1999 to 2006
Contracts for Floor Coverings, Non-nuclear Ship Repair (West) Ship repair (including overhauls and conversions) performed on. non-nuclear propelled and nonpropelled ships west of the 108th meridian, Maintenance, Repair and Rebuilding of Equipment -- Brushes, Paints, Sealers, and Adhesives, Maintenance, Repair or Alteration of Real Property -- Other Non-Building Facilities, and moreby Navy Signed by year:2000: $306,917; 2001: $0; 2002: $5,100; 2003: $49,915; 2004: $693,619; 2005: $211,726; 2006: $22,098.
Biggest contracts:
$458,458 with Navy for Floor Coverings. Taking place in VA. Signed on 2004-09-30. Completion date: 2005-03-30.
$270,444 with Navy for Non-nuclear Ship Repair (West) Ship repair (including overhauls and conversions) performed on. non-nuclear propelled and nonpropelled ships west of the 108th meridian. Signed on 1999-11-23. Completion date: 1999-12-05.
$242,020 with Navy for Maintenance, Repair and Rebuilding of Equipment -- Brushes, Paints, Sealers, and Adhesives. Taking place in WA. Signed on 1999-12-27. Completion date: 2000-04-30.
$156,000 with Navy for Floor Coverings. Taking place in VA. Signed on 2005-09-28. Completion date: 2005-03-30.
WESTAIR GASES AND EQUIPMENT IN (2506 MARKET ST; small business) : $931,130 in 147 contractsfrom 2000 to 2006
Contracts for Chemicals, Gases: Compressed and Liquefied, Miscellaneous Service and Trade Equipment, Miscellaneous Welding Equipment, and moreby Navy, Drug Enforcement Administration, Army, Department of Veterans Affairs, and others Signed by year:2000: $52,400; 2001: $0; 2002: $167,104; 2003: $344,321; 2004: $80,902; 2005: $262,820; 2006: $23,583.
Biggest contracts:
$247,337 with Navy for Chemicals. Signed on 2003-08-21. Completion date: 2004-09-30.
$159,505 with Navy for Gases: Compressed and Liquefied. Signed on 2002-09-25. Completion date: 2003-09-30.
$27,150, same as above.Signed on 2000-03-24. Completion date: 2000-04-07.
$25,250, same as above.Signed on 2000-09-12. Completion date: 2000-09-12.
BEAR COMMUNICATIONS (4506 FEDERAL BLVD STE A) : $193,953 in 5 contractsfrom 1999 to 2004
Contracts for Antennas, Waveguides, and Related Equipment, Surveillance Services, Headsets, Handsets, Microphones and Speakers, Radio and Television Communication Equipment, Airborne, and moreby Navy, Air Force Signed by year:2000: $156,929; 2001: $0; 2002: $0; 2003: $0; 2004: $6,809; 2005: $0; 2006: $0.
Biggest contracts:
$97,475 with Navy for Antennas, Waveguides, and Related Equipment. Signed on 2000-04-19. Completion date: 2000-05-22.
$30,215 with Navy for Surveillance Services. Signed on 1999-10-01. Completion date: 2000-09-30.
$29,850 with Air Force for Headsets, Handsets, Microphones and Speakers. Signed on 2000-02-23. Completion date: 2000-03-31.
$29,604 with Navy for Radio and Television Communication Equipment, Airborne. Signed on 2000-08-24. Completion date: 2000-09-08.
LOMAC FAMILY ENTERPRISES INC (35 HENSLEY ST; small business) : $169,590 in 5 contractsfrom 2001 to 2005
Contracts for Maintenance, Repair and Rebuilding of Equipment -- Miscellaneous, Maintenance, Repair or Alteration of Real Property -- Miscellaneous Buildings by Navy Signed by year:2000: $0; 2001: $93,872; 2002: $0; 2003: $41,296; 2004: $0; 2005: $34,422; 2006: $0.
Biggest contracts:
$68,576 with Navy for Maintenance, Repair and Rebuilding of Equipment -- Miscellaneous. Signed on 2001-10-01. Completion date: 2001-09-30.
$41,296, same as above.Signed on 2003-01-31. Completion date: 2004-09-30.
$28,982 with Navy for Maintenance, Repair or Alteration of Real Property -- Miscellaneous Buildings. Signed on 2005-12-07. Completion date: 2004-09-30.
$25,296 with Navy for Maintenance, Repair and Rebuilding of Equipment -- Miscellaneous. Signed on 2001-05-01. Completion date: 2001-09-30.
JATO INDUSTRIES INC (3407 E ST; small business) : $135,867 in 13 contractsfrom 2002 to 2005
Contracts for Miscellaneous Maintenance and Repair Shop Specialized Equipment, Gas Generating and Dispensing Systems, Fixed or Mobile, Industrial Boilers, Floor Polishers and Vacuum Cleaning Equipment, and moreby Navy Signed by year:2000: $0; 2001: $0; 2002: $45,157; 2003: $63,564; 2004: $23,510; 2005: $3,636; 2006: $0.
Biggest contracts:
$33,000 with Navy for Miscellaneous Maintenance and Repair Shop Specialized Equipment. Signed on 2003-09-23. Completion date: 2003-10-31.
$30,990, same as above.Signed on 2002-04-22. Completion date: 2002-05-17.
$16,500 with Navy for Gas Generating and Dispensing Systems, Fixed or Mobile. Signed on 2003-09-17. Completion date: 2003-10-31.
$12,869 with Navy for Industrial Boilers. Signed on 2004-08-27. Completion date: 2004-09-17.
WILLIAMS SPECIALTY SERVICES (4506 FEDERAL BLVD STE C; small business) 1000 employees, $0 revenue. Small Disadvantaged Business, Black American Owned Business: $134,919 in 3 contractsfrom 2000 to 2002
$80,000 with Navy for Maintenance, Repair and Rebuilding of Equipment -- Valves. Signed on 2000-01-11. Completion date: 2000-02-25.
$29,405 with Navy for Non-nuclear Ship Repair (West) Ship repair (including overhauls and conversions) performed on. non-nuclear propelled and nonpropelled ships west of the 108th meridian. Signed on 2002-01-22. Completion date: 2002-01-30.
$25,514, same as above.Signed on 2001-09-06. Completion date: 2001-09-12.
Top industries in this zip code by the number of employees in 2005:
Wholesale Trade: Other Grocery and Related Products Merchant Wholesalers (over 1000 employees: 1 establishment)
Health Care and Social Assistance: Services for the Elderly and Persons with Disabilities (500-999: 1, 20-49: 1, 10-19: 1, 1-4: 4)
2005 - 2018 National Fire Incident Reporting System (NFIRS) incidents
Based on the data from the years 2005 - 2018 the average number of fire incidents per year is 70. The highest number of fire incidents - 129 took place in 2010, and the least - 0 in 2006. The data has a rising trend.
When looking into fire subcategories, the most reports belonged to: Outside Fires (43.0%), and Structure Fires (31.2%).
Fire incident types reported to NFIRS in Zip Code 92102


 Nearest zip codes: 92113, 92104, 92134, 92105, 92116, 91950.


 Based on the data from the years 2005 - 2018 the average number of fire incidents per year is 70. The highest number of fire incidents - 129 took place in 2010, and the least - 0 in 2006. The data has a rising trend.
 When looking into fire subcategories, the most reports belonged to: Outside Fires (43.0%), and Structure Fires (31.2%).