Estimated zip code population in 2022: 46,225 Zip code population in 2010: 44,414 Zip code population in 2000: 47,688
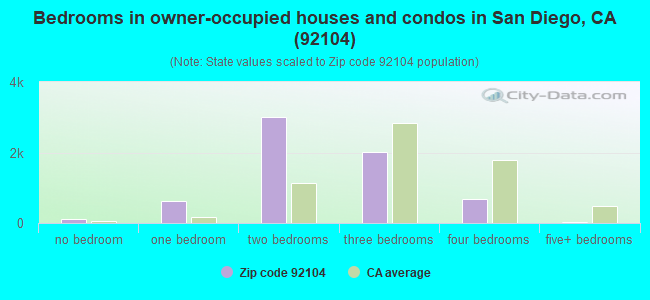
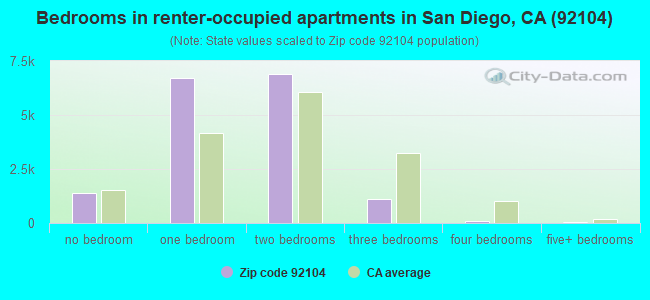
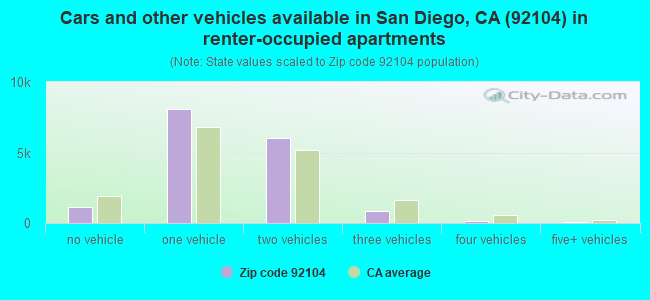
Houses and condos: 24,145 Renter-occupied apartments: 16,297
% of renters here:
71%
State:
44%
March 2022 cost of living index in zip code 92104: 124.3 (high, U.S. average is 100)
Land area: 3.8 sq. mi. Water area: 0.0 sq. mi.
Population density: 12,213 people per square mile
(very high).
OSM Map
General Map
Google Map
MSN Map
OSM Map
General Map
Google Map
MSN Map
OSM Map
General Map
Google Map
MSN Map
OSM Map
General Map
Google Map
MSN Map
Please wait while loading the map...
Real estate property taxes paid for housing units in 2022:
This zip code:
0.5% ($4,403)
California:
0.7% ($4,831)
Median real estate property taxes paid for housing units with mortgages in 2022: $5,279 (0.6%) Median real estate property taxes paid for housing units with no mortgage in 2022: $2,605 (0.4%)
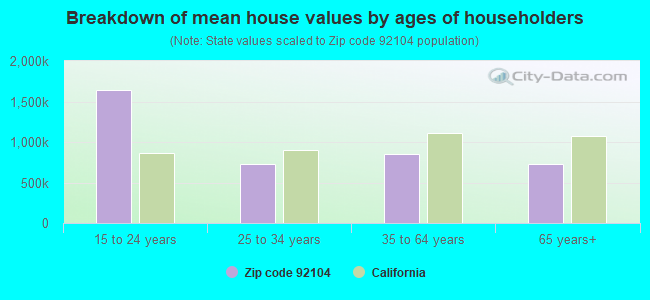
Estimated median house/condo value in 2022: $842,727
92104:
$842,727
California:
$715,900
According to our research of California and other state lists, there were 47 registered sex offenders living in 92104 zip code as of April 27, 2024. The ratio of all residents to sex offenders in zip code 92104 is 988 to 1. The ratio of registered sex offenders to all residents in this zip code is lower than the state average.
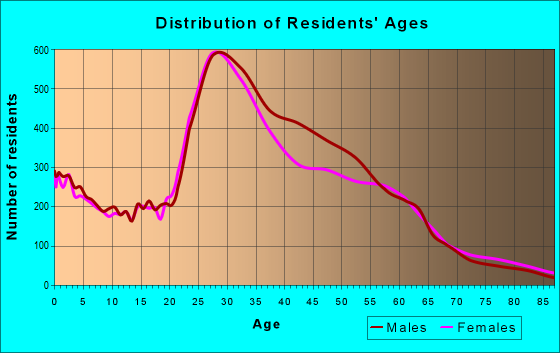
Median resident age:
This zip code:
35.2 years
California median age:
37.9 years
Average household size:
This zip code:
2.0 people
California:
2.8 people
Averages for the 2020 tax year for zip code 92104, filed in 2021:
Average Adjusted Gross Income (AGI) in 2020: $72,183 (Individual Income Tax Returns)
Here:
$72,183
State:
$95,910
Salary/wage: $65,508 (reported on 86.1% of returns)
Here:
$65,508
State:
$77,331
(% of AGI for various income ranges: 1189.0% for AGIs below $25k, 4005.2% for AGIs $25k-50k, 7250.7% for AGIs $50k-75k, 11055.6% for AGIs $75k-100k, 20171.4% for AGIs $100k-200k, 85502.7% for AGIs over 200k)
Taxable interest for individuals: $922 (reported on 29.1% of returns)
This zip code:
$922
California:
$2,294
(% of AGI for various income ranges: 9.4% for AGIs below $25k, 7.9% for AGIs $25k-50k, 15.2% for AGIs $50k-75k, 32.6% for AGIs $75k-100k, 117.3% for AGIs $100k-200k, 648.8% for AGIs over 200k)
Ordinary dividends: $3,707 (reported on 20.3% of returns)
Here:
$3,707
State:
$10,949
(% of AGI for various income ranges: 23.7% for AGIs below $25k, 27.6% for AGIs $25k-50k, 49.7% for AGIs $50k-75k, 95.9% for AGIs $75k-100k, 255.5% for AGIs $100k-200k, 2051.5% for AGIs over 200k)
Net capital gain/loss in AGI: +$16,108 (reported on 19.5% of returns)
Here:
+$16,108
State:
+$49,306
(% of AGI for various income ranges: 11.0% for AGIs below $25k, 27.3% for AGIs $25k-50k, 49.0% for AGIs $50k-75k, 138.2% for AGIs $75k-100k, 522.8% for AGIs $100k-200k, 15764.9% for AGIs over 200k)
Profit/loss from business: +$12,376 (reported on 17.9% of returns)
Here:
+$12,376
State:
+$15,671
(% of AGI for various income ranges: 164.1% for AGIs below $25k, 176.8% for AGIs $25k-50k, 213.5% for AGIs $50k-75k, 233.2% for AGIs $75k-100k, 580.5% for AGIs $100k-200k, 4336.1% for AGIs over 200k)
Taxable individual retirement arrangement distribution: $17,161 (reported on 4.4% of returns)
92104:
$17,161
California:
$23,505
(% of AGI for various income ranges: 30.4% for AGIs below $25k, 42.3% for AGIs $25k-50k, 74.5% for AGIs $50k-75k, 138.3% for AGIs $75k-100k, 359.0% for AGIs $100k-200k, 914.1% for AGIs over 200k)
Self-employed (Keogh) retirement plans: $22,495 (reported on 0.9% of returns)
92104:
$22,495
California:
$30,163
(% of AGI for various income ranges: 4.3% for AGIs $25k-50k, 12.4% for AGIs $50k-75k, 39.3% for AGIs $100k-200k, 860.7% for AGIs over 200k)
Total itemized deductions: $30,247 (reported on 11.3% of returns)
Here:
$30,247
State:
$39,517
(% of AGI for various income ranges: 58.0% for AGIs below $25k, 104.8% for AGIs $25k-50k, 236.3% for AGIs $50k-75k, 539.1% for AGIs $75k-100k, 1463.3% for AGIs $100k-200k, 8064.6% for AGIs over 200k)
Charity contributions: $5,111 (reported on 8.9% of returns)
Here:
$5,111
State:
$12,598
(% of AGI for various income ranges: 3.0% for AGIs below $25k, 10.6% for AGIs $25k-50k, 24.7% for AGIs $50k-75k, 40.1% for AGIs $75k-100k, 166.4% for AGIs $100k-200k, 1492.0% for AGIs over 200k)
Taxes paid: $8,600 (reported on 11.3% of returns)
92104:
$8,600
State:
$8,807
(% of AGI for various income ranges: 12.3% for AGIs below $25k, 22.9% for AGIs $25k-50k, 70.5% for AGIs $50k-75k, 193.3% for AGIs $75k-100k, 505.3% for AGIs $100k-200k, 1788.8% for AGIs over 200k)
Earned income credit: $1,543 (reported on 10.7% of returns)
Here:
$1,543
State:
$2,074
(% of AGI for various income ranges: 60.5% for AGIs below $25k, 30.5% for AGIs $25k-50k, 0.4% for AGIs $50k-75k)
Percentage of individuals using paid preparers for their 2020 taxes: 94.6%
Here:
95%
State:
92%
(% for various income ranges: 91.9% for AGIs below $25k, 94.6% for AGIs $25k-50k, 95.5% for AGIs $50k-75k, 95.9% for AGIs $75k-100k, 95.8% for AGIs $100k-200k, 97.8% for AGIs over 200k)
Averages for the 2012 tax year for zip code 92104, filed in 2013:
Average Adjusted Gross Income (AGI) in 2012: $48,198 (Individual Income Tax Returns)
Here:
$48,198
State:
$72,726
Salary/wage: $45,815 (reported on 87.6% of returns)
Here:
$45,815
State:
$59,079
(% of AGI for various income ranges: 77.9% for AGIs below $25k, 88.7% for AGIs $25k-50k, 87.6% for AGIs $50k-75k, 85.7% for AGIs $75k-100k, 82.8% for AGIs $100k-200k, 69.5% for AGIs over 200k)
Taxable interest for individuals: $585 (reported on 27.0% of returns)
This zip code:
$585
California:
$2,146
(% of AGI for various income ranges: 0.5% for AGIs below $25k, 0.3% for AGIs $25k-50k, 0.3% for AGIs $50k-75k, 0.3% for AGIs $75k-100k, 0.4% for AGIs $100k-200k, 0.4% for AGIs over 200k)
Ordinary dividends: $2,912 (reported on 14.7% of returns)
Here:
$2,912
State:
$9,308
(% of AGI for various income ranges: 1.1% for AGIs below $25k, 0.5% for AGIs $25k-50k, 0.7% for AGIs $50k-75k, 0.8% for AGIs $75k-100k, 1.2% for AGIs $100k-200k, 1.5% for AGIs over 200k)
Net capital gain/loss in AGI: +$5,528 (reported on 12.1% of returns)
Here:
+$5,528
State:
+$30,460
(% of AGI for various income ranges: 0.2% for AGIs $25k-50k, 0.4% for AGIs $50k-75k, 0.5% for AGIs $75k-100k, 1.4% for AGIs $100k-200k, 7.0% for AGIs over 200k)
Profit/loss from business: +$12,845 (reported on 16.5% of returns)
Here:
+$12,845
State:
+$17,064
(% of AGI for various income ranges: 10.8% for AGIs below $25k, 3.5% for AGIs $25k-50k, 2.9% for AGIs $50k-75k, 3.2% for AGIs $75k-100k, 3.9% for AGIs $100k-200k, 5.1% for AGIs over 200k)
Taxable individual retirement arrangement distribution: $11,800 (reported on 4.4% of returns)
92104:
$11,800
California:
$19,557
(% of AGI for various income ranges: 1.1% for AGIs below $25k, 0.8% for AGIs $25k-50k, 1.1% for AGIs $50k-75k, 1.1% for AGIs $75k-100k, 1.1% for AGIs $100k-200k, 1.5% for AGIs over 200k)
Self-employment retirement plans: $15,447 (reported on 0.7% of returns)
92104:
$15,447
California:
$24,530
(% of AGI for various income ranges: 0.1% for AGIs $25k-50k, 0.2% for AGIs $75k-100k, 0.4% for AGIs $100k-200k, 0.7% for AGIs over 200k)
Total itemized deductions: $21,793 (23% of AGI, reported on 25.6% of returns)
Here:
$21,793
State:
$34,004
Here:
22.5% of AGI
State:
22.7% of AGI
(% of AGI for various income ranges: 6.0% for AGIs below $25k, 6.2% for AGIs $25k-50k, 10.7% for AGIs $50k-75k, 14.2% for AGIs $75k-100k, 17.1% for AGIs $100k-200k, 15.2% for AGIs over 200k)
Charity contributions: $2,122 (reported on 20.1% of returns)
Here:
$2,122
State:
$4,659
(% of AGI for various income ranges: 0.3% for AGIs below $25k, 0.5% for AGIs $25k-50k, 0.8% for AGIs $50k-75k, 1.2% for AGIs $75k-100k, 1.3% for AGIs $100k-200k, 1.2% for AGIs over 200k)
Taxes paid: $8,278 (reported on 25.5% of returns)
92104:
$8,278
State:
$14,448
(% of AGI for various income ranges: 1.0% for AGIs below $25k, 1.3% for AGIs $25k-50k, 3.2% for AGIs $50k-75k, 5.5% for AGIs $75k-100k, 7.4% for AGIs $100k-200k, 8.3% for AGIs over 200k)
Earned income credit: $1,731 (reported on 16.3% of returns)
Here:
$1,731
State:
$2,286
(% of AGI for various income ranges: 4.4% for AGIs below $25k, 0.6% for AGIs $25k-50k)
Percentage of individuals using paid preparers for their 2012 taxes: 50.2%
Here:
50%
State:
64%
(% for various income ranges: 51.2% for AGIs below $25k, 45.6% for AGIs $25k-50k, 49.0% for AGIs $50k-75k, 51.4% for AGIs $75k-100k, 58.6% for AGIs $100k-200k, 73.3% for AGIs over 200k)
Averages for the 2004 tax year for zip code 92104, filed in 2005:
Average Adjusted Gross Income (AGI) in 2004: $36,335 (Individual Income Tax Returns)
Here:
$36,335
State:
$58,600
Salary/wage: $34,617 (reported on 88.7% of returns)
Here:
$34,617
State:
$49,455
(% of AGI for various income ranges: 130.5% for AGIs below $10k, 85.4% for AGIs $10k-25k, 90.8% for AGIs $25k-50k, 87.6% for AGIs $50k-75k, 85.7% for AGIs $75k-100k, 67.5% for AGIs over 100k)
Taxable interest for individuals: $912 (reported on 32.9% of returns)
This zip code:
$912
California:
$2,365
(% of AGI for various income ranges: 3.8% for AGIs below $10k, 0.9% for AGIs $10k-25k, 0.6% for AGIs $25k-50k, 0.8% for AGIs $50k-75k, 1.1% for AGIs $75k-100k, 0.8% for AGIs over 100k)
Taxable dividends: $1,895 (reported on 15.2% of returns)
Here:
$1,895
State:
$4,746
(% of AGI for various income ranges: 3.6% for AGIs below $10k, 0.7% for AGIs $10k-25k, 0.5% for AGIs $25k-50k, 0.5% for AGIs $50k-75k, 0.9% for AGIs $75k-100k, 1.2% for AGIs over 100k)
Net capital gain/loss: +$9,841 (reported on 12.4% of returns)
Here:
+$9,841
State:
+$23,418
(% of AGI for various income ranges: -1.9% for AGIs below $10k, 0.1% for AGIs $10k-25k, 0.3% for AGIs $25k-50k, 0.7% for AGIs $50k-75k, 1.6% for AGIs $75k-100k, 13.9% for AGIs over 100k)
Profit/loss from business: +$11,457 (reported on 14.1% of returns)
Here:
+$11,457
State:
+$16,826
(% of AGI for various income ranges: 12.9% for AGIs below $10k, 6.2% for AGIs $10k-25k, 3.1% for AGIs $25k-50k, 3.6% for AGIs $50k-75k, 3.5% for AGIs $75k-100k, 6.0% for AGIs over 100k)
IRA payment deduction: $2,440 (reported on 2.3% of returns)
92104:
$2,440
California:
$3,192
(% of AGI for various income ranges: 0.4% for AGIs below $10k, 0.2% for AGIs $10k-25k, 0.2% for AGIs $25k-50k, 0.1% for AGIs $50k-75k, 0.1% for AGIs $75k-100k, 0.1% for AGIs over 100k)
Self-employed pension: $11,495 (reported on 0.9% of returns)
Here:
$11,495
California:
$17,688
(% of AGI for various income ranges: 0.1% for AGIs $10k-25k, 0.1% for AGIs $25k-50k, 0.2% for AGIs $50k-75k, 0.3% for AGIs $75k-100k, 0.8% for AGIs over 100k)
Total itemized deductions: $19,439 (27% of AGI, reported on 25.0% of returns)
Here:
$19,439
State:
$28,113
Here:
27.2% of AGI
State:
25.3% of AGI
(% of AGI for various income ranges: 12.6% for AGIs below $10k, 5.5% for AGIs $10k-25k, 9.4% for AGIs $25k-50k, 16.6% for AGIs $50k-75k, 20.0% for AGIs $75k-100k, 18.3% for AGIs over 100k)
Charity contributions deductions: $1,855 (3% of AGI, reported on 21.3% of returns)
Here:
$1,855
State:
$3,923
Here:
2.5% of AGI
State:
3.3% of AGI
(% of AGI for various income ranges: 0.6% for AGIs below $10k, 0.5% for AGIs $10k-25k, 0.8% for AGIs $25k-50k, 1.4% for AGIs $50k-75k, 1.5% for AGIs $75k-100k, 1.4% for AGIs over 100k)
Total tax: $4,916 (reported on 77.6% of returns)
92104:
$4,916
State:
$10,761
(% of AGI for various income ranges: 4.6% for AGIs below $10k, 4.8% for AGIs $10k-25k, 8.1% for AGIs $25k-50k, 11.2% for AGIs $50k-75k, 12.4% for AGIs $75k-100k, 16.7% for AGIs over 100k)
Earned income credit: $1,453 (reported on 17.2% of returns)
Here:
$1,453
State:
$1,763
Percentage of individuals using paid preparers for their 2004 taxes: 56.0%
Here:
56%
State:
66%
(% for various income ranges: 53.7% for AGIs below $10k, 58.3% for AGIs $10k-25k, 52.4% for AGIs $25k-50k, 57.1% for AGIs $50k-75k, 59.8% for AGIs $75k-100k, 68.2% for AGIs over 100k)
Likely homosexual households (counted as self-reported same-sex unmarried-partner households)
Lesbian couples: 0.8% of all households
Gay men: 1.7% of all households
Household received Food Stamps/SNAP in the past 12 months: 1,891 Household did not receive Food Stamps/SNAP in the past 12 months: 20,740
Women who had a birth in the past 12 months: 550 (421 now married, 128 unmarried) Women who did not have a birth in the past 12 months: 13,894 (4,211 now married, 9,736 unmarried)
Housing units in zip code 92104 with a mortgage: 4,816 (412 second mortgage, 344 both second mortgage and home equity loan) Houses without a mortgage: 46
Median monthly owner costs for units with a mortgage: $2,759 Median monthly owner costs for units without a mortgage: $574
Residents with income below the poverty level in 2022:
This zip code:
9.8%
Whole state:
12.2%
Residents with income below 50% of the poverty level in 2022:
This zip code:
5.3%
Whole state:
6.2%
Median number of rooms in houses and condos:
Here:
5.1
State:
6.0
Median number of rooms in apartments:
Here:
3.5
State:
3.9
Notable locations in this zip code not listed on our city pages
Notable locations in zip code 92104: North Park Branch San Diego Public Library (A), San Diego Fire - Rescue Department Station 14 (B), North Park Advent Community Church Youth Zone (C), Emmanuel Christian Fellowship Center (D). Display/hide their locations on the map
Churches in zip code 92104 include: The Church of Jesus Christ of Latter Day Saints (A), Covenant Presbyterian Church (B), Korean Seventh Day Adventist Church (C), Metropolitan Community Church (D), Our Saviors Evangelical Church (E), Christ United Methodist Church (F), Iglesia Cristiana del Alfarero (G), Plymouth Congregational Church (H), Saint Luke Episcopal Church (I). Display/hide their locations on the map
Parks in zip code 92104 include: Wabash Park (1), North Park (2), North Park Recreation Center (3), Morley Field Sports Complex (4). Display/hide their locations on the map
Tourist attraction (not listed on the city page) : A H Amusements (Amusement & Theme Parks; 3413 30th Street).
3,645 married couples with children.
2,289 single-parent households (621 men, 1,668 women).
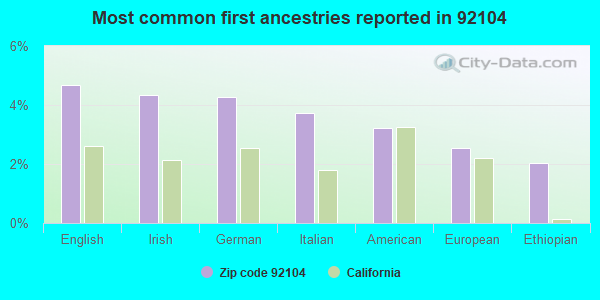
68.1% of residents of 92104 zip code speak English at home.
23.2% of residents speak Spanish at home (69% very well, 18% well, 12% not well, 1% not at all).
2.1% of residents speak other Indo-European language at home (80% very well, 13% well, 7% not well).
3.0% of residents speak Asian or Pacific Island language at home (45% very well, 24% well, 29% not well, 3% not at all).
2.7% of residents speak other language at home (62% very well, 31% well, 2% not well, 4% not at all).
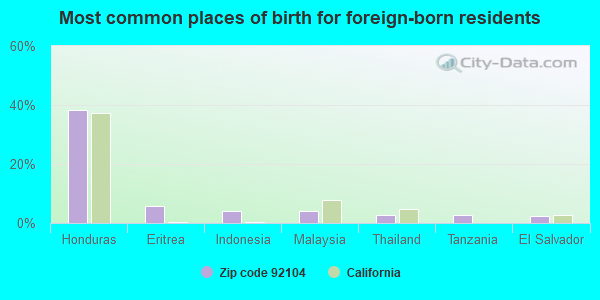
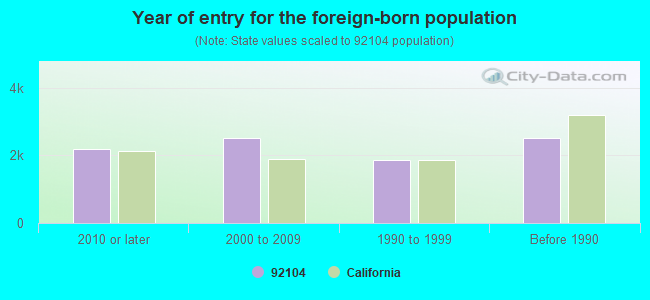
Foreign born population: 8,242 (17.8%) (52.1% of them are naturalized citizens)
Major facilities with environmental interests located in this zip code:
ARCO #5139 (3296 EL CAJON BL in SAN DIEGO, CA)
STATE MASTER (California - Hazardous Waste Tracking) - HAZARDOU WASTE PROGRAM CRITERIA AND HAZARDOUS AIR POLLUTANT INVENTORY (Inventory of air pollution sources) Small Quantity Generators, between 100 kg and 1000 kg of hazardous waste/month (Resource Conservation and Recovery Act (tracking hazardous waste)) - notification Business SIC classification: GASOLINE SERVICE STATIONS Organizations: B P WEST COAST PRODUCTS LLC (CONTACT/OWNER)
Alternative names: ARCO FACILITY NO 06083, BP WEST COAST PRODUCTS LLC 06083, PRESTIGE STATIONS INC NO 5139
ARCO #703 (3205 UNIVERSITY AVENUE in SAN DIEGO, CA)
STATE MASTER (California - Hazardous Waste Tracking) - HAZARDOU WASTE PROGRAM CRITERIA AND HAZARDOUS AIR POLLUTANT INVENTORY (Inventory of air pollution sources) Small Quantity Generators, between 100 kg and 1000 kg of hazardous waste/month (Resource Conservation and Recovery Act (tracking hazardous waste)) - notification Business SIC classification: GASOLINE SERVICE STATIONS Organizations: B P WEST COAST PRODUCTS L L C (CONTACT/OWNER)
Alternative names: ARCO FACILITY NO 03060, BP WEST COAST PRODUCTS LLC 03060, PRESTIGE STATIONS INC NO 0703
MATHEWS CLEANERS (3935 OHIO ST in SAN DIEGO, CA)
STATE MASTER (California - Hazardous Waste Tracking) - HAZARDOU WASTE PROGRAM CRITERIA AND HAZARDOUS AIR POLLUTANT INVENTORY (Inventory of air pollution sources) Small Quantity Generators, between 100 kg and 1000 kg of hazardous waste/month (Resource Conservation and Recovery Act (tracking hazardous waste)) Business SIC classification: DRYCLEANING PLANTS, EXCEPT RUG CLEANING
ACE 1 HR PHOTO (3032 UNIVERSITY AVE in SAN DIEGO, CA)
STATE MASTER (California - Hazardous Waste Tracking) - HAZARDOU WASTE PROGRAM Small Quantity Generators, between 100 kg and 1000 kg of hazardous waste/month (Resource Conservation and Recovery Act (tracking hazardous waste)) - notification Organizations: JOHN NGUYEN (CONTACT/OWNER)
38TH AND QUINCE STREET (38TH AND QUINCE STREET in SAN DIEGO, CA)
SUPERFUND (Superfund database) (Integrated Compliance Information System) - ICIS-09-2002-0071, FORMAL ENFORCEMENT ACTION, ICIS-09-2005-0023, Business SIC classification: REFUSE SYSTEMS Alternative names: QUINCE STREET BURN ASH
EDISON ELEMENTARY (4077 35TH ST. in SAN DIEGO, CA)
(National Center for Education Statistics) - STATE ID-6039499 Organizations: SAN DIEGO UNIFIED (SCHOOL DISTRICT)
JEFFERSON ELEMENTARY (3770 UTAH ST. in SAN DIEGO, CA)
(National Center for Education Statistics) - STATE ID-6039770 Organizations: SAN DIEGO UNIFIED (SCHOOL DISTRICT)
MCKINLEY ELEMENTARY (3045 FELTON ST. in SAN DIEGO, CA)
(National Center for Education Statistics) - STATE ID-6039978 Organizations: SAN DIEGO UNIFIED (SCHOOL DISTRICT)
ALL PRO PAINT (4018 35TH STREET in SAN DIEGO, CA)
CRITERIA AND HAZARDOUS AIR POLLUTANT INVENTORY (Inventory of air pollution sources) (Resource Conservation and Recovery Act (tracking hazardous waste)) Business SIC classification: TOP, BODY, AND UPHOLSTERY REPAIR SHOPS AND PAINT SHOPS Business NAICS classification: AUTOMOTIVE BODY, PAINT, AND INTERIOR REPAIR AND MAINTENANCE. Organizations: G DAVID BURNER (CONTACT/OWNER)
Alternative names: DAVE BURNER AUTO BODY & PAINT
HILLSIDE HOSPITAL (1940 EL CAJON BOULEVARD in SAN DIEGO, CA)
(Resource Conservation and Recovery Act (tracking hazardous waste)) Organizations: SAN MIGUEL HOSPITAL ASSN (CONTACT/OWNER)
A & B AUTO REPAIR (3502 UNIVERSITY AVE in SAN DIEGO, CA)
Small Quantity Generators, between 100 kg and 1000 kg of hazardous waste/month (Resource Conservation and Recovery Act (tracking hazardous waste)) - notification Business NAICS classification: GENERAL AUTOMOTIVE REPAIR. Organizations: BUU Q LU (CONTACT/OWNER)
JOES RADIATOR (4234 MISSISSIPPI in SAN DIEGO, CA)
Small Quantity Generators, between 100 kg and 1000 kg of hazardous waste/month (Resource Conservation and Recovery Act (tracking hazardous waste)) - notification Organizations: MILDRED JOHNSON (CONTACT/OWNER)
KIMJ ROAD RUNNER (2502 UNIVERSITY AVE in SAN DIEGO, CA)
Small Quantity Generators, between 100 kg and 1000 kg of hazardous waste/month (Resource Conservation and Recovery Act (tracking hazardous waste)) Organizations: BUL & VYET LE (CONTACT/OWNER)
Housing units lacking complete plumbing facilities: 0.7% Housing units lacking complete kitchen facilities: 1.5%
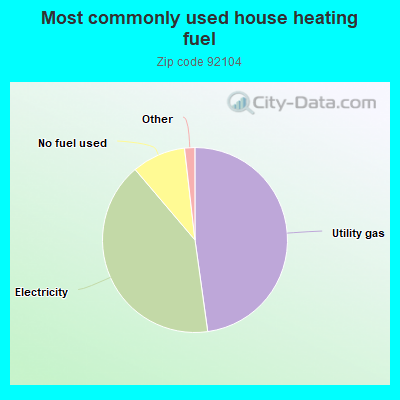
47.8%Utility gas
41.0%Electricity
9.4%No fuel used
0.7%Bottled, tank, or LP gas
0.7%Solar energy
Population in 1990: 44,032. Population change in the 1990s: +3,656 (+8.3%).
Place of birth for U.S.-born residents:
This state: 22,654
Northeast: 3,665
Midwest: 3,925
South: 3,937
West: 2,707
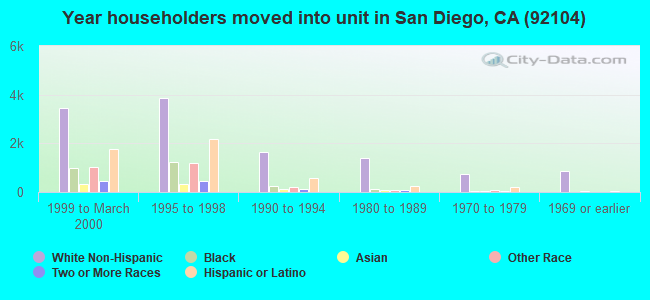
37% of the 92104 zip code residents lived in the same house 5 years ago. Out of people who lived in different houses, 74% lived in this county. Out of people who lived in different counties, 50% lived in California.
84% of the 92104 zip code residents lived in the same house 1 year ago. Out of people who lived in different houses, 61% moved from this county. Out of people who lived in different houses, 14% moved from different county within same state. Out of people who lived in different houses, 20% moved from different state. Out of people who lived in different houses, 3% moved from abroad.
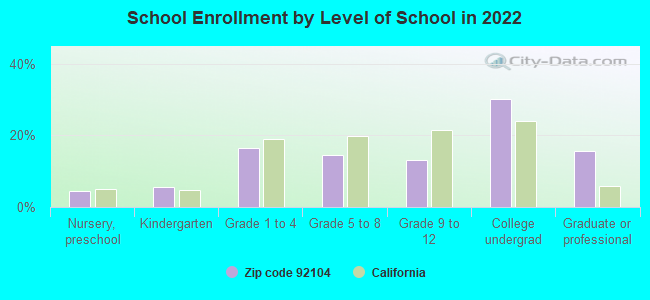
Private vs. public school enrollment:
Students in private schools in grades 1 to 8 (elementary and middle school): 262
Here:
9.7%
California:
10.5%
Students in private schools in grades 9 to 12 (high school): 99
Here:
8.7%
California:
8.5%
Students in private undergraduate colleges: 503
Here:
19.2%
California:
15.9%
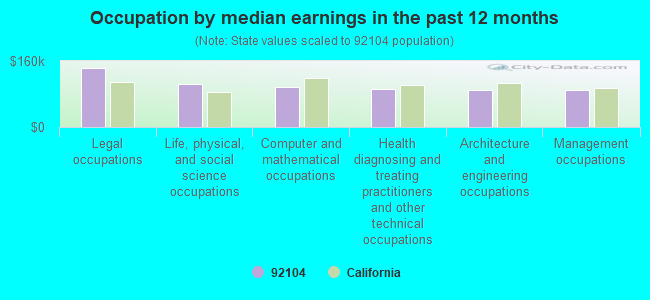
Occupation by median earnings in the past 12 months ($)
142,653Legal occupations
104,371Life, physical, and social science occupations
96,136Computer and mathematical occupations
91,833Health diagnosing and treating practitioners and other technical occupations
90,875Architecture and engineering occupations
88,600Management occupations
Companies with federal contracts located in this zip code (SAN DIEGO, CA):
NEW LIFE CHINESE LAUNDRY INC (3829 GRANADA AVE; small business) : $87,681 in 17 contractsfrom 2002 to 2006
Contracts for Laundry and DryCleaning Services, Laundry and Dry Cleaning Equipment by Navy Signed by year:2000: $0; 2001: $0; 2002: $4,000; 2003: $6,500; 2004: $23,773; 2005: $46,372; 2006: $7,036.
Biggest contracts:
$19,942 with Navy for Laundry and DryCleaning Services. Signed on 2005-09-15. Completion date: 2005-09-30.
$11,088, same as above.Signed on 2005-01-14. Completion date: 2005-09-30.
$8,225 with Navy for Laundry and Dry Cleaning Equipment. Signed on 2004-03-03. Completion date: 2004-03-06.
$8,116 with Navy for Laundry and DryCleaning Services. Signed on 2005-09-08. Completion date: 2006-09-30.
CENTRAL SEWING CENTRE (3919 ILLINOIS STREET; small business) : $34,570 in 6 contractsfrom 2002 to 2005
Contracts for Miscellaneous Maintenance and Repair Shop Specialized Equipment, Torque Converters and Speed Changers, Industrial Sewing Machines and Mobile Textile Repair Shops, Miscellaneous Special Industry Machinery, and moreby Navy Signed by year:2000: $0; 2001: $0; 2002: $5,790; 2003: $0; 2004: $12,290; 2005: $16,490; 2006: $0.
Biggest contracts:
$12,995 with Navy for Miscellaneous Maintenance and Repair Shop Specialized Equipment. Signed on 2005-11-23. Completion date: 2005-12-14.
$5,790 with Navy for Torque Converters and Speed Changers. Signed on 2002-12-02. Completion date: 2002-12-10.
$5,500 with Navy for Industrial Sewing Machines and Mobile Textile Repair Shops. Signed on 2004-08-04. Completion date: 2004-08-06.
$3,895 with Navy for Miscellaneous Special Industry Machinery. Signed on 2004-10-26. Completion date: 2004-10-26.
SAN DIEGO STAGE & LIGHTING SUP (2030 EL CAJON BLVD; small business)
$34,145 with Navy for Textile Fabrics. Signed on 2004-07-19. Completion date: 2004-08-12.
GIFFORD ENGINEERING INC (3930 IDAHO ST; small business) : $19,974 in 4 contractsfrom 2003 to 2004
$6,932 with Navy for Radio and Television Communication Equipment, Except Airborne. Signed on 2003-04-30. Completion date: 2003-05-13.
$6,109 with Army for Radio and Television Communication Equipment, Except Airborne. Signed on 2003-09-17. Completion date: 2003-03-08.
$3,612 with Navy for Telephone and Telegraph Equipment. Signed on 2004-09-22. Completion date: 2004-09-24.
$3,321 with Navy for Radio and Television Communication Equipment, Except Airborne. Signed on 2003-06-12. Completion date: 2003-06-27.
JAMES W EWING (3501 UTAH ST) : $15,600 in 3 contractsfrom 2003 to 2005
$7,800 with Navy for Lectures For Training. Signed on 2003-10-01. Completion date: 2003-10-01.
$7,800 with Navy for Lectures For Training. Taking place in MA. Signed on 2005-10-11. Completion date: 2006-09-30.
$0, same as above.Signed on 2005-10-11. Completion date: 2006-09-30.
HOFFMAN TACTICAL INNOVATIONS (3288 EL CAJON BLVD #1; small business) : $13,396 in 3 contractsfrom 2002 to 2003
$13,962 with Army for Individual Equipment. Signed on 2002-06-25. Completion date: 2002-07-30.
$384, same as above.Signed on 2002-12-11. Completion date: 2002-07-30.
-$950, same as above.Signed on 2003-01-14. Completion date: 2002-07-30.
ELLEN COLANGELO, PH D (3501 UTAH STREET; small business) : $7,900 in 3 contractsfrom 2003 to 2004
$6,200 with Navy for Other Professional Services. Signed on 2003-10-01. Completion date: 2004-09-30.
$4,100, same as above.Signed on 2004-11-30. Completion date: 2004-12-02.
-$2,400, same as above.Signed on 2004-09-21. Completion date: 2004-09-30.
CENTRAL SEWING CENTRE (3919 ILLINOIS ST; small business)
$5,000 with U.S. Special Operations Command for Educational Services. Signed on 2006-05-19. Completion date: 2006-09-30.
MACIAS, ANA (2814 UNIVERSITY AVE; small business)
$3,000 with Navy for Signs, Advertising Displays, and Identification Plates. Signed on 2002-10-17. Completion date: 2002-10-10.
ALBRIGHT, HAROLD B (3504 TEXAS ST; small business) : $1,760 in 2 contractsin 2005
$21,120 with Navy for Other Medical Services. Signed on 2005-05-25. Completion date: 2005-09-30.
-$19,360, same as above.Signed on 2005-09-30. Completion date: 2005-09-30.
Top industries in this zip code by the number of employees in 2005:
2005 - 2018 National Fire Incident Reporting System (NFIRS) incidents
Based on the data from the years 2005 - 2018 the average number of fire incidents per year is 51. The highest number of fire incidents - 95 took place in 2011, and the least - 0 in 2006. The data has a declining trend.
When looking into fire subcategories, the most reports belonged to: Structure Fires (48.8%), and Outside Fires (31.6%).
Fire incident types reported to NFIRS in Zip Code 92104


 Nearest zip codes: 92116, 92134, 92102, 92105, 92108, 92103.
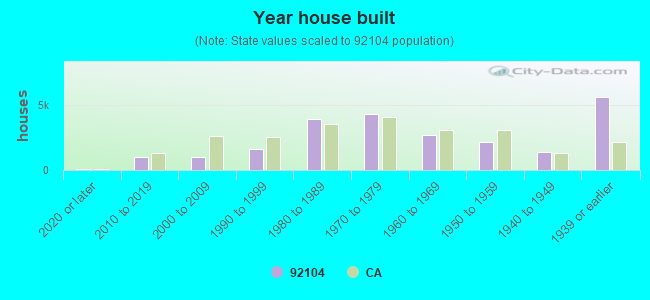


 Based on the data from the years 2005 - 2018 the average number of fire incidents per year is 51. The highest number of fire incidents - 95 took place in 2011, and the least - 0 in 2006. The data has a declining trend.
 When looking into fire subcategories, the most reports belonged to: Structure Fires (48.8%), and Outside Fires (31.6%).