Estimated zip code population in 2022: 66,649 Zip code population in 2010: 56,689 Zip code population in 2000: 49,349
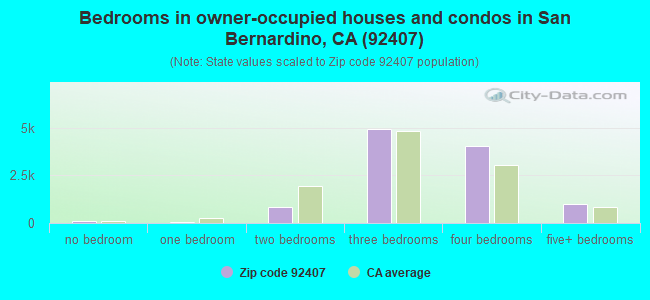
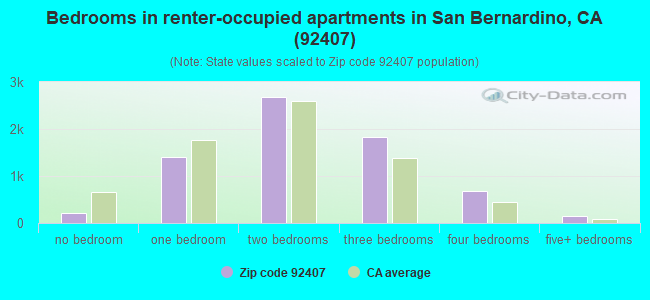
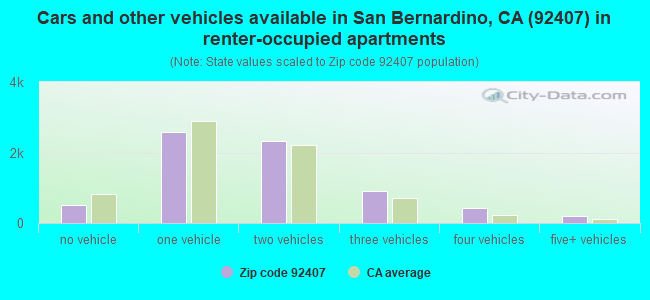
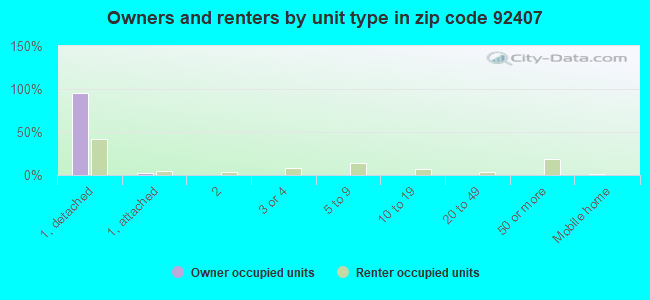
Houses and condos: 18,705 Renter-occupied apartments: 6,959
% of renters here:
39%
State:
44%
March 2022 cost of living index in zip code 92407: 81.9 (low, U.S. average is 100)
Land area: 62.9 sq. mi. Water area: 0.7 sq. mi.
Population density: 1,060 people per square mile
(low).
OSM Map
General Map
Google Map
MSN Map
OSM Map
General Map
Google Map
MSN Map
OSM Map
General Map
Google Map
MSN Map
OSM Map
General Map
Google Map
MSN Map
Please wait while loading the map...
Real estate property taxes paid for housing units in 2022:
This zip code:
0.7% ($3,511)
California:
0.7% ($4,831)
Median real estate property taxes paid for housing units with mortgages in 2022: $3,636 (0.8%) Median real estate property taxes paid for housing units with no mortgage in 2022: $2,928 (0.6%)
Averages for the 2020 tax year for zip code 92407, filed in 2021:
Average Adjusted Gross Income (AGI) in 2020: $52,090 (Individual Income Tax Returns)
Here:
$52,090
State:
$95,910
Salary/wage: $49,448 (reported on 86.4% of returns)
Here:
$49,448
State:
$77,331
(% of AGI for various income ranges: 1182.9% for AGIs below $25k, 3931.5% for AGIs $25k-50k, 7558.3% for AGIs $50k-75k, 10830.6% for AGIs $75k-100k, 20421.1% for AGIs $100k-200k, 62729.4% for AGIs over 200k)
Taxable interest for individuals: $340 (reported on 25.1% of returns)
This zip code:
$340
California:
$2,294
(% of AGI for various income ranges: 2.8% for AGIs below $25k, 5.0% for AGIs $25k-50k, 10.7% for AGIs $50k-75k, 13.9% for AGIs $75k-100k, 39.2% for AGIs $100k-200k, 415.0% for AGIs over 200k)
Ordinary dividends: $1,701 (reported on 5.3% of returns)
Here:
$1,701
State:
$10,949
(% of AGI for various income ranges: 3.8% for AGIs below $25k, 4.8% for AGIs $25k-50k, 13.2% for AGIs $50k-75k, 20.6% for AGIs $75k-100k, 37.8% for AGIs $100k-200k, 365.6% for AGIs over 200k)
Net capital gain/loss in AGI: +$9,206 (reported on 6.4% of returns)
Here:
+$9,206
State:
+$49,306
(% of AGI for various income ranges: 2.4% for AGIs below $25k, 7.3% for AGIs $25k-50k, 19.4% for AGIs $50k-75k, 45.5% for AGIs $75k-100k, 196.6% for AGIs $100k-200k, 7396.3% for AGIs over 200k)
Profit/loss from business: +$7,168 (reported on 16.4% of returns)
Here:
+$7,168
State:
+$15,671
(% of AGI for various income ranges: 170.3% for AGIs below $25k, 128.0% for AGIs $25k-50k, 157.4% for AGIs $50k-75k, 120.6% for AGIs $75k-100k, 181.2% for AGIs $100k-200k, 1729.4% for AGIs over 200k)
Taxable individual retirement arrangement distribution: $15,973 (reported on 2.4% of returns)
92407:
$15,973
California:
$23,505
(% of AGI for various income ranges: 11.7% for AGIs below $25k, 16.3% for AGIs $25k-50k, 62.6% for AGIs $50k-75k, 85.3% for AGIs $75k-100k, 196.3% for AGIs $100k-200k, 1396.2% for AGIs over 200k)
Self-employed (Keogh) retirement plans: $12,600 (reported on 0.1% of returns)
92407:
$12,600
California:
$30,163
(% of AGI for various income ranges: 8.1% for AGIs $50k-75k)
Total itemized deductions: $29,949 (reported on 13.7% of returns)
Here:
$29,949
State:
$39,517
(% of AGI for various income ranges: 38.2% for AGIs below $25k, 168.1% for AGIs $25k-50k, 683.6% for AGIs $50k-75k, 1303.0% for AGIs $75k-100k, 2496.8% for AGIs $100k-200k, 9630.6% for AGIs over 200k)
Charity contributions: $5,784 (reported on 11.7% of returns)
Here:
$5,784
State:
$12,598
(% of AGI for various income ranges: 3.0% for AGIs below $25k, 20.3% for AGIs $25k-50k, 83.5% for AGIs $50k-75k, 169.7% for AGIs $75k-100k, 510.9% for AGIs $100k-200k, 1848.8% for AGIs over 200k)
Taxes paid: $8,759 (reported on 13.7% of returns)
92407:
$8,759
State:
$8,807
(% of AGI for various income ranges: 8.3% for AGIs below $25k, 44.4% for AGIs $25k-50k, 204.8% for AGIs $50k-75k, 426.6% for AGIs $75k-100k, 771.5% for AGIs $100k-200k, 2028.8% for AGIs over 200k)
Earned income credit: $2,322 (reported on 21.8% of returns)
Here:
$2,322
State:
$2,074
(% of AGI for various income ranges: 119.9% for AGIs below $25k, 86.6% for AGIs $25k-50k, 1.5% for AGIs $50k-75k)
Percentage of individuals using paid preparers for their 2020 taxes: 92.9%
Here:
93%
State:
92%
(% for various income ranges: 92.2% for AGIs below $25k, 93.4% for AGIs $25k-50k, 92.6% for AGIs $50k-75k, 92.6% for AGIs $75k-100k, 94.1% for AGIs $100k-200k, 94.2% for AGIs over 200k)
Averages for the 2012 tax year for zip code 92407, filed in 2013:
Average Adjusted Gross Income (AGI) in 2012: $40,907 (Individual Income Tax Returns)
Here:
$40,907
State:
$72,726
Salary/wage: $39,338 (reported on 87.2% of returns)
Here:
$39,338
State:
$59,079
(% of AGI for various income ranges: 76.4% for AGIs below $25k, 87.8% for AGIs $25k-50k, 86.7% for AGIs $50k-75k, 87.3% for AGIs $75k-100k, 84.3% for AGIs $100k-200k, 58.9% for AGIs over 200k)
Taxable interest for individuals: $381 (reported on 24.8% of returns)
This zip code:
$381
California:
$2,146
(% of AGI for various income ranges: 0.3% for AGIs below $25k, 0.2% for AGIs $25k-50k, 0.3% for AGIs $50k-75k, 0.2% for AGIs $75k-100k, 0.1% for AGIs $100k-200k, 0.3% for AGIs over 200k)
Ordinary dividends: $1,889 (reported on 5.8% of returns)
Here:
$1,889
State:
$9,308
(% of AGI for various income ranges: 0.2% for AGIs below $25k, 0.3% for AGIs $25k-50k, 0.2% for AGIs $50k-75k, 0.1% for AGIs $75k-100k, 0.2% for AGIs $100k-200k, 1.4% for AGIs over 200k)
Net capital gain/loss in AGI: +$2,346 (reported on 4.6% of returns)
Here:
+$2,346
State:
+$30,460
(% of AGI for various income ranges: 0.2% for AGIs $75k-100k, 0.3% for AGIs $100k-200k, 3.8% for AGIs over 200k)
Profit/loss from business: +$8,804 (reported on 16.4% of returns)
Here:
+$8,804
State:
+$17,064
(% of AGI for various income ranges: 13.8% for AGIs below $25k, 2.6% for AGIs $25k-50k, 1.5% for AGIs $50k-75k, 1.0% for AGIs $75k-100k, 1.1% for AGIs $100k-200k, 6.1% for AGIs over 200k)
Taxable individual retirement arrangement distribution: $12,199 (reported on 3.3% of returns)
92407:
$12,199
California:
$19,557
(% of AGI for various income ranges: 0.7% for AGIs below $25k, 0.9% for AGIs $25k-50k, 0.9% for AGIs $50k-75k, 1.0% for AGIs $75k-100k, 1.5% for AGIs $100k-200k)
Self-employment retirement plans: $12,450 (reported on 0.1% of returns)
92407:
$12,450
California:
$24,530
Total itemized deductions: $22,038 (29% of AGI, reported on 30.0% of returns)
Here:
$22,038
State:
$34,004
Here:
28.8% of AGI
State:
22.7% of AGI
(% of AGI for various income ranges: 6.1% for AGIs below $25k, 11.9% for AGIs $25k-50k, 18.4% for AGIs $50k-75k, 21.1% for AGIs $75k-100k, 21.1% for AGIs $100k-200k, 19.1% for AGIs over 200k)
Charity contributions: $3,046 (reported on 24.8% of returns)
Here:
$3,046
State:
$4,659
(% of AGI for various income ranges: 0.4% for AGIs below $25k, 1.2% for AGIs $25k-50k, 2.1% for AGIs $50k-75k, 2.4% for AGIs $75k-100k, 2.7% for AGIs $100k-200k, 2.4% for AGIs over 200k)
Taxes paid: $6,172 (reported on 29.9% of returns)
92407:
$6,172
State:
$14,448
(% of AGI for various income ranges: 1.1% for AGIs below $25k, 2.5% for AGIs $25k-50k, 4.6% for AGIs $50k-75k, 6.0% for AGIs $75k-100k, 7.1% for AGIs $100k-200k, 7.3% for AGIs over 200k)
Earned income credit: $2,676 (reported on 31.3% of returns)
Here:
$2,676
State:
$2,286
(% of AGI for various income ranges: 11.2% for AGIs below $25k, 1.9% for AGIs $25k-50k)
Percentage of individuals using paid preparers for their 2012 taxes: 66.1%
Here:
66%
State:
64%
(% for various income ranges: 63.1% for AGIs below $25k, 68.8% for AGIs $25k-50k, 67.9% for AGIs $50k-75k, 68.8% for AGIs $75k-100k, 67.9% for AGIs $100k-200k, 83.3% for AGIs over 200k)
Averages for the 2004 tax year for zip code 92407, filed in 2005:
Average Adjusted Gross Income (AGI) in 2004: $37,990 (Individual Income Tax Returns)
Here:
$37,990
State:
$58,600
Salary/wage: $35,957 (reported on 90.6% of returns)
Here:
$35,957
State:
$49,455
(% of AGI for various income ranges: 94.3% for AGIs below $10k, 84.6% for AGIs $10k-25k, 90.7% for AGIs $25k-50k, 90.1% for AGIs $50k-75k, 90.4% for AGIs $75k-100k, 69.9% for AGIs over 100k)
Taxable interest for individuals: $592 (reported on 31.1% of returns)
This zip code:
$592
California:
$2,365
(% of AGI for various income ranges: 1.2% for AGIs below $10k, 0.5% for AGIs $10k-25k, 0.3% for AGIs $25k-50k, 0.5% for AGIs $50k-75k, 0.4% for AGIs $75k-100k, 0.7% for AGIs over 100k)
Taxable dividends: $1,007 (reported on 8.0% of returns)
Here:
$1,007
State:
$4,746
(% of AGI for various income ranges: 0.6% for AGIs below $10k, 0.2% for AGIs $10k-25k, 0.1% for AGIs $25k-50k, 0.2% for AGIs $50k-75k, 0.2% for AGIs $75k-100k, 0.3% for AGIs over 100k)
Net capital gain/loss: +$7,303 (reported on 6.5% of returns)
Here:
+$7,303
State:
+$23,418
(% of AGI for various income ranges: -0.6% for AGIs below $10k, 0.1% for AGIs $10k-25k, 0.1% for AGIs $25k-50k, 0.6% for AGIs $50k-75k, 1.2% for AGIs $75k-100k, 4.6% for AGIs over 100k)
Profit/loss from business: +$9,068 (reported on 14.2% of returns)
Here:
+$9,068
State:
+$16,826
(% of AGI for various income ranges: 14.0% for AGIs below $10k, 7.1% for AGIs $10k-25k, 2.8% for AGIs $25k-50k, 1.7% for AGIs $50k-75k, 1.9% for AGIs $75k-100k, 3.7% for AGIs over 100k)
IRA payment deduction: $2,623 (reported on 1.4% of returns)
92407:
$2,623
California:
$3,192
(% of AGI for various income ranges: 0.1% for AGIs $10k-25k, 0.1% for AGIs $25k-50k, 0.1% for AGIs $50k-75k, 0.1% for AGIs $75k-100k, 0.1% for AGIs over 100k)
Self-employed pension: $10,030 (reported on 0.2% of returns)
Here:
$10,030
California:
$17,688
Total itemized deductions: $19,414 (30% of AGI, reported on 37.5% of returns)
Here:
$19,414
State:
$28,113
Here:
29.8% of AGI
State:
25.3% of AGI
(% of AGI for various income ranges: 7.8% for AGIs below $10k, 9.3% for AGIs $10k-25k, 18.8% for AGIs $25k-50k, 23.7% for AGIs $50k-75k, 23.7% for AGIs $75k-100k, 18.2% for AGIs over 100k)
Charity contributions deductions: $2,650 (4% of AGI, reported on 33.7% of returns)
Here:
$2,650
State:
$3,923
Here:
3.9% of AGI
State:
3.3% of AGI
(% of AGI for various income ranges: 0.4% for AGIs below $10k, 1.0% for AGIs $10k-25k, 2.0% for AGIs $25k-50k, 2.8% for AGIs $50k-75k, 3.0% for AGIs $75k-100k, 2.9% for AGIs over 100k)
Total tax: $4,333 (reported on 66.5% of returns)
92407:
$4,333
State:
$10,761
(% of AGI for various income ranges: 3.4% for AGIs below $10k, 3.5% for AGIs $10k-25k, 5.0% for AGIs $25k-50k, 6.9% for AGIs $50k-75k, 8.5% for AGIs $75k-100k, 14.2% for AGIs over 100k)
Earned income credit: $2,031 (reported on 26.2% of returns)
Here:
$2,031
State:
$1,763
Percentage of individuals using paid preparers for their 2004 taxes: 71.2%
Here:
71%
State:
66%
(% for various income ranges: 66.6% for AGIs below $10k, 73.3% for AGIs $10k-25k, 71.4% for AGIs $25k-50k, 71.9% for AGIs $50k-75k, 69.7% for AGIs $75k-100k, 73.7% for AGIs over 100k)
Likely homosexual households (counted as self-reported same-sex unmarried-partner households)
Lesbian couples: 0.0% of all households
Gay men: 0.1% of all households
Household received Food Stamps/SNAP in the past 12 months: 3,798 Household did not receive Food Stamps/SNAP in the past 12 months: 14,458
Women who had a birth in the past 12 months: 986 (379 now married, 613 unmarried) Women who did not have a birth in the past 12 months: 16,581 (6,062 now married, 10,540 unmarried)
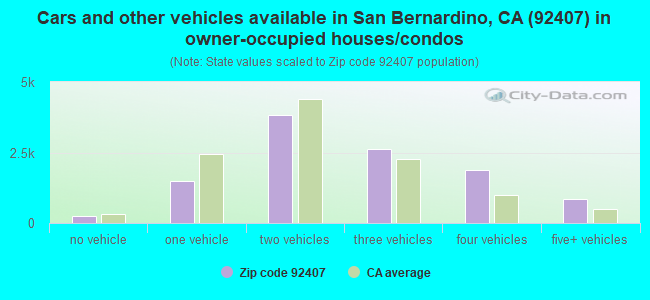
Housing units in zip code 92407 with a mortgage: 8,489 (696 second mortgage, 522 both second mortgage and home equity loan) Houses without a mortgage: 26
Median monthly owner costs for units with a mortgage: $2,120 Median monthly owner costs for units without a mortgage: $621
Residents with income below the poverty level in 2022:
This zip code:
14.1%
Whole state:
12.2%
Residents with income below 50% of the poverty level in 2022:
This zip code:
7.9%
Whole state:
6.2%
Median number of rooms in houses and condos:
Here:
6.2
State:
6.0
Median number of rooms in apartments:
Here:
4.3
State:
3.9
Notable locations in this zip code not listed on our city pages
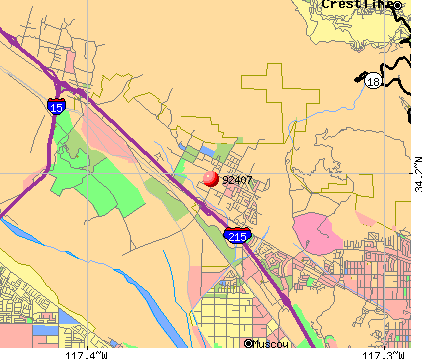
Notable locations in zip code 92407: Hitching Ranch (A), Little Mountain Lookout (B), Devil Canyon Station (C), Cajon Campground (D), Shandin Hills Golf Course (E), Sycamore Station (F), Verdemont Ranch (G), Glen Helen Rehabilitation Facility (H), Alderson Place (I), University Hall (J), John M Pfau Library (K), Jack H Brown Hall (L), California Department of Forestry and Fire Protection Station 2 Devore (M), San Bernardino City Fire Department Station 227 (N), San Bernardino County Fire Department Station 75 Muscoy (O), San Bernardino City Fire Department Station 225 (P), San Bernardino City Fire Department Station 232 (Q), San Bernardino County Fire Department Station 2 Devore (R), Western Little League Headquarters (S), Muscovy Grange (T). Display/hide their locations on the map
Churches in zip code 92407 include: San Bernardino Christian Center (A), Northpark Community Church (B), Muscoy Church of Christ (C), Metro City Church (D), Community Bible Church (E), Hebrew Christian Witness Church (F), Living Fiath Full Gospel Church (G), Muscovy Faith Assembly of God Church (H), Muscovy United Methodist Church (I). Display/hide their locations on the map
Parks in zip code 92407 include: Glen Helen Regional Park (1), Blake Park (2), Buckboard Park (3), Glen Helen Off Highway Vehicle Park (4), Guhin Park (5), Verdemont Park (6), Dellman Heights Park (7), Hudson Park (8). Display/hide their locations on the map
9,400 married couples with children.
5,798 single-parent households (1,883 men, 3,915 women).
50.0% of residents of 92407 zip code speak English at home.
44.6% of residents speak Spanish at home (71% very well, 15% well, 10% not well, 5% not at all).
0.5% of residents speak other Indo-European language at home (84% very well, 14% well, 2% not well).
2.8% of residents speak Asian or Pacific Island language at home (48% very well, 26% well, 20% not well, 5% not at all).
1.4% of residents speak other language at home (71% very well, 20% well, 8% not well, 1% not at all).
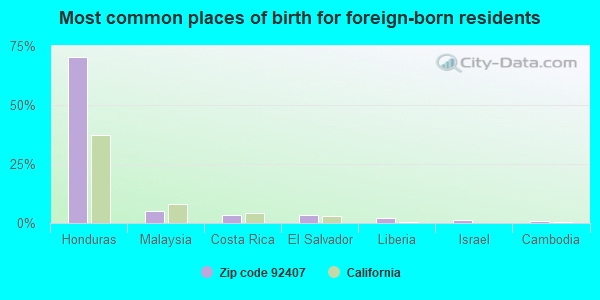
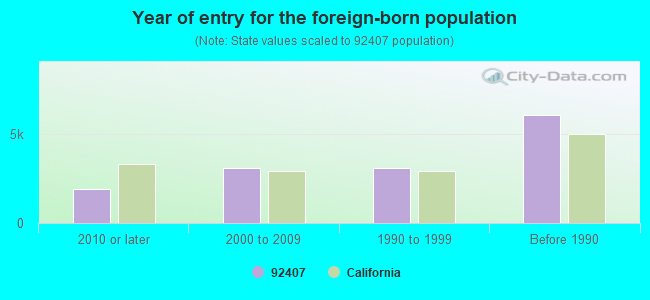
Foreign born population: 13,922 (20.9%) (50.1% of them are naturalized citizens)
Major facilities with environmental interests located in this zip code:
FRED G WALTER & SON (5770 INDUSTRIAL PKWY in SAN BERNARDINO, CA)
STATE MASTER (California - Hazardous Waste Tracking) - HAZARDOU WASTE PROGRAM (Resource Conservation and Recovery Act (tracking hazardous waste)) Business NAICS classification: OTHER COMMERCIAL AND SERVICE INDUSTRY MACHINERY MANUFACTURING. Organizations: ROBERT & DOLORES WALTER (CONTACT/OWNER)
GLEN HELEN REHAB CENTER (1200 INSTITUTION RD in SAN BERNARDINO, CA)
STATE MASTER (California - Hazardous Waste Tracking) - HAZARDOU WASTE PROGRAM Small Quantity Generators, between 100 kg and 1000 kg of hazardous waste/month (Resource Conservation and Recovery Act (tracking hazardous waste)) - notification Business NAICS classification: ADMINISTRATIVE MANAGEMENT AND GENERAL MANAGEMENT CONSULTING SERVICES. Organizations: SAN BERNARDINO CNTY (CONTACT/OWNER)
MCLANE DISTRIBUTION SOUTHERN CAL (4472 GEORGIA BOULEVARD in SAN BERNARDINO, CA)
STATE MASTER (California - Hazardous Waste Tracking) - HAZARDOU WASTE PROGRAM Small Quantity Generators, between 100 kg and 1000 kg of hazardous waste/month (Resource Conservation and Recovery Act (tracking hazardous waste)) - notification Organizations: MCLANE CO INC (CONTACT/OWNER)
Alternative names: MCLANE SOUTHERN CALIFORNIA
A AND A AUTO SVC (4342 N SIERRA in SAN BERNARDINO, CA)
STATE MASTER (California - Hazardous Waste Tracking) - HAZARDOU WASTE PROGRAM Small Quantity Generators, between 100 kg and 1000 kg of hazardous waste/month (Resource Conservation and Recovery Act (tracking hazardous waste)) - notification Organizations: ASSAL IBRAHIM (CONTACT/OWNER)
HARMON (YVONNE) DCH (4865 STATE ST. in SAN BERNARDINO, CA)
(National Center for Education Statistics) - STATE ID-6098560 Organizations: SAN BERNARDINO CITY UNIFIED (SCHOOL DISTRICT)
HILLSIDE ELEMENTARY (4975 MAYFIELD AVE. in SAN BERNARDINO, CA)
(National Center for Education Statistics) - STATE ID-6036909 Organizations: SAN BERNARDINO CITY UNIFIED (SCHOOL DISTRICT)
KENDALL ELEMENTARY (4951 STATE ST. in SAN BERNARDINO, CA)
(National Center for Education Statistics) - STATE ID-6036933 Organizations: SAN BERNARDINO CITY UNIFIED (SCHOOL DISTRICT)
KIMBARK ELEMENTARY (18021 KENWOOD AVE. in SAN BERNARDINO, CA)
(National Center for Education Statistics) - STATE ID-6067078 Organizations: SAN BERNARDINO CITY UNIFIED (SCHOOL DISTRICT)
NEWMARK ELEMENTARY (4121 N. THIRD AVE. in SAN BERNARDINO, CA)
(National Center for Education Statistics) - STATE ID-6037055 Organizations: SAN BERNARDINO CITY UNIFIED (SCHOOL DISTRICT)
NORTH PARK ELEMENTARY (5378 NORTH H ST. in SAN BERNARDINO, CA)
(National Center for Education Statistics) - STATE ID-6067086 Organizations: SAN BERNARDINO CITY UNIFIED (SCHOOL DISTRICT)
NORTH VERDEMONT ELEMENTARY (3557 MEYERS ROAD in SAN BERNARDINO, CA)
(National Center for Education Statistics) - STATE ID-6110480 Organizations: SAN BERNARDINO CITY UNIFIED (SCHOOL DISTRICT)
CAJON HIGH (1200 HILL DR. in SAN BERNARDINO, CA)
(National Center for Education Statistics) - STATE ID-3632221 Organizations: SAN BERNARDINO CITY UNIFIED (SCHOOL DISTRICT)
CARMACK SCHOOL FOR THE PH (4777 STATE ST. in SAN BERNARDINO, CA)
(National Center for Education Statistics) - STATE ID-3630043 Organizations: SAN BERNARDINO CITY UNIFIED (SCHOOL DISTRICT)
Housing units lacking complete plumbing facilities: 0.4% Housing units lacking complete kitchen facilities: 3.4%
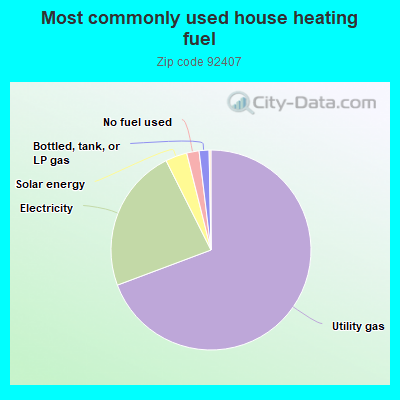
69.3%Utility gas
23.3%Electricity
3.5%Solar energy
2.0%No fuel used
1.6%Bottled, tank, or LP gas
Population in 1990: 44,927. Population change in the 1990s: +4,422 (+9.8%).
Place of birth for U.S.-born residents:
This state: 47,081
Northeast: 1,066
Midwest: 1,166
South: 1,857
West: 1,222
47% of the 92407 zip code residents lived in the same house 5 years ago. Out of people who lived in different houses, 73% lived in this county. Out of people who lived in different counties, 50% lived in California.
91% of the 92407 zip code residents lived in the same house 1 year ago. Out of people who lived in different houses, 60% moved from this county. Out of people who lived in different houses, 30% moved from different county within same state. Out of people who lived in different houses, 5% moved from different state. Out of people who lived in different houses, 5% moved from abroad.
Private vs. public school enrollment:
Students in private schools in grades 1 to 8 (elementary and middle school): 510
Here:
6.8%
California:
10.5%
Students in private schools in grades 9 to 12 (high school): 266
Here:
6.2%
California:
8.5%
Students in private undergraduate colleges: 763
Here:
13.7%
California:
15.9%
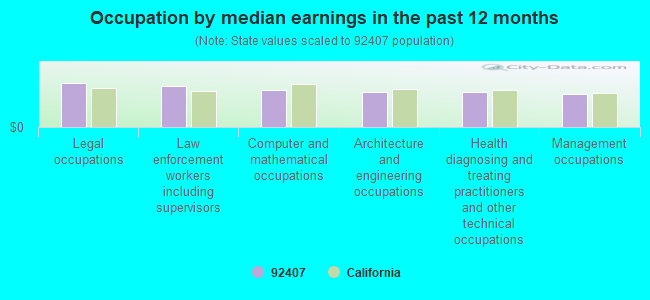
Occupation by median earnings in the past 12 months ($)
105,621Legal occupations
98,680Law enforcement workers including supervisors
88,040Computer and mathematical occupations
84,575Architecture and engineering occupations
83,734Health diagnosing and treating practitioners and other technical occupations
79,727Management occupations
Companies with federal contracts located in this zip code:
CALIFORNIA STATE UNIVERSITY, S (5500 UNIVERSITY PARKWAY in SAN BERNARDINO, CA) : $6,000,498 in 14 contractsfrom 2002 to 2006
Contracts for Training/Curriculum Development, Aeronautics and Space Technology -- Basic Research (R&D), Endangered Species Studies - Plant and Animal, Tuition, Registration, and Membership Fees, and moreby Army, NASA, U.S. Army Corps of Engineers - civil program financing only, Air Force, and others Signed by year:2000: $0; 2001: $0; 2002: $135,244; 2003: $158,686; 2004: $3,238,400; 2005: $2,456,721; 2006: $11,447.
Biggest contracts:
$3,150,000 with Army for Training/Curriculum Development. Taking place in VA. Signed on 2004-08-04. Completion date: 2005-09-01.
$2,362,000, same as above.Signed on 2005-09-23. Completion date: 2005-09-01.
$98,568 with NASA for Aeronautics and Space Technology -- Basic Research (R&D). Signed on 2003-10-01. Completion date: 2005-03-21.
$88,400 with Army for Training/Curriculum Development. Taking place in VA. Signed on 2004-09-16. Completion date: 2005-09-01.
ROY C PHARES ENTERPRISES (18424 SANTA FE AVE in SAN BERNARDINO, CA; small business) : $51,912 in 2 contractsin 2000
$47,912 with Navy for Maintenance, Repair or Alteration of Real Property -- Electronic and Communications Facilities. Signed on 2000-05-18. Completion date: 2000-07-12.
$4,000, same as above.Signed on 2000-07-21. Completion date: 2000-07-21.
Top industries in this zip code by the number of employees in 2005:
2005 - 2018 National Fire Incident Reporting System (NFIRS) incidents
Based on the data from the years 2005 - 2018 the average number of fire incidents per year is 64. The highest number of fires - 210 took place in 2018, and the least - 7 in 2010. The data has an increasing trend.
When looking into fire subcategories, the most incidents belonged to: Outside Fires (44.2%), and Mobile Property/Vehicle Fires (30.5%).
Fire incident types reported to NFIRS in Zip Code 92407


 Nearest zip codes: 92377, 92322, 92376, 92325, 92405, 92336.
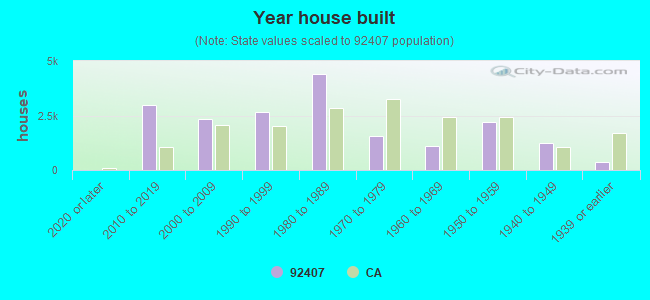


 Based on the data from the years 2005 - 2018 the average number of fire incidents per year is 64. The highest number of fires - 210 took place in 2018, and the least - 7 in 2010. The data has an increasing trend.
 When looking into fire subcategories, the most incidents belonged to: Outside Fires (44.2%), and Mobile Property/Vehicle Fires (30.5%).