Estimated zip code population in 2022: 24,228 Zip code population in 2010: 21,495 Zip code population in 2000: 17,619
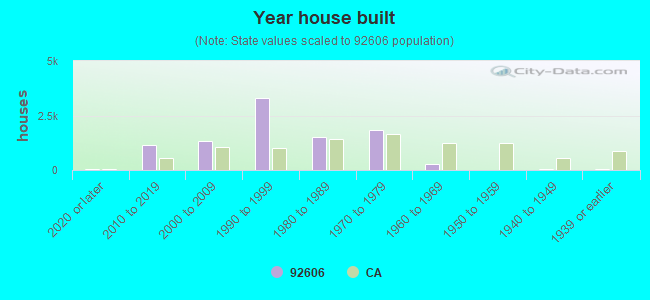
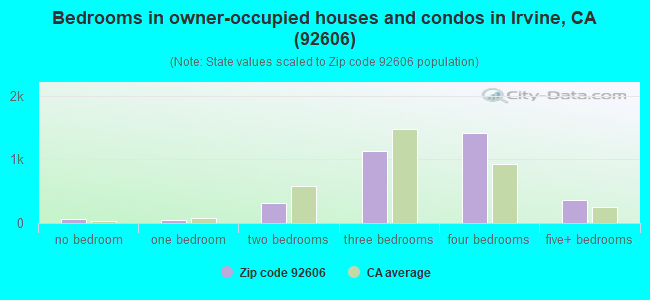
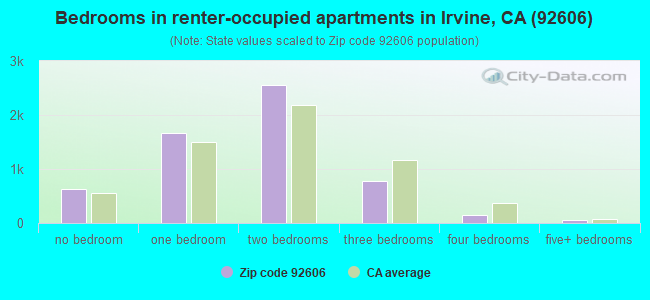
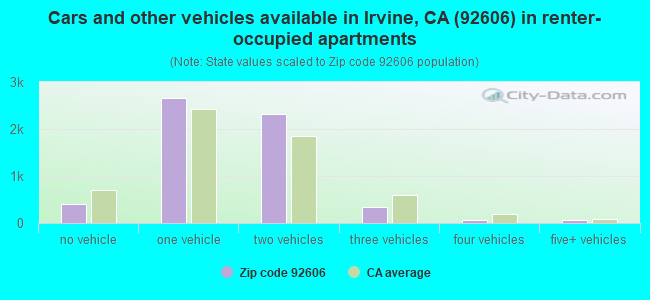
Houses and condos: 9,703 Renter-occupied apartments: 5,837
% of renters here:
64%
State:
44%
March 2022 cost of living index in zip code 92606: 87.9 (less than average, U.S. average is 100)
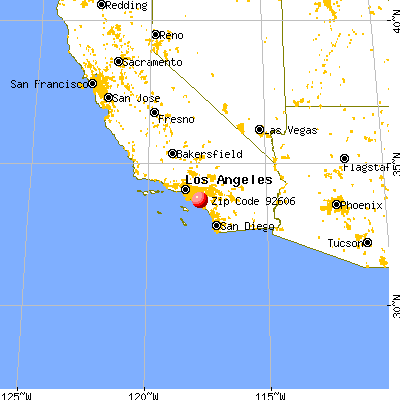
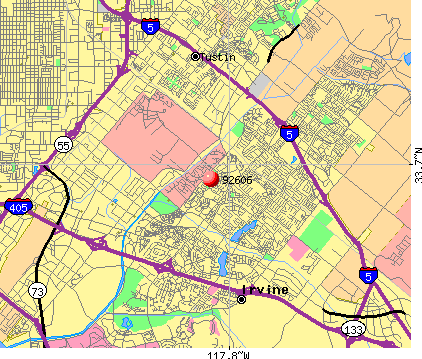
Land area: 4.8 sq. mi. Water area: 0.0 sq. mi.
Population density: 5,000 people per square mile
(average).
OSM Map
General Map
Google Map
MSN Map
OSM Map
General Map
Google Map
MSN Map
OSM Map
General Map
Google Map
MSN Map
OSM Map
General Map
Google Map
MSN Map
Please wait while loading the map...
Real estate property taxes paid for housing units in 2022:
This zip code:
0.6% ($6,418)
California:
0.7% ($4,831)
Median real estate property taxes paid for housing units with mortgages in 2022: $6,777 (0.6%) Median real estate property taxes paid for housing units with no mortgage in 2022: $5,580 (0.6%)
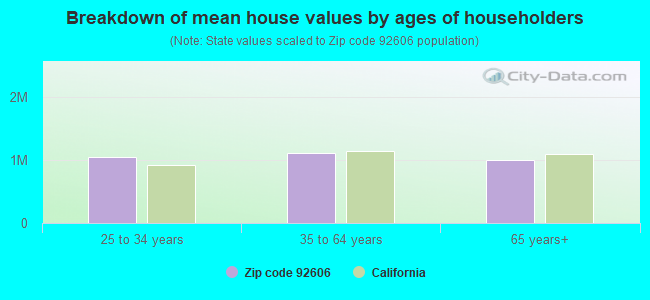
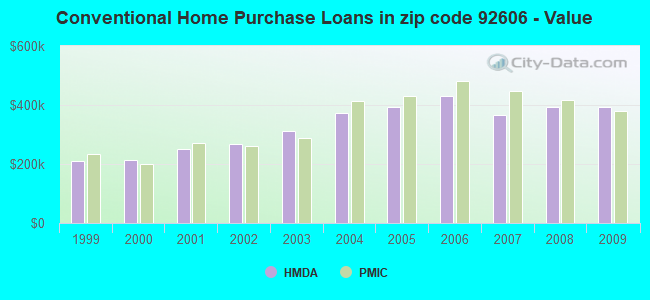
Estimated median house/condo value in 2022: $1,028,733
92606:
$1,028,733
California:
$715,900
According to our research of California and other state lists, there were 5 registered sex offenders living in 92606 zip code as of April 26, 2024. The ratio of all residents to sex offenders in zip code 92606 is 4,692 to 1. The ratio of registered sex offenders to all residents in this zip code is much lower than the state average.
Median resident age:
This zip code:
33.9 years
California median age:
37.9 years
Average household size:
This zip code:
2.6 people
California:
2.8 people
Averages for the 2020 tax year for zip code 92606, filed in 2021:
Average Adjusted Gross Income (AGI) in 2020: $105,339 (Individual Income Tax Returns)
Here:
$105,339
State:
$95,910
Salary/wage: $92,022 (reported on 82.2% of returns)
Here:
$92,022
State:
$77,331
(% of AGI for various income ranges: 1198.3% for AGIs below $25k, 3827.1% for AGIs $25k-50k, 7830.5% for AGIs $50k-75k, 11845.2% for AGIs $75k-100k, 21611.9% for AGIs $100k-200k, 104520.0% for AGIs over 200k)
Taxable interest for individuals: $2,834 (reported on 39.9% of returns)
This zip code:
$2,834
California:
$2,294
(% of AGI for various income ranges: 33.7% for AGIs below $25k, 59.2% for AGIs $25k-50k, 56.0% for AGIs $50k-75k, 118.3% for AGIs $75k-100k, 228.8% for AGIs $100k-200k, 2064.5% for AGIs over 200k)
Ordinary dividends: $5,876 (reported on 30.4% of returns)
Here:
$5,876
State:
$10,949
(% of AGI for various income ranges: 31.8% for AGIs below $25k, 73.2% for AGIs $25k-50k, 81.8% for AGIs $50k-75k, 144.3% for AGIs $75k-100k, 342.2% for AGIs $100k-200k, 3645.5% for AGIs over 200k)
Net capital gain/loss in AGI: +$18,883 (reported on 31.3% of returns)
Here:
+$18,883
State:
+$49,306
(% of AGI for various income ranges: 17.9% for AGIs below $25k, 94.6% for AGIs $25k-50k, 113.2% for AGIs $50k-75k, 216.7% for AGIs $75k-100k, 753.2% for AGIs $100k-200k, 15370.0% for AGIs over 200k)
Profit/loss from business: +$12,239 (reported on 21.1% of returns)
Here:
+$12,239
State:
+$15,671
(% of AGI for various income ranges: 227.6% for AGIs below $25k, 359.3% for AGIs $25k-50k, 313.3% for AGIs $50k-75k, 412.2% for AGIs $75k-100k, 390.7% for AGIs $100k-200k, 2653.9% for AGIs over 200k)
Taxable individual retirement arrangement distribution: $23,126 (reported on 5.8% of returns)
92606:
$23,126
California:
$23,505
(% of AGI for various income ranges: 38.4% for AGIs below $25k, 117.9% for AGIs $25k-50k, 121.2% for AGIs $50k-75k, 259.3% for AGIs $75k-100k, 466.0% for AGIs $100k-200k, 1195.8% for AGIs over 200k)
Self-employed (Keogh) retirement plans: $32,200 (reported on 0.7% of returns)
92606:
$32,200
California:
$30,163
(% of AGI for various income ranges: 82.9% for AGIs $100k-200k, 486.7% for AGIs over 200k)
Total itemized deductions: $34,710 (reported on 15.1% of returns)
Here:
$34,710
State:
$39,517
(% of AGI for various income ranges: 109.7% for AGIs below $25k, 168.8% for AGIs $25k-50k, 365.5% for AGIs $50k-75k, 749.1% for AGIs $75k-100k, 1607.5% for AGIs $100k-200k, 7687.9% for AGIs over 200k)
Charity contributions: $8,286 (reported on 12.8% of returns)
Here:
$8,286
State:
$12,598
(% of AGI for various income ranges: 7.3% for AGIs below $25k, 17.7% for AGIs $25k-50k, 40.5% for AGIs $50k-75k, 104.3% for AGIs $75k-100k, 255.0% for AGIs $100k-200k, 2150.9% for AGIs over 200k)
Taxes paid: $9,030 (reported on 15.1% of returns)
92606:
$9,030
State:
$8,807
(% of AGI for various income ranges: 23.2% for AGIs below $25k, 43.5% for AGIs $25k-50k, 101.2% for AGIs $50k-75k, 234.8% for AGIs $75k-100k, 485.0% for AGIs $100k-200k, 1709.1% for AGIs over 200k)
Earned income credit: $1,867 (reported on 10.2% of returns)
Here:
$1,867
State:
$2,074
(% of AGI for various income ranges: 65.1% for AGIs below $25k, 60.1% for AGIs $25k-50k)
Percentage of individuals using paid preparers for their 2020 taxes: 93.2%
Here:
93%
State:
92%
(% for various income ranges: 92.1% for AGIs below $25k, 94.5% for AGIs $25k-50k, 94.9% for AGIs $50k-75k, 92.8% for AGIs $75k-100k, 92.7% for AGIs $100k-200k, 93.1% for AGIs over 200k)
Averages for the 2012 tax year for zip code 92606, filed in 2013:
Average Adjusted Gross Income (AGI) in 2012: $88,361 (Individual Income Tax Returns)
Here:
$88,361
State:
$72,726
Salary/wage: $81,807 (reported on 85.7% of returns)
Here:
$81,807
State:
$59,079
(% of AGI for various income ranges: 77.3% for AGIs below $25k, 82.4% for AGIs $25k-50k, 83.1% for AGIs $50k-75k, 83.9% for AGIs $75k-100k, 86.7% for AGIs $100k-200k, 69.9% for AGIs over 200k)
Taxable interest for individuals: $2,088 (reported on 45.9% of returns)
This zip code:
$2,088
California:
$2,146
(% of AGI for various income ranges: 1.8% for AGIs below $25k, 0.8% for AGIs $25k-50k, 0.8% for AGIs $50k-75k, 0.6% for AGIs $75k-100k, 0.5% for AGIs $100k-200k, 1.8% for AGIs over 200k)
Ordinary dividends: $4,377 (reported on 27.3% of returns)
Here:
$4,377
State:
$9,308
(% of AGI for various income ranges: 1.2% for AGIs below $25k, 1.1% for AGIs $25k-50k, 1.0% for AGIs $50k-75k, 0.9% for AGIs $75k-100k, 0.8% for AGIs $100k-200k, 2.1% for AGIs over 200k)
Net capital gain/loss in AGI: +$7,276 (reported on 25.9% of returns)
Here:
+$7,276
State:
+$30,460
(% of AGI for various income ranges: 0.7% for AGIs $75k-100k, 0.6% for AGIs $100k-200k, 5.2% for AGIs over 200k)
Profit/loss from business: +$16,110 (reported on 19.5% of returns)
Here:
+$16,110
State:
+$17,064
(% of AGI for various income ranges: 14.3% for AGIs below $25k, 7.8% for AGIs $25k-50k, 4.6% for AGIs $50k-75k, 3.4% for AGIs $75k-100k, 2.8% for AGIs $100k-200k, 2.0% for AGIs over 200k)
Taxable individual retirement arrangement distribution: $17,438 (reported on 6.1% of returns)
92606:
$17,438
California:
$19,557
(% of AGI for various income ranges: 2.2% for AGIs below $25k, 2.0% for AGIs $25k-50k, 1.8% for AGIs $50k-75k, 1.9% for AGIs $75k-100k, 1.2% for AGIs $100k-200k, 0.6% for AGIs over 200k)
Self-employment retirement plans: $19,880 (reported on 1.1% of returns)
92606:
$19,880
California:
$24,530
(% of AGI for various income ranges: 0.4% for AGIs $25k-50k, 0.2% for AGIs $100k-200k, 0.4% for AGIs over 200k)
Total itemized deductions: $32,565 (22% of AGI, reported on 44.3% of returns)
Here:
$32,565
State:
$34,004
Here:
21.6% of AGI
State:
22.7% of AGI
(% of AGI for various income ranges: 12.8% for AGIs below $25k, 11.3% for AGIs $25k-50k, 14.7% for AGIs $50k-75k, 16.4% for AGIs $75k-100k, 17.8% for AGIs $100k-200k, 16.7% for AGIs over 200k)
Charity contributions: $3,948 (reported on 36.8% of returns)
Here:
$3,948
State:
$4,659
(% of AGI for various income ranges: 0.7% for AGIs below $25k, 1.2% for AGIs $25k-50k, 1.4% for AGIs $50k-75k, 1.8% for AGIs $75k-100k, 1.9% for AGIs $100k-200k, 1.7% for AGIs over 200k)
Taxes paid: $15,184 (reported on 44.3% of returns)
92606:
$15,184
State:
$14,448
(% of AGI for various income ranges: 3.4% for AGIs below $25k, 3.1% for AGIs $25k-50k, 4.5% for AGIs $50k-75k, 6.2% for AGIs $75k-100k, 7.9% for AGIs $100k-200k, 9.9% for AGIs over 200k)
Earned income credit: $1,900 (reported on 10.9% of returns)
Here:
$1,900
State:
$2,286
(% of AGI for various income ranges: 4.4% for AGIs below $25k, 0.9% for AGIs $25k-50k)
Percentage of individuals using paid preparers for their 2012 taxes: 55.6%
Here:
56%
State:
64%
(% for various income ranges: 52.9% for AGIs below $25k, 52.9% for AGIs $25k-50k, 57.1% for AGIs $50k-75k, 58.2% for AGIs $75k-100k, 55.1% for AGIs $100k-200k, 65.4% for AGIs over 200k)
Averages for the 2004 tax year for zip code 92606, filed in 2005:
Average Adjusted Gross Income (AGI) in 2004: $70,413 (Individual Income Tax Returns)
Here:
$70,413
State:
$58,600
Salary/wage: $65,756 (reported on 87.4% of returns)
Here:
$65,756
State:
$49,455
(% of AGI for various income ranges: 120.3% for AGIs below $10k, 79.5% for AGIs $10k-25k, 86.0% for AGIs $25k-50k, 88.0% for AGIs $50k-75k, 89.3% for AGIs $75k-100k, 77.3% for AGIs over 100k)
Taxable interest for individuals: $1,432 (reported on 57.0% of returns)
This zip code:
$1,432
California:
$2,365
(% of AGI for various income ranges: 6.7% for AGIs below $10k, 2.4% for AGIs $10k-25k, 1.6% for AGIs $25k-50k, 1.2% for AGIs $50k-75k, 0.7% for AGIs $75k-100k, 1.0% for AGIs over 100k)
Taxable dividends: $1,863 (reported on 29.4% of returns)
Here:
$1,863
State:
$4,746
(% of AGI for various income ranges: 4.0% for AGIs below $10k, 1.4% for AGIs $10k-25k, 0.9% for AGIs $25k-50k, 0.5% for AGIs $50k-75k, 0.5% for AGIs $75k-100k, 0.8% for AGIs over 100k)
Net capital gain/loss: +$9,456 (reported on 28.0% of returns)
Here:
+$9,456
State:
+$23,418
(% of AGI for various income ranges: -4.4% for AGIs below $10k, -1.0% for AGIs $10k-25k, 0.4% for AGIs $25k-50k, -0.3% for AGIs $50k-75k, 0.1% for AGIs $75k-100k, 6.5% for AGIs over 100k)
Profit/loss from business: +$16,399 (reported on 18.4% of returns)
Here:
+$16,399
State:
+$16,826
(% of AGI for various income ranges: 15.2% for AGIs below $10k, 11.4% for AGIs $10k-25k, 6.9% for AGIs $25k-50k, 4.2% for AGIs $50k-75k, 5.3% for AGIs $75k-100k, 3.0% for AGIs over 100k)
IRA payment deduction: $3,316 (reported on 4.8% of returns)
92606:
$3,316
California:
$3,192
(% of AGI for various income ranges: 0.5% for AGIs below $10k, 0.4% for AGIs $10k-25k, 0.5% for AGIs $25k-50k, 0.3% for AGIs $50k-75k, 0.2% for AGIs $75k-100k, 0.1% for AGIs over 100k)
Self-employed pension: $15,868 (reported on 1.8% of returns)
Here:
$15,868
California:
$17,688
(% of AGI for various income ranges: 0.3% for AGIs $25k-50k, 0.2% for AGIs $50k-75k, 0.6% for AGIs $75k-100k, 0.5% for AGIs over 100k)
Total itemized deductions: $27,755 (24% of AGI, reported on 47.9% of returns)
Here:
$27,755
State:
$28,113
Here:
24.1% of AGI
State:
25.3% of AGI
(% of AGI for various income ranges: 21.3% for AGIs below $10k, 16.5% for AGIs $10k-25k, 16.5% for AGIs $25k-50k, 19.6% for AGIs $50k-75k, 22.3% for AGIs $75k-100k, 18.5% for AGIs over 100k)
Charity contributions deductions: $3,622 (3% of AGI, reported on 41.7% of returns)
Here:
$3,622
State:
$3,923
Here:
3.0% of AGI
State:
3.3% of AGI
(% of AGI for various income ranges: 0.6% for AGIs below $10k, 0.9% for AGIs $10k-25k, 1.7% for AGIs $25k-50k, 2.0% for AGIs $50k-75k, 2.2% for AGIs $75k-100k, 2.3% for AGIs over 100k)
Total tax: $12,141 (reported on 81.4% of returns)
92606:
$12,141
State:
$10,761
(% of AGI for various income ranges: 4.0% for AGIs below $10k, 5.5% for AGIs $10k-25k, 7.8% for AGIs $25k-50k, 9.9% for AGIs $50k-75k, 10.5% for AGIs $75k-100k, 17.5% for AGIs over 100k)
Earned income credit: $1,505 (reported on 8.2% of returns)
Here:
$1,505
State:
$1,763
Percentage of individuals using paid preparers for their 2004 taxes: 55.7%
Here:
56%
State:
66%
(% for various income ranges: 47.5% for AGIs below $10k, 55.9% for AGIs $10k-25k, 56.0% for AGIs $25k-50k, 57.6% for AGIs $50k-75k, 57.7% for AGIs $75k-100k, 59.7% for AGIs over 100k)
Likely homosexual households (counted as self-reported same-sex unmarried-partner households)
Lesbian couples: 0.3% of all households
Gay men: 0.0% of all households
Household received Food Stamps/SNAP in the past 12 months: 479 Household did not receive Food Stamps/SNAP in the past 12 months: 8,558
Women who had a birth in the past 12 months: 271 (259 now married, 10 unmarried) Women who did not have a birth in the past 12 months: 5,801 (2,261 now married, 3,542 unmarried)
Housing units in zip code 92606 with a mortgage: 1,933 (363 second mortgage, 352 both second mortgage and home equity loan) Median monthly owner costs for units with a mortgage: $3,266 Median monthly owner costs for units without a mortgage: $875
Residents with income below the poverty level in 2022:
This zip code:
12.6%
Whole state:
12.2%
Residents with income below 50% of the poverty level in 2022:
This zip code:
2.4%
Whole state:
6.2%
Median number of rooms in houses and condos:
Here:
6.5
State:
6.0
Median number of rooms in apartments:
Here:
3.7
State:
3.9
Notable locations in this zip code not listed on our city pages
3,437 married couples with children.
1,242 single-parent households (339 men, 903 women).
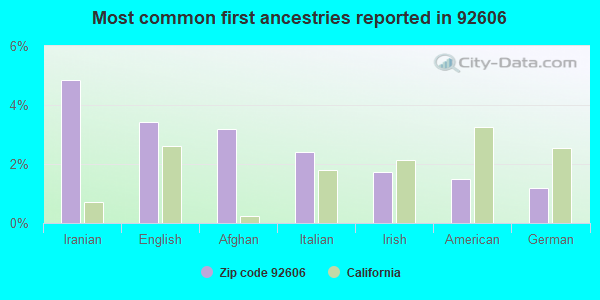
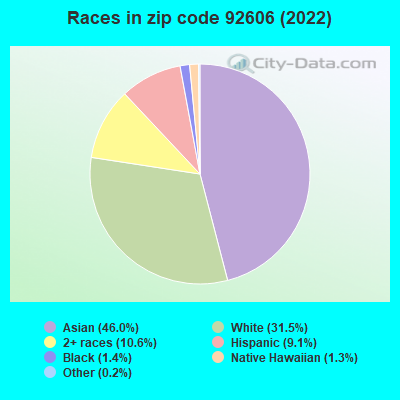
49.4% of residents of 92606 zip code speak English at home.
4.7% of residents speak Spanish at home (89% very well, 9% well, 2% not well).
13.1% of residents speak other Indo-European language at home (84% very well, 10% well, 6% not well, 1% not at all).
30.1% of residents speak Asian or Pacific Island language at home (64% very well, 23% well, 11% not well, 2% not at all).
2.9% of residents speak other language at home (79% very well, 19% well, 3% not well).
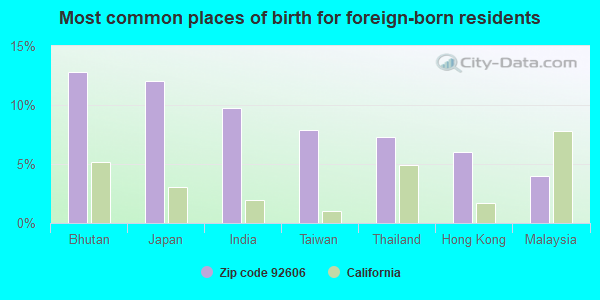
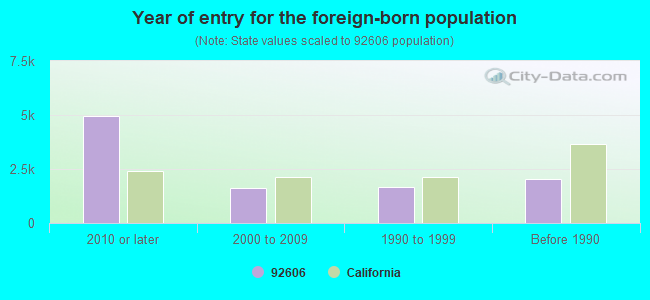
Foreign born population: 9,381 (38.7%) (52.5% of them are naturalized citizens)
Major facilities with environmental interests located in this zip code:
KAISER ROLLMET (1822 DEERE AVENUE in IRVINE, CA)
STATE MASTER (California - Hazardous Waste Tracking) - HAZARDOU WASTE PROGRAM National Pollutant Discharge Elimination System NON-MAJOR (Tracking pollutant discharge elimination systems) - permit HAZARDOUS WASTE BIENNIAL REPORTER (Resource Conservation and Recovery Act (tracking hazardous waste)) Large Quantity Generators, more that 1000 kg of hazardous waste/month (Resource Conservation and Recovery Act (tracking hazardous waste)) TRI REPORTER (Tracking of toxic chemicals releasing facilities) Business SIC classification: GUIDED MISSILES AND SPACE VEHICLES Organizations: ROCKWELL COLLINS (CONTACT/OPERATOR)
Alternative names: KAISER-ROLLMET DIVISION, ROLLMET INC
JACUZZI WHIRLPOOL BATH (1922 BARRANCA PARKWAY in IRVINE, CA)
STATE MASTER (California - Hazardous Waste Tracking) - HAZARDOU WASTE PROGRAM CRITERIA AND HAZARDOUS AIR POLLUTANT INVENTORY (Inventory of air pollution sources) HAZARDOUS WASTE BIENNIAL REPORTER (Resource Conservation and Recovery Act (tracking hazardous waste)) Small Quantity Generators, between 100 kg and 1000 kg of hazardous waste/month (Resource Conservation and Recovery Act (tracking hazardous waste)) TRI REPORTER (Tracking of toxic chemicals releasing facilities) Business SIC classification: PLASTICS PLUMBING FIXTURES Business NAICS classification: ALL OTHER MISCELLANEOUS MANUFACTURING. Organizations: CERADYNE INC (CONTACT/OPERATOR)
, BRISTOL GROUP (CONTACT/OWNER)
Alternative names: JACUZZI WHIRLPOOL BATH (IRVINE)
LAIDLAW TRANSIT SERVICES INC (16281 CONSTRUCTION CIRCLE WEST in IRVINE, CA)
STATE MASTER (California - Hazardous Waste Tracking) - HAZARDOU WASTE PROGRAM Large Quantity Generators, more that 1000 kg of hazardous waste/month (Resource Conservation and Recovery Act (tracking hazardous waste)) - notification Alternative names: LAIDLAW-GAS RECOVERY SYS
BACON INDUSTRIES INCORPORATED OF CA (16731 HALE AVE. in IRVINE, CA)
STATE MASTER (California - Hazardous Waste Tracking) - HAZARDOU WASTE PROGRAM Small Quantity Generators, between 100 kg and 1000 kg of hazardous waste/month (Resource Conservation and Recovery Act (tracking hazardous waste)) TRI REPORTER (Tracking of toxic chemicals releasing facilities) Business SIC classification: ADHESIVES AND SEALANTS
NEWPORT CORPORATION (1791 DEERE AVENUE in IRVINE, CA)
STATE MASTER (California - Hazardous Waste Tracking) - HAZARDOU WASTE PROGRAM Small Quantity Generators, between 100 kg and 1000 kg of hazardous waste/month (Resource Conservation and Recovery Act (tracking hazardous waste)) - notification TRI REPORTER (Tracking of toxic chemicals releasing facilities) Business SIC classification: LABORATORY ANALYTICAL INSTRUMENTS Business NAICS classification: LABORATORY APPARATUS AND FURNITURE MANUFACTURING.
CALIFORNIA PORTLAND CEMENT CO (16282 CONSTRUCTION CIRCLE WEST in IRVINE, CA) . Federal Facility
STATE MASTER (California - Hazardous Waste Tracking) - HAZARDOU WASTE PROGRAM Small Quantity Generators, between 100 kg and 1000 kg of hazardous waste/month (Resource Conservation and Recovery Act (tracking hazardous waste)) - notification Alternative names: CATALINA PACIFIC CONCRETE
CHEVRON STATION NO 201095 (80 CORPORATE PARK in IRVINE, CA)
STATE MASTER (California - Hazardous Waste Tracking) - HAZARDOU WASTE PROGRAM Small Quantity Generators, between 100 kg and 1000 kg of hazardous waste/month (Resource Conservation and Recovery Act (tracking hazardous waste)) - notification Organizations: CHEVRON PRODUCTS CO (CONTACT/OWNER)
Alternative names: CHEVRON 201095, CHEVRON STATION 201095
ENTHONE INC. (16782 VON KARMAN AVENUE in IRVINE, CA)
CRITERIA AND HAZARDOUS AIR POLLUTANT INVENTORY (Inventory of air pollution sources) HAZARDOUS WASTE BIENNIAL REPORTER (Resource Conservation and Recovery Act (tracking hazardous waste)) Large Quantity Generators, more that 1000 kg of hazardous waste/month (Resource Conservation and Recovery Act (tracking hazardous waste)) - notification TRI REPORTER (Tracking of toxic chemicals releasing facilities) Business SIC classification: INDUSTRIAL INORGANIC CHEMICALS; INDUSTRIAL ORGANIC CHEMICALS Business NAICS classification: ALL OTHER BASIC INORGANIC CHEMICAL MANUFACTURING.; ALL OTHER BASIC ORGANIC CHEMICAL MANUFACTURING. Organizations: COOKSON AMERICA (CONTACT/OPERATOR)
Alternative names: ALPHA METALS INC.
ADT 7 (96 CORPORATE PARK in IRVINE, CA)
(Integrated Compliance Information System) - ICIS-HQ-2002-6000, FORMAL ENFORCEMENT ACTION
AMERICAN ZETTLER INC (16881 HALE AVE in IRVINE, CA)
MALLINCKRODT MEDICAL T P I INCORPORATED (1595 DEERE AVENUE BACK OF BLDG in IRVINE, CA)
(Resource Conservation and Recovery Act (tracking hazardous waste)) Organizations: MALLINCKRODT MED T P I INC (CONTACT/OWNER)
GRO MOR DIVERS FIED INC (2491 DU BRIDGE AVE in IRVINE, CA)
Small Quantity Generators, between 100 kg and 1000 kg of hazardous waste/month (Resource Conservation and Recovery Act (tracking hazardous waste)) - notification Organizations: WESTPHAL RUTH (CONTACT/OWNER)
NEWPORT PRECISION OPTICS INC (1931 DEERE AVE in IRVINE, CA)
Small Quantity Generators, between 100 kg and 1000 kg of hazardous waste/month (Resource Conservation and Recovery Act (tracking hazardous waste)) - notification Business NAICS classification: BOAT BUILDING. Organizations: ERICSON YACHTS INC (CONTACT/OPERATOR)
, NEWPORT CORP (CONTACT/OWNER)
Alternative names: VISION SPORTS HOLDING CORP
Housing units lacking complete kitchen facilities: 1.8%
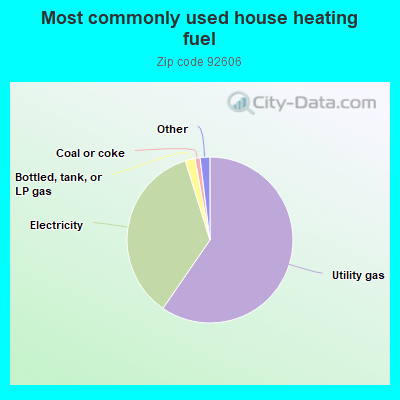
59.6%Utility gas
35.6%Electricity
1.9%Bottled, tank, or LP gas
1.0%Coal or coke
1.0%No fuel used
0.9%Solar energy
Place of birth for U.S.-born residents:
This state: 10,934
Northeast: 778
Midwest: 937
South: 474
West: 1,281
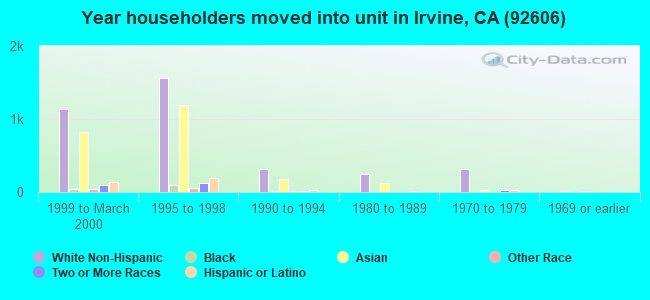
31% of the 92606 zip code residents lived in the same house 5 years ago. Out of people who lived in different houses, 62% lived in this county. Out of people who lived in different counties, 50% lived in California.
84% of the 92606 zip code residents lived in the same house 1 year ago. Out of people who lived in different houses, 56% moved from this county. Out of people who lived in different houses, 20% moved from different county within same state. Out of people who lived in different houses, 8% moved from different state. Out of people who lived in different houses, 15% moved from abroad.
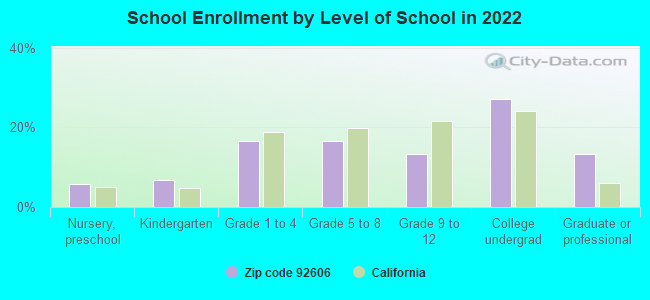
Private vs. public school enrollment:
Students in private schools in grades 1 to 8 (elementary and middle school): 41
Here:
1.9%
California:
10.5%
Students in private schools in grades 9 to 12 (high school): 37
Here:
4.2%
California:
8.5%
Students in private undergraduate colleges: 276
Here:
15.3%
California:
15.9%
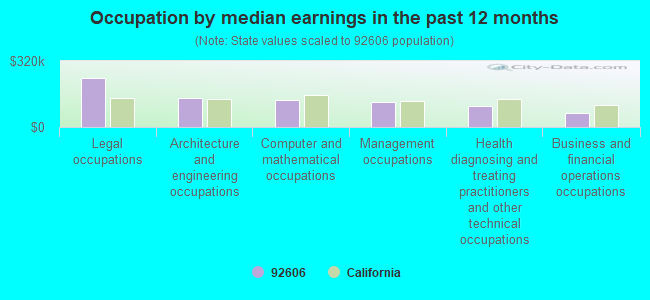
Occupation by median earnings in the past 12 months ($)
237,352Legal occupations
139,149Architecture and engineering occupations
129,372Computer and mathematical occupations
121,538Management occupations
99,585Health diagnosing and treating practitioners and other technical occupations
69,909Business and financial operations occupations
Companies with biggest federal contracts located in this zip code (IRVINE, CA):
MEGGITT WESTERN DESIGN INC (16952 MILLIKAN AVE; small business) : $39,834,547 in 285 contractsfrom 1999 to 2006
Contracts for Miscellaneous Weapons, Miscellaneous Materials Handling Equipment, Guns, through 30 mm, Fire Control Designating and Indicating Equipment, and moreby U.S. Special Operations Command, Army, Defense Logistics Agency, Department of Defense, and others Signed by year:2000: $5,328,998; 2001: $2,962,162; 2002: $3,579,119; 2003: $7,789,970; 2004: $7,283,697; 2005: $9,679,516; 2006: $3,133,922.
Biggest contracts:
$3,695,600 with U.S. Special Operations Command for Miscellaneous Weapons. Signed on 2004-09-24. Completion date: 2005-10-31.
$3,000,000 with Army for Miscellaneous Materials Handling Equipment. Signed on 2003-04-01. Completion date: 2005-09-30.
$1,299,169 with Army for Guns, through 30 mm. Signed on 2005-11-10. Completion date: 2007-04-30.
$1,299,169, same as above.Signed on 2005-03-24. Completion date: 2007-04-30.
PARKER HANNIFIN CORPORATION (16666 VON KARMAN AVE) : $38,318,332 in 152 contractsfrom 1999 to 2006
Contracts for Aircraft Hydraulic, Vacuum, and De-icing System Components, Hose, Pipe, Tube, Lubrication, and Railing Fittings, Power and Hand Pumps, Engine Fuel System Components, Nonaircraft, and moreby Army, Air Force, Navy Signed by year:2000: $10,092,933; 2001: $8,600,779; 2002: $15,395,539; 2003: $0; 2004: $406,639; 2005: $2,023,612; 2006: -$12,949.
Biggest contracts:
$5,251,676 with Army for Aircraft Hydraulic, Vacuum, and De-icing System Components. Signed on 2002-05-24. Completion date: 2004-08-30.
$2,109,000, same as above.Signed on 2002-09-29. Completion date: 2004-05-31.
$1,931,381 with Army for Hose, Pipe, Tube, Lubrication, and Railing Fittings. Signed on 2002-04-29. Completion date: 2004-01-30.
$1,646,128 with Army for Aircraft Hydraulic, Vacuum, and De-icing System Components. Signed on 2000-08-08. Completion date: 2001-05-31.
ROGERSON ATS (2201 ALTON PKWY; small business) : $3,925,135 in 101 contractsfrom 2000 to 2006
Contracts for Airframe Structural Components, Relays and Solenoids, Valves, Nonpowered, Valves, Powered, and moreby Defense Logistics Agency, Air Force Signed by year:2000: $190,291; 2001: $657,703; 2002: $529,296; 2003: $324,094; 2004: $434,449; 2005: $1,041,083; 2006: $748,219.
Biggest contracts:
$152,208 with Defense Logistics Agency for Airframe Structural Components. Signed on 2005-06-08. Completion date: 2006-03-01.
$139,788 with Defense Logistics Agency for Relays and Solenoids. Signed on 2006-01-11. Completion date: 2006-05-22.
$123,730 with Defense Logistics Agency for Airframe Structural Components. Signed on 2006-05-31. Completion date: 2006-11-27.
$111,437 with Defense Logistics Agency for Relays and Solenoids. Signed on 2000-10-10. Completion date: 2001-03-09.
POWER ENGINEERING INC (16632 MILLIKAN AVE; small business) : $3,913,643 in 79 contractsfrom 2000 to 2006
Contracts for Technical Representation Services -- Bearings, Systems Engineering Services, Specifications Development Services, Other Special Studies and Analyses, and moreby Army, U.S. Army Corps of Engineers - civil program financing only, Air Force Signed by year:2000: $50,000; 2001: $80,746; 2002: $796,308; 2003: $370,786; 2004: $961,789; 2005: $1,043,732; 2006: $610,282.
Biggest contracts:
$283,400 with Army for Technical Representation Services -- Bearings. Taking place in GA. Signed on 2006-01-13. Completion date: 2006-03-30.
$259,600, same as above.Signed on 2005-07-21. Completion date: 2005-09-30.
$250,000 with U.S. Army Corps of Engineers - civil program financing only for Systems Engineering Services. Taking place in GA. Signed on 2002-10-11. Completion date: 2003-09-09.
$216,451 with U.S. Army Corps of Engineers - civil program financing only for Technical Representation Services -- Bearings. Taking place in GA. Signed on 2004-08-13. Completion date: 2004-09-30.
APOLLO INSTRUMENTS INC (55 PETERS CANYON RD; small business) : $2,732,693 in 19 contractsfrom 2000 to 2006
Contracts for Other Defense -- Basic Research (R&D), Defense Missile and Space Systems -- Basic Research (R&D), Other Defense -- Management and Support (R&D), Defense Missile and Space Systems -- Applied Research and Exploratory Development (R&D), and moreby Air Force, NASA Signed by year:2000: $418,846; 2001: $595,401; 2002: $598,686; 2003: $458,400; 2004: $374,952; 2005: $278,268; 2006: $8,140.
Biggest contracts:
$450,000 with Air Force for Other Defense -- Basic Research (R&D). Signed on 2001-02-27. Completion date: 2003-06-03.
$375,000 with Air Force for Defense Missile and Space Systems -- Basic Research (R&D). Signed on 2003-08-18. Completion date: 2005-05-20.
$374,952, same as above.Signed on 2004-05-28. Completion date: 2005-05-20.
$318,979 with Air Force for Other Defense -- Management and Support (R&D). Signed on 2000-06-27. Completion date: 2001-08-25.
N H RESEARCH INCORPORATED (16601 HALE AVE; small business) : $1,678,508 in 53 contractsfrom 1999 to 2006
Contracts for Converters, Electrical, Nonrotating, Electrical and Electronic assemblies, Boards, Cards, and Associated Hardware, Electrical and Electronic Properties Measuring and Testing Instruments, Microcircuits, Electronic, and moreby Air Force, Navy, Defense Logistics Agency, Army, and others Signed by year:2000: $343,940; 2001: $158,780; 2002: $0; 2003: $124,068; 2004: $300,669; 2005: $463,745; 2006: $17,555.
Biggest contracts:
$323,350 with Air Force for Converters, Electrical, Nonrotating. Signed on 2005-06-21. Completion date: 2005-12-31.
$177,859 with Navy for Electrical and Electronic assemblies, Boards, Cards, and Associated Hardware. Signed on 1999-11-30. Completion date: 2000-04-10.
$160,330 with Navy for Electrical and Electronic Properties Measuring and Testing Instruments. Signed on 2000-05-11. Completion date: 2000-10-13.
$154,660 with Navy for Electrical and Electronic assemblies, Boards, Cards, and Associated Hardware. Signed on 2000-08-17. Completion date: 2001-03-05.
CARDIAC SCIENCE, INC (16931 MILLIKAN AVENUE; small business) : $1,594,350 in 64 contractsfrom 2001 to 2005
Contracts for Hospital Furniture, Equipment, Utensils, and Supplies, Medical and Surgical Instruments, Equipment, and Supplies, Non-nuclear Ship Repair (East) Ship repair (including overhauls and conversions) performed on non-nuclear propelled and nonpropelled ships east of the 108th meridian by Department of Veterans Affairs, Army, U.S. Army Corps of Engineers - civil program financing only, Navy, and others Signed by year:2000: $0; 2001: $181,676; 2002: $482,384; 2003: $321,612; 2004: $552,473; 2005: $56,205; 2006: $0.
Biggest contracts:
$142,000 with Department of Veterans Affairs for Hospital Furniture, Equipment, Utensils, and Supplies. Taking place in MN. Signed on 2002-02-15. Completion date: 2002-03-15.
$124,620 with Army for Medical and Surgical Instruments, Equipment, and Supplies. Taking place in AL. Signed on 2004-06-07. Completion date: 2004-06-30.
$124,620 with U.S. Army Corps of Engineers - civil program financing only for Medical and Surgical Instruments, Equipment, and Supplies. Taking place in AL. Signed on 2004-06-07. Completion date: 2004-06-30.
$77,219 with Navy for Hospital Furniture, Equipment, Utensils, and Supplies. Signed on 2003-08-11. Completion date: 2003-08-12.
PRUDENTIAL OVERALL SUPPLY (1661 ALTON PKWY) : $1,391,303 in 40 contractsfrom 2000 to 2006
Contracts for Laundry and DryCleaning Services, Other Professional Services, Household and Commercial Utility Containers, Other Housekeeping Services, and moreby Defense Commissary Agency, Department of Defense, Army, Navy, and others Signed by year:2000: $144,104; 2001: $288,838; 2002: $343,793; 2003: $171,161; 2004: $136,147; 2005: $305,405; 2006: $1,855.
Biggest contracts:
$183,957 with Defense Commissary Agency for Laundry and DryCleaning Services. Signed on 2005-09-14. Completion date: 2005-10-31.
$152,000 with Department of Defense for Laundry and DryCleaning Services. Signed on 2002-02-14. Completion date: 2003-06-30.
$126,255 with Defense Commissary Agency for Laundry and DryCleaning Services. Signed on 2005-01-13. Completion date: 2005-10-31.
$125,280 with Department of Defense for Laundry and DryCleaning Services. Signed on 2003-09-29. Completion date: 2004-10-31.
DRS NYTECH IMAGING SYSTEMS, IN (14440 MYFORD RD) : $1,098,884 in 7 contractsfrom 2003 to 2004
Contracts for Defense Electronics and Communication Equipment -- Basic Research (R&D), Other Research and Development -- Basic Research (R&D), Optical Sighting and Ranging Equipment by Army, Navy Signed by year:2000: $0; 2001: $0; 2002: $0; 2003: $699,200; 2004: $399,684; 2005: $0; 2006: $0.
Biggest contracts:
$399,684 with Army for Defense Electronics and Communication Equipment -- Basic Research (R&D). Signed on 2004-03-23. Completion date: 2001-01-30.
$300,000 with Army for Other Research and Development -- Basic Research (R&D). Signed on 2003-04-16. Completion date: 2004-08-30.
$201,200 with Army for Defense Electronics and Communication Equipment -- Basic Research (R&D). Signed on 2003-12-15. Completion date: 2004-08-30.
$125,000 with Army for Other Research and Development -- Basic Research (R&D). Signed on 2003-05-28. Completion date: 2004-05-31.
FPL AND ASSOCIATESINC (10 CORPORATE PARK STE 310; small business) : $986,314 in 23 contractsfrom 2000 to 2004
Contracts for Other Architect and Engineering Services, Architect - Engineer Services (including landscaping, interior layout, and designing) by Air Force Signed by year:2000: $54,520; 2001: $101,364; 2002: $127,258; 2003: $440,267; 2004: $262,905; 2005: $0; 2006: $0.
Biggest contracts:
$116,717 with Air Force for Other Architect and Engineering Services. Signed on 2002-03-29. Completion date: 2003-02-09.
$99,509 with Air Force for Architect - Engineer Services (including landscaping, interior layout, and designing). Signed on 2003-04-24. Completion date: 2003-06-16.
$96,720 with Air Force for Other Architect and Engineering Services. Signed on 2001-02-01. Completion date: 2001-09-12.
$80,437 with Air Force for Architect - Engineer Services (including landscaping, interior layout, and designing). Signed on 2004-02-27. Completion date: 2004-05-28.
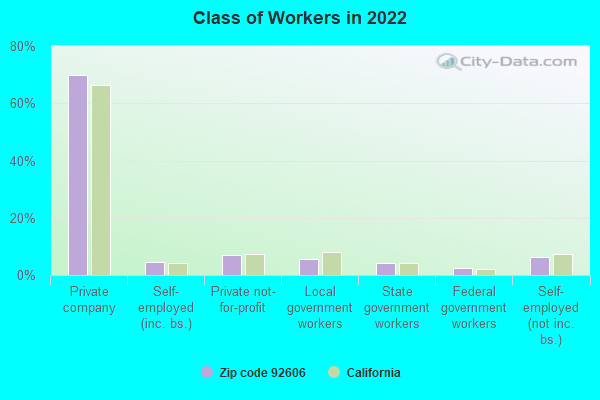
Top industries in this zip code by the number of employees in 2005:
Administrative and Support and Waste Management and Remediation Services: Temporary Help Services (500-999 employees: 1 establishment, 100-249 employees: 1 establishment, 50-99 employees: 1 establishment, 10-19 employees: 2 establishments, 5-9 employees: 2 establishments)
Finance and Insurance: Real Estate Credit (500-999: 1, 20-49: 1, 10-19: 5, 5-9: 1, 1-4: 11)
Construction: Commercial and Institutional Building Construction (250-499: 1, 100-249: 1, 20-49: 3, 1-4: 2)


 Nearest zip codes: 92614, 92780, 92604, 92707, 92612, 92782.