Estimated zip code population in 2022: 29,590 Zip code population in 2010: 23,032 Zip code population in 2000: 17,485
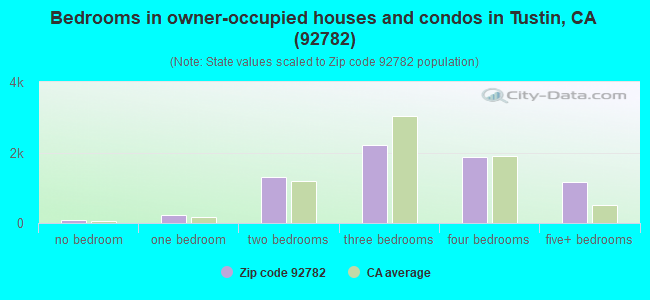
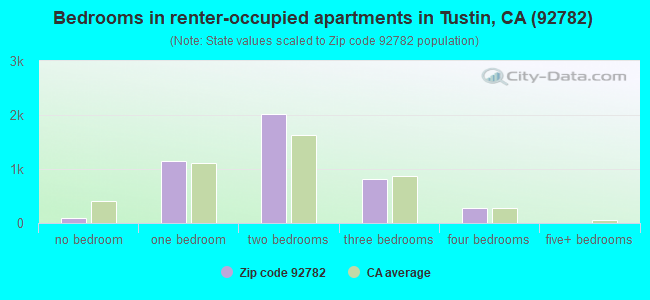
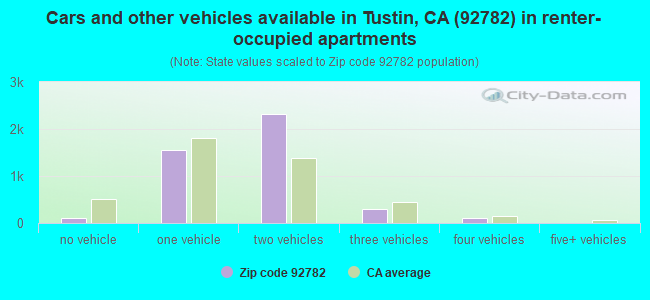
Houses and condos: 11,584 Renter-occupied apartments: 4,401
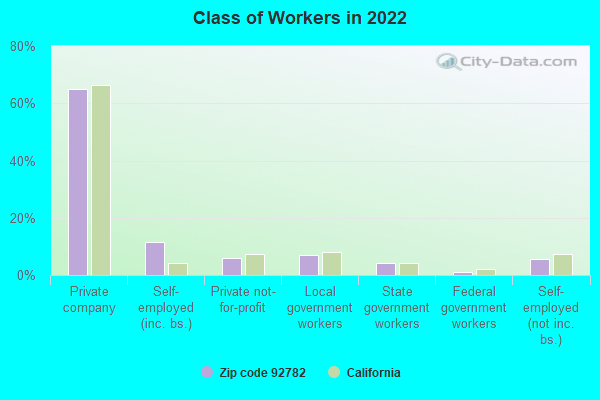
% of renters here:
39%
State:
44%
March 2022 cost of living index in zip code 92782: 87.7 (less than average, U.S. average is 100)
Land area: 3.4 sq. mi. Water area: 0.0 sq. mi.
Population density: 8,799 people per square mile
(high).
OSM Map
General Map
Google Map
MSN Map
OSM Map
General Map
Google Map
MSN Map
OSM Map
General Map
Google Map
MSN Map
OSM Map
General Map
Google Map
MSN Map
Please wait while loading the map...
Real estate property taxes paid for housing units in 2022:
This zip code:
0.9% ($9,445)
California:
0.7% ($4,831)
Median real estate property taxes paid for housing units with mortgages in 2022: $9,951 (1.0%) Median real estate property taxes paid for housing units with no mortgage in 2022: $8,560 (0.7%)
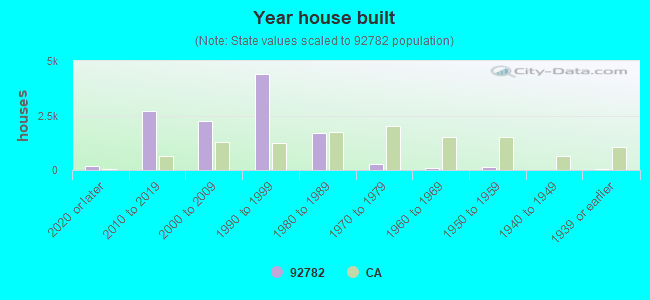
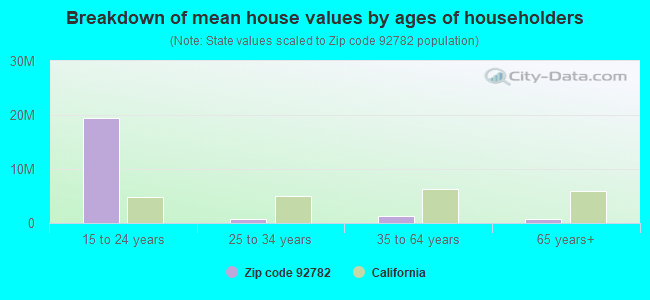
Estimated median house/condo value in 2022: $1,098,119
92782:
$1,098,119
California:
$715,900
According to our research of California and other state lists, there were 5 registered sex offenders living in 92782 zip code as of May 07, 2024. The ratio of all residents to sex offenders in zip code 92782 is 4,701 to 1. The ratio of registered sex offenders to all residents in this zip code is much lower than the state average.
Median resident age:
This zip code:
40.2 years
California median age:
37.9 years
Average household size:
This zip code:
2.6 people
California:
2.8 people
Averages for the 2020 tax year for zip code 92782, filed in 2021:
Average Adjusted Gross Income (AGI) in 2020: $141,345 (Individual Income Tax Returns)
Here:
$141,345
State:
$95,910
Salary/wage: $112,837 (reported on 83.3% of returns)
Here:
$112,837
State:
$77,331
(% of AGI for various income ranges: 1202.7% for AGIs below $25k, 3960.4% for AGIs $25k-50k, 7746.2% for AGIs $50k-75k, 11340.8% for AGIs $75k-100k, 22929.6% for AGIs $100k-200k, 100999.3% for AGIs over 200k)
Taxable interest for individuals: $2,695 (reported on 48.3% of returns)
This zip code:
$2,695
California:
$2,294
(% of AGI for various income ranges: 42.3% for AGIs below $25k, 56.7% for AGIs $25k-50k, 78.8% for AGIs $50k-75k, 111.0% for AGIs $75k-100k, 190.7% for AGIs $100k-200k, 1702.1% for AGIs over 200k)
Ordinary dividends: $7,984 (reported on 35.1% of returns)
Here:
$7,984
State:
$10,949
(% of AGI for various income ranges: 43.1% for AGIs below $25k, 72.8% for AGIs $25k-50k, 134.9% for AGIs $50k-75k, 208.4% for AGIs $75k-100k, 345.4% for AGIs $100k-200k, 4130.4% for AGIs over 200k)
Net capital gain/loss in AGI: +$31,862 (reported on 35.7% of returns)
Here:
+$31,862
State:
+$49,306
(% of AGI for various income ranges: 38.5% for AGIs below $25k, 93.9% for AGIs $25k-50k, 139.8% for AGIs $50k-75k, 383.4% for AGIs $75k-100k, 820.7% for AGIs $100k-200k, 19994.0% for AGIs over 200k)
Profit/loss from business: +$20,969 (reported on 20.8% of returns)
Here:
+$20,969
State:
+$15,671
(% of AGI for various income ranges: 177.4% for AGIs below $25k, 318.8% for AGIs $25k-50k, 365.2% for AGIs $50k-75k, 271.7% for AGIs $75k-100k, 683.7% for AGIs $100k-200k, 5193.9% for AGIs over 200k)
Taxable individual retirement arrangement distribution: $27,924 (reported on 7.0% of returns)
92782:
$27,924
California:
$23,505
(% of AGI for various income ranges: 59.0% for AGIs below $25k, 116.8% for AGIs $25k-50k, 188.8% for AGIs $50k-75k, 310.2% for AGIs $75k-100k, 558.1% for AGIs $100k-200k, 1624.9% for AGIs over 200k)
Self-employed (Keogh) retirement plans: $34,742 (reported on 1.9% of returns)
92782:
$34,742
California:
$30,163
(% of AGI for various income ranges: 31.0% for AGIs $50k-75k, 54.3% for AGIs $100k-200k, 1122.1% for AGIs over 200k)
Total itemized deductions: $38,556 (reported on 25.9% of returns)
Here:
$38,556
State:
$39,517
(% of AGI for various income ranges: 157.4% for AGIs below $25k, 310.1% for AGIs $25k-50k, 638.7% for AGIs $50k-75k, 1131.2% for AGIs $75k-100k, 2437.3% for AGIs $100k-200k, 11254.0% for AGIs over 200k)
Charity contributions: $12,290 (reported on 22.1% of returns)
Here:
$12,290
State:
$12,598
(% of AGI for various income ranges: 7.3% for AGIs below $25k, 21.7% for AGIs $25k-50k, 63.6% for AGIs $50k-75k, 146.9% for AGIs $75k-100k, 419.2% for AGIs $100k-200k, 4187.6% for AGIs over 200k)
Taxes paid: $9,386 (reported on 25.8% of returns)
92782:
$9,386
State:
$8,807
(% of AGI for various income ranges: 37.6% for AGIs below $25k, 89.2% for AGIs $25k-50k, 180.6% for AGIs $50k-75k, 371.6% for AGIs $75k-100k, 751.2% for AGIs $100k-200k, 2201.6% for AGIs over 200k)
Earned income credit: $1,682 (reported on 7.2% of returns)
Here:
$1,682
State:
$2,074
(% of AGI for various income ranges: 50.7% for AGIs below $25k, 51.4% for AGIs $25k-50k)
Percentage of individuals using paid preparers for their 2020 taxes: 92.9%
Here:
93%
State:
92%
(% for various income ranges: 89.8% for AGIs below $25k, 93.4% for AGIs $25k-50k, 92.5% for AGIs $50k-75k, 94.2% for AGIs $75k-100k, 94.1% for AGIs $100k-200k, 94.8% for AGIs over 200k)
Averages for the 2012 tax year for zip code 92782, filed in 2013:
Average Adjusted Gross Income (AGI) in 2012: $119,420 (Individual Income Tax Returns)
Here:
$119,420
State:
$72,726
Salary/wage: $98,642 (reported on 85.7% of returns)
Here:
$98,642
State:
$59,079
(% of AGI for various income ranges: 73.9% for AGIs below $25k, 80.3% for AGIs $25k-50k, 84.1% for AGIs $50k-75k, 83.4% for AGIs $75k-100k, 84.4% for AGIs $100k-200k, 58.4% for AGIs over 200k)
Taxable interest for individuals: $2,423 (reported on 53.6% of returns)
This zip code:
$2,423
California:
$2,146
(% of AGI for various income ranges: 2.3% for AGIs below $25k, 1.0% for AGIs $25k-50k, 0.6% for AGIs $50k-75k, 0.7% for AGIs $75k-100k, 0.7% for AGIs $100k-200k, 1.4% for AGIs over 200k)
Ordinary dividends: $5,869 (reported on 31.8% of returns)
Here:
$5,869
State:
$9,308
(% of AGI for various income ranges: 3.2% for AGIs below $25k, 0.9% for AGIs $25k-50k, 1.1% for AGIs $50k-75k, 1.4% for AGIs $75k-100k, 1.1% for AGIs $100k-200k, 1.9% for AGIs over 200k)
Net capital gain/loss in AGI: +$17,973 (reported on 29.1% of returns)
Here:
+$17,973
State:
+$30,460
(% of AGI for various income ranges: 0.4% for AGIs $75k-100k, 0.6% for AGIs $100k-200k, 8.3% for AGIs over 200k)
Profit/loss from business: +$24,005 (reported on 21.0% of returns)
Here:
+$24,005
State:
+$17,064
(% of AGI for various income ranges: 14.5% for AGIs below $25k, 6.9% for AGIs $25k-50k, 4.4% for AGIs $50k-75k, 4.2% for AGIs $75k-100k, 3.9% for AGIs $100k-200k, 3.7% for AGIs over 200k)
Taxable individual retirement arrangement distribution: $22,364 (reported on 7.9% of returns)
92782:
$22,364
California:
$19,557
(% of AGI for various income ranges: 2.8% for AGIs below $25k, 2.3% for AGIs $25k-50k, 2.0% for AGIs $50k-75k, 2.0% for AGIs $75k-100k, 1.7% for AGIs $100k-200k, 1.0% for AGIs over 200k)
Self-employment retirement plans: $26,633 (reported on 2.4% of returns)
92782:
$26,633
California:
$24,530
(% of AGI for various income ranges: 0.5% for AGIs $50k-75k, 0.3% for AGIs $100k-200k, 0.8% for AGIs over 200k)
Total itemized deductions: $42,585 (24% of AGI, reported on 57.4% of returns)
Here:
$42,585
State:
$34,004
Here:
23.6% of AGI
State:
22.7% of AGI
(% of AGI for various income ranges: 20.0% for AGIs below $25k, 16.3% for AGIs $25k-50k, 19.2% for AGIs $50k-75k, 20.7% for AGIs $75k-100k, 22.5% for AGIs $100k-200k, 19.9% for AGIs over 200k)
Charity contributions: $5,517 (reported on 49.3% of returns)
Here:
$5,517
State:
$4,659
(% of AGI for various income ranges: 0.9% for AGIs below $25k, 1.3% for AGIs $25k-50k, 1.6% for AGIs $50k-75k, 1.9% for AGIs $75k-100k, 2.1% for AGIs $100k-200k, 2.7% for AGIs over 200k)
Taxes paid: $19,626 (reported on 57.4% of returns)
92782:
$19,626
State:
$14,448
(% of AGI for various income ranges: 5.0% for AGIs below $25k, 4.7% for AGIs $25k-50k, 6.4% for AGIs $50k-75k, 7.7% for AGIs $75k-100k, 9.6% for AGIs $100k-200k, 10.8% for AGIs over 200k)
Earned income credit: $1,865 (reported on 7.6% of returns)
Here:
$1,865
State:
$2,286
(% of AGI for various income ranges: 4.1% for AGIs below $25k, 0.7% for AGIs $25k-50k)
Percentage of individuals using paid preparers for their 2012 taxes: 61.9%
Here:
62%
State:
64%
(% for various income ranges: 56.9% for AGIs below $25k, 59.7% for AGIs $25k-50k, 59.6% for AGIs $50k-75k, 62.8% for AGIs $75k-100k, 62.7% for AGIs $100k-200k, 73.2% for AGIs over 200k)
Averages for the 2004 tax year for zip code 92782, filed in 2005:
Average Adjusted Gross Income (AGI) in 2004: $97,728 (Individual Income Tax Returns)
Here:
$97,728
State:
$58,600
Salary/wage: $83,899 (reported on 86.8% of returns)
Here:
$83,899
State:
$49,455
(% of AGI for various income ranges: 73.6% for AGIs $10k-25k, 86.3% for AGIs $25k-50k, 86.2% for AGIs $50k-75k, 86.7% for AGIs $75k-100k, 68.5% for AGIs over 100k)
Taxable interest for individuals: $1,956 (reported on 62.5% of returns)
This zip code:
$1,956
California:
$2,365
(% of AGI for various income ranges: 2.9% for AGIs $10k-25k, 1.2% for AGIs $25k-50k, 1.0% for AGIs $50k-75k, 1.0% for AGIs $75k-100k, 1.2% for AGIs over 100k)
Taxable dividends: $2,463 (reported on 37.2% of returns)
Here:
$2,463
State:
$4,746
(% of AGI for various income ranges: 1.8% for AGIs $10k-25k, 0.7% for AGIs $25k-50k, 0.7% for AGIs $50k-75k, 0.7% for AGIs $75k-100k, 1.0% for AGIs over 100k)
Net capital gain/loss: +$12,329 (reported on 35.6% of returns)
Here:
+$12,329
State:
+$23,418
(% of AGI for various income ranges: 0.4% for AGIs $10k-25k, 0.0% for AGIs $25k-50k, -0.0% for AGIs $50k-75k, 1.0% for AGIs $75k-100k, 6.3% for AGIs over 100k)
Profit/loss from business: +$25,564 (reported on 20.9% of returns)
Here:
+$25,564
State:
+$16,826
(% of AGI for various income ranges: 12.2% for AGIs $10k-25k, 7.0% for AGIs $25k-50k, 5.4% for AGIs $50k-75k, 4.4% for AGIs $75k-100k, 5.2% for AGIs over 100k)
IRA payment deduction: $3,422 (reported on 4.2% of returns)
92782:
$3,422
California:
$3,192
(% of AGI for various income ranges: 0.4% for AGIs $10k-25k, 0.3% for AGIs $25k-50k, 0.2% for AGIs $50k-75k, 0.2% for AGIs $75k-100k, 0.1% for AGIs over 100k)
Self-employed pension: $19,245 (reported on 3.2% of returns)
Here:
$19,245
California:
$17,688
(% of AGI for various income ranges: 0.3% for AGIs $25k-50k, 0.4% for AGIs $50k-75k, 0.4% for AGIs $75k-100k, 0.8% for AGIs over 100k)
Total itemized deductions: $34,047 (24% of AGI, reported on 60.8% of returns)
Here:
$34,047
State:
$28,113
Here:
23.9% of AGI
State:
25.3% of AGI
(% of AGI for various income ranges: 21.2% for AGIs $10k-25k, 19.5% for AGIs $25k-50k, 24.4% for AGIs $50k-75k, 25.1% for AGIs $75k-100k, 20.0% for AGIs over 100k)
Charity contributions deductions: $3,992 (3% of AGI, reported on 55.1% of returns)
Here:
$3,992
State:
$3,923
Here:
2.7% of AGI
State:
3.3% of AGI
(% of AGI for various income ranges: 1.4% for AGIs $10k-25k, 1.9% for AGIs $25k-50k, 2.3% for AGIs $50k-75k, 2.5% for AGIs $75k-100k, 2.2% for AGIs over 100k)
Total tax: $18,917 (reported on 87.0% of returns)
92782:
$18,917
State:
$10,761
(% of AGI for various income ranges: 5.5% for AGIs $10k-25k, 8.3% for AGIs $25k-50k, 10.4% for AGIs $50k-75k, 11.1% for AGIs $75k-100k, 19.8% for AGIs over 100k)
Earned income credit: $1,286 (reported on 5.0% of returns)
Here:
$1,286
State:
$1,763
Percentage of individuals using paid preparers for their 2004 taxes: 63.0%
Here:
63%
State:
66%
(% for various income ranges: 55.5% for AGIs below $10k, 57.2% for AGIs $10k-25k, 60.1% for AGIs $25k-50k, 61.7% for AGIs $50k-75k, 63.5% for AGIs $75k-100k, 71.2% for AGIs over 100k)
Likely homosexual households (counted as self-reported same-sex unmarried-partner households)
Lesbian couples: 0.0% of all households
Gay men: 0.1% of all households
Household received Food Stamps/SNAP in the past 12 months: 274 Household did not receive Food Stamps/SNAP in the past 12 months: 10,714
Women who had a birth in the past 12 months: 524 (496 now married, 25 unmarried) Women who did not have a birth in the past 12 months: 7,412 (3,204 now married, 4,196 unmarried)
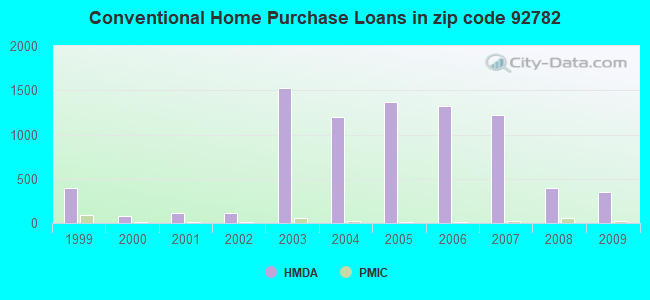
Housing units in zip code 92782 with a mortgage: 4,639 (525 second mortgage, 34 home equity loan, 444 both second mortgage and home equity loan) Houses without a mortgage: 110
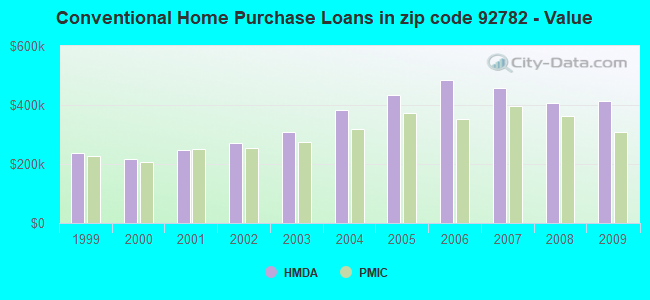
Median monthly owner costs for units with a mortgage: $3,521 Median monthly owner costs for units without a mortgage: $1,285
Residents with income below the poverty level in 2022:
This zip code:
6.7%
Whole state:
12.2%
Residents with income below 50% of the poverty level in 2022:
This zip code:
3.9%
Whole state:
6.2%
Median number of rooms in houses and condos:
Here:
6.1
State:
6.0
Median number of rooms in apartments:
Here:
4.0
State:
3.9
Notable locations in this zip code not listed on our city pages
5,322 married couples with children.
987 single-parent households (581 men, 406 women).
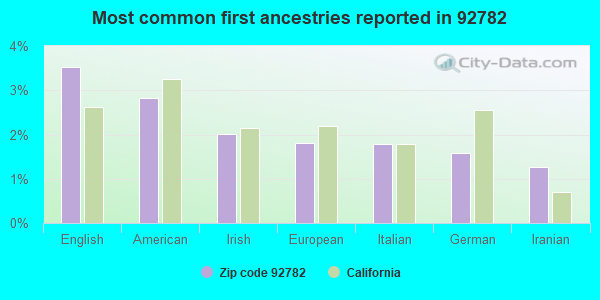
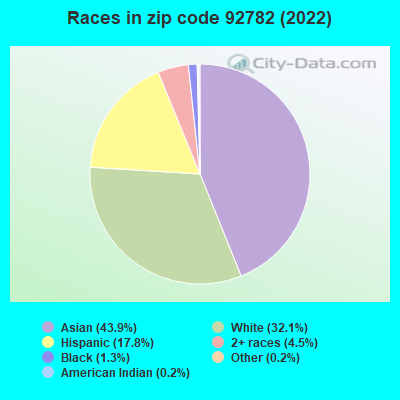
55.4% of residents of 92782 zip code speak English at home.
9.5% of residents speak Spanish at home (77% very well, 15% well, 5% not well, 3% not at all).
9.8% of residents speak other Indo-European language at home (85% very well, 9% well, 6% not well).
24.9% of residents speak Asian or Pacific Island language at home (62% very well, 24% well, 12% not well, 1% not at all).
0.5% of residents speak other language at home (94% very well, 6% well).
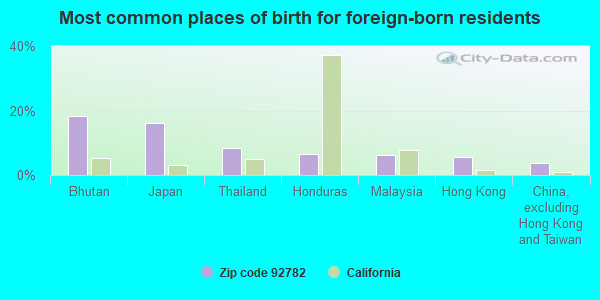
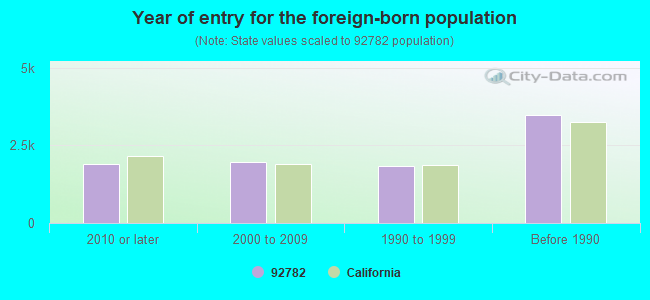
Foreign born population: 8,915 (30.1%) (73.4% of them are naturalized citizens)
Facilities with environmental interests located in this zip code:
MARTINIZING CLEANERS (2530 BRYAN AVE STE C in TUSTIN, CA)
STATE MASTER (California - Hazardous Waste Tracking) - HAZARDOU WASTE PROGRAM Small Quantity Generators, between 100 kg and 1000 kg of hazardous waste/month (Resource Conservation and Recovery Act (tracking hazardous waste)) - notification Organizations: RICHARD R VANARIA (CONTACT/OWNER)
HOME DEPOT USA INC HD 0603 (2782 EL CAMINO REAL in TUSTIN, CA)
Small Quantity Generators, between 100 kg and 1000 kg of hazardous waste/month (Resource Conservation and Recovery Act (tracking hazardous waste))
JOE MACPHERSON MITSUBISHI (5 AUTO CENTER DRIVE in TUSTIN, CA)
CRITERIA AND HAZARDOUS AIR POLLUTANT INVENTORY (Inventory of air pollution sources) Small Quantity Generators, between 100 kg and 1000 kg of hazardous waste/month (Resource Conservation and Recovery Act (tracking hazardous waste)) - notification Business SIC classification: MOTOR VEHICLE DEALERS (NEW AND USED) Alternative names: JOE MAC PHERSON OLDSMOBILE INCORPORATED
MCLEAN CADILLAC (50 AUTO CENTER DR in TUSTIN, CA)
Small Quantity Generators, between 100 kg and 1000 kg of hazardous waste/month (Resource Conservation and Recovery Act (tracking hazardous waste)) - notification Organizations: GARRY WHITE (CONTACT/OPERATOR)
, TUSTIN CARS INC (CONTACT/OWNER)
Alternative names: MCLEAN MOTOR CO
JOE MACPHERSON TOYOTA (44 AUTO CENTER DRIVE in TUSTIN, CA)
Small Quantity Generators, between 100 kg and 1000 kg of hazardous waste/month (Resource Conservation and Recovery Act (tracking hazardous waste)) - notification
MACPHERSON ENTERPRISES (36 AUTO CENTER DR in TUSTIN, CA)
Small Quantity Generators, between 100 kg and 1000 kg of hazardous waste/month (Resource Conservation and Recovery Act (tracking hazardous waste)) - notification Organizations: JOE MACPHERSON (CONTACT/OWNER)
JOE MACPHERSON OLDSMOBILE AUTO (5 AUTO CENTER DRIVE in TUSTIN, CA)
CRITERIA AND HAZARDOUS AIR POLLUTANT INVENTORY (Inventory of air pollution sources) Business SIC classification: TOP, BODY, AND UPHOLSTERY REPAIR SHOPS AND PAINT SHOPS
Housing units lacking complete plumbing facilities: 0.7% Housing units lacking complete kitchen facilities: 0.1%
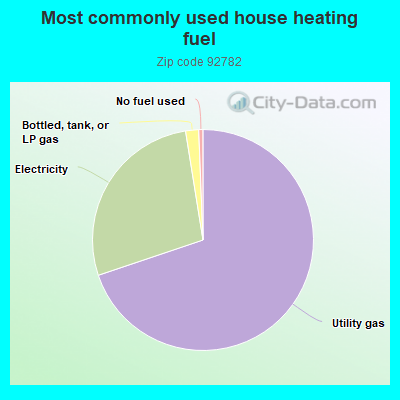
69.2%Utility gas
27.4%Electricity
1.9%Bottled, tank, or LP gas
0.6%No fuel used
Place of birth for U.S.-born residents:
This state: 14,987
Northeast: 1,721
Midwest: 1,461
South: 926
West: 1,237
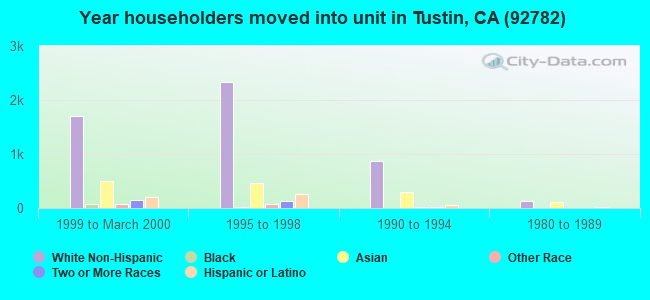
29% of the 92782 zip code residents lived in the same house 5 years ago. Out of people who lived in different houses, 63% lived in this county. Out of people who lived in different counties, 50% lived in California.
89% of the 92782 zip code residents lived in the same house 1 year ago. Out of people who lived in different houses, 61% moved from this county. Out of people who lived in different houses, 23% moved from different county within same state. Out of people who lived in different houses, 6% moved from different state. Out of people who lived in different houses, 9% moved from abroad.
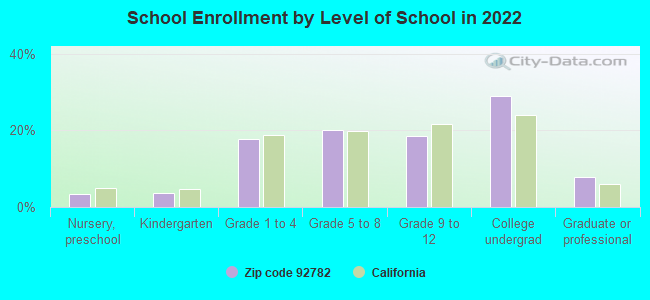
Private vs. public school enrollment:
Students in private schools in grades 1 to 8 (elementary and middle school): 502
Here:
16.4%
California:
10.5%
Students in private schools in grades 9 to 12 (high school): 113
Here:
7.6%
California:
8.5%
Students in private undergraduate colleges: 327
Here:
14.0%
California:
15.9%
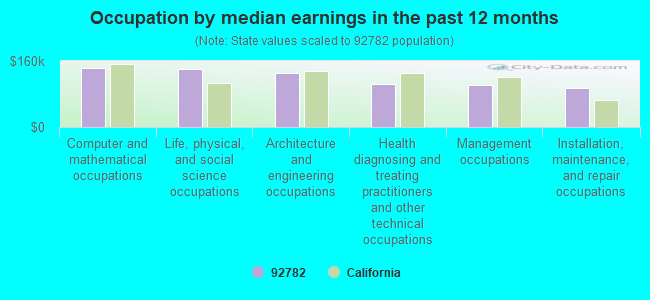
Occupation by median earnings in the past 12 months ($)
142,428Computer and mathematical occupations
139,645Life, physical, and social science occupations
130,296Architecture and engineering occupations
104,769Health diagnosing and treating practitioners and other technical occupations
101,674Management occupations
93,963Installation, maintenance, and repair occupations
Companies with federal contracts located in this zip code (TUSTIN, CA):
TRILOBYTE SALES (2913 EL CAMINO REAL #564; small business) : $172,352 in 6 contractsfrom 2002 to 2004
Contracts for ADP Components, ADPE System Configuration, Other ADP and Telecommunications Services (includes data storage on tapes, compact disks, etc.) by Army, Department of Defense Signed by year:2000: $0; 2001: $0; 2002: $29,214; 2003: $75,238; 2004: $67,900; 2005: $0; 2006: $0.
Biggest contracts:
$59,952 with Army for ADP Components. Taking place in VA. Signed on 2004-05-12. Completion date: 2005-05-26.
$36,788 with Army for ADP Components. Signed on 2003-07-23. Completion date: 2003-08-22.
$29,214 with Department of Defense for ADPE System Configuration. Signed on 2002-09-15. Completion date: 2002-09-27.
$28,130 with Army for Other ADP and Telecommunications Services (includes data storage on tapes, compact disks, etc.). Signed on 2003-05-20. Completion date: 2003-10-21.
PAT SANKER (2142 BURNT MILL RD; small business) : $129,800 in 2 contractsin 2005
$80,000 with Navy for Communications Services. Signed on 2005-09-13. Completion date: 2006-09-12.
$49,800, same as above.Signed on 2005-08-24. Completion date: 2005-12-31.
ROCKWELL ENGINEERING AND EQUIP (2913 EL CAMINO REAL, SUITE; small business) : $76,396 in 3 contractsfrom 2004 to 2005
$25,744 with Navy for Water Purification Equipment. Signed on 2005-06-20. Completion date: 2005-08-08.
$25,326 with U.S. Army Corps of Engineers - civil program financing only for Plumbing Fixtures and Accessories. Signed on 2004-08-11. Completion date: 2004-08-09.
$25,326 with Army for Plumbing Fixtures and Accessories. Signed on 2004-08-11. Completion date: 2004-08-09.
LONG AUTOMOTIVE INC (16 AUTO CENTER DR; small business)
$50,000 with Air Force for Passenger Motor Vehicles. Signed on 2003-01-31. Completion date: 2003-02-03.
Top industries in this zip code by the number of employees in 2005:


 Nearest zip codes: 92705, 92780, 92602, 92620, 92604, 92606.