Estimated zip code population in 2022: 54,488 Zip code population in 2010: 57,741 Zip code population in 2000: 55,047
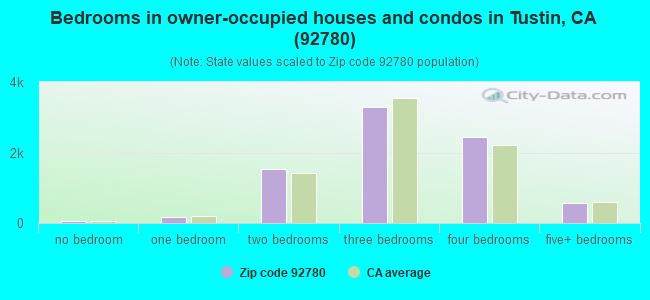
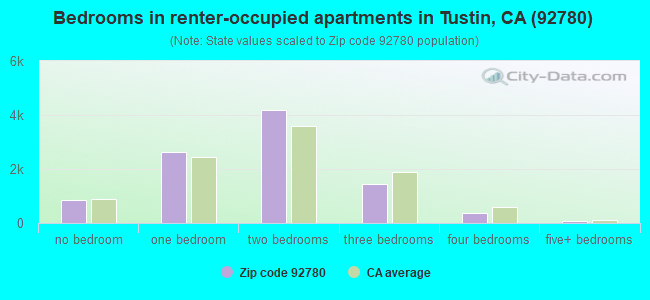
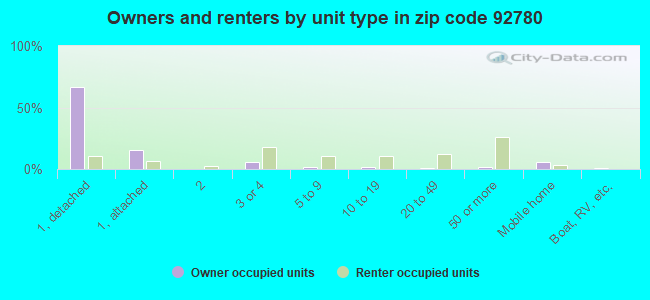
Houses and condos: 18,469 Renter-occupied apartments: 9,564
% of renters here:
54%
State:
44%
March 2022 cost of living index in zip code 92780: 88.1 (less than average, U.S. average is 100)
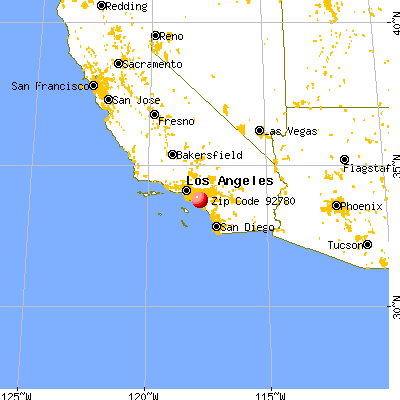
Land area: 7.0 sq. mi. Water area: 0.0 sq. mi.
Population density: 7,791 people per square mile
(high).
OSM Map
General Map
Google Map
MSN Map
OSM Map
General Map
Google Map
MSN Map
OSM Map
General Map
Google Map
MSN Map
OSM Map
General Map
Google Map
MSN Map
Please wait while loading the map...
Real estate property taxes paid for housing units in 2022:
This zip code:
0.5% ($4,731)
California:
0.7% ($4,831)
Median real estate property taxes paid for housing units with mortgages in 2022: $5,321 (0.6%) Median real estate property taxes paid for housing units with no mortgage in 2022: $3,766 (0.5%)
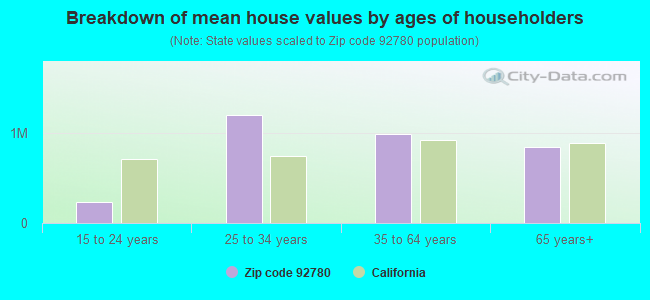
Estimated median house/condo value in 2022: $866,616
92780:
$866,616
California:
$715,900
According to our research of California and other state lists, there were 30 registered sex offenders living in 92780 zip code as of April 27, 2024. The ratio of all residents to sex offenders in zip code 92780 is 2,097 to 1. The ratio of registered sex offenders to all residents in this zip code is much lower than the state average.
Median resident age:
This zip code:
35.7 years
California median age:
37.9 years
Average household size:
This zip code:
3.0 people
California:
2.8 people
Averages for the 2020 tax year for zip code 92780, filed in 2021:
Average Adjusted Gross Income (AGI) in 2020: $64,984 (Individual Income Tax Returns)
Here:
$64,984
State:
$95,910
Salary/wage: $57,873 (reported on 84.7% of returns)
Here:
$57,873
State:
$77,331
(% of AGI for various income ranges: 1337.2% for AGIs below $25k, 4299.7% for AGIs $25k-50k, 7839.1% for AGIs $50k-75k, 11263.6% for AGIs $75k-100k, 21596.3% for AGIs $100k-200k, 77392.8% for AGIs over 200k)
Taxable interest for individuals: $1,397 (reported on 29.2% of returns)
This zip code:
$1,397
California:
$2,294
(% of AGI for various income ranges: 15.0% for AGIs below $25k, 16.3% for AGIs $25k-50k, 35.7% for AGIs $50k-75k, 74.0% for AGIs $75k-100k, 182.0% for AGIs $100k-200k, 1117.5% for AGIs over 200k)
Ordinary dividends: $4,227 (reported on 15.3% of returns)
Here:
$4,227
State:
$10,949
(% of AGI for various income ranges: 18.6% for AGIs below $25k, 21.7% for AGIs $25k-50k, 57.8% for AGIs $50k-75k, 119.9% for AGIs $75k-100k, 296.5% for AGIs $100k-200k, 1845.0% for AGIs over 200k)
Net capital gain/loss in AGI: +$13,376 (reported on 15.5% of returns)
Here:
+$13,376
State:
+$49,306
(% of AGI for various income ranges: 6.5% for AGIs below $25k, 27.4% for AGIs $25k-50k, 66.6% for AGIs $50k-75k, 119.4% for AGIs $75k-100k, 557.1% for AGIs $100k-200k, 10770.8% for AGIs over 200k)
Profit/loss from business: +$10,131 (reported on 18.1% of returns)
Here:
+$10,131
State:
+$15,671
(% of AGI for various income ranges: 220.1% for AGIs below $25k, 169.8% for AGIs $25k-50k, 216.1% for AGIs $50k-75k, 337.5% for AGIs $75k-100k, 480.3% for AGIs $100k-200k, 2637.8% for AGIs over 200k)
Taxable individual retirement arrangement distribution: $18,297 (reported on 5.4% of returns)
92780:
$18,297
California:
$23,505
(% of AGI for various income ranges: 39.8% for AGIs below $25k, 42.9% for AGIs $25k-50k, 121.7% for AGIs $50k-75k, 259.6% for AGIs $75k-100k, 520.8% for AGIs $100k-200k, 1730.8% for AGIs over 200k)
Self-employed (Keogh) retirement plans: $22,086 (reported on 0.5% of returns)
92780:
$22,086
California:
$30,163
(% of AGI for various income ranges: 5.4% for AGIs $25k-50k, 39.3% for AGIs $100k-200k, 524.8% for AGIs over 200k)
Total itemized deductions: $32,106 (reported on 12.6% of returns)
Here:
$32,106
State:
$39,517
(% of AGI for various income ranges: 75.4% for AGIs below $25k, 145.7% for AGIs $25k-50k, 370.1% for AGIs $50k-75k, 885.7% for AGIs $75k-100k, 2502.7% for AGIs $100k-200k, 8735.2% for AGIs over 200k)
Charity contributions: $6,672 (reported on 10.5% of returns)
Here:
$6,672
State:
$12,598
(% of AGI for various income ranges: 4.6% for AGIs below $25k, 15.7% for AGIs $25k-50k, 39.4% for AGIs $50k-75k, 100.0% for AGIs $75k-100k, 403.2% for AGIs $100k-200k, 2249.2% for AGIs over 200k)
Taxes paid: $8,713 (reported on 12.6% of returns)
92780:
$8,713
State:
$8,807
(% of AGI for various income ranges: 13.9% for AGIs below $25k, 32.4% for AGIs $25k-50k, 103.3% for AGIs $50k-75k, 276.7% for AGIs $75k-100k, 750.9% for AGIs $100k-200k, 2096.2% for AGIs over 200k)
Earned income credit: $2,013 (reported on 13.7% of returns)
Here:
$2,013
State:
$2,074
(% of AGI for various income ranges: 77.8% for AGIs below $25k, 59.3% for AGIs $25k-50k, 1.1% for AGIs $50k-75k)
Percentage of individuals using paid preparers for their 2020 taxes: 92.8%
Here:
93%
State:
92%
(% for various income ranges: 91.0% for AGIs below $25k, 93.5% for AGIs $25k-50k, 93.9% for AGIs $50k-75k, 93.3% for AGIs $75k-100k, 93.1% for AGIs $100k-200k, 94.2% for AGIs over 200k)
Averages for the 2012 tax year for zip code 92780, filed in 2013:
Average Adjusted Gross Income (AGI) in 2012: $52,354 (Individual Income Tax Returns)
Here:
$52,354
State:
$72,726
Salary/wage: $46,706 (reported on 85.2% of returns)
Here:
$46,706
State:
$59,079
(% of AGI for various income ranges: 77.7% for AGIs below $25k, 86.0% for AGIs $25k-50k, 82.7% for AGIs $50k-75k, 80.2% for AGIs $75k-100k, 79.1% for AGIs $100k-200k, 51.0% for AGIs over 200k)
Taxable interest for individuals: $1,494 (reported on 29.7% of returns)
This zip code:
$1,494
California:
$2,146
(% of AGI for various income ranges: 0.7% for AGIs below $25k, 0.4% for AGIs $25k-50k, 0.6% for AGIs $50k-75k, 0.6% for AGIs $75k-100k, 0.7% for AGIs $100k-200k, 2.0% for AGIs over 200k)
Ordinary dividends: $4,192 (reported on 13.5% of returns)
Here:
$4,192
State:
$9,308
(% of AGI for various income ranges: 0.8% for AGIs below $25k, 0.5% for AGIs $25k-50k, 0.7% for AGIs $50k-75k, 0.9% for AGIs $75k-100k, 1.1% for AGIs $100k-200k, 2.3% for AGIs over 200k)
Net capital gain/loss in AGI: +$12,633 (reported on 12.3% of returns)
Here:
+$12,633
State:
+$30,460
(% of AGI for various income ranges: 0.1% for AGIs $50k-75k, 0.6% for AGIs $75k-100k, 0.9% for AGIs $100k-200k, 15.0% for AGIs over 200k)
Profit/loss from business: +$12,361 (reported on 17.4% of returns)
Here:
+$12,361
State:
+$17,064
(% of AGI for various income ranges: 11.8% for AGIs below $25k, 4.1% for AGIs $25k-50k, 3.1% for AGIs $50k-75k, 3.0% for AGIs $75k-100k, 2.8% for AGIs $100k-200k, 3.3% for AGIs over 200k)
Taxable individual retirement arrangement distribution: $15,339 (reported on 6.8% of returns)
92780:
$15,339
California:
$19,557
(% of AGI for various income ranges: 1.9% for AGIs below $25k, 1.4% for AGIs $25k-50k, 2.0% for AGIs $50k-75k, 2.2% for AGIs $75k-100k, 2.5% for AGIs $100k-200k, 1.7% for AGIs over 200k)
Self-employment retirement plans: $19,754 (reported on 0.5% of returns)
92780:
$19,754
California:
$24,530
(% of AGI for various income ranges: 0.1% for AGIs $50k-75k, 0.2% for AGIs $100k-200k, 0.7% for AGIs over 200k)
Total itemized deductions: $26,690 (25% of AGI, reported on 29.5% of returns)
Here:
$26,690
State:
$34,004
Here:
25.4% of AGI
State:
22.7% of AGI
(% of AGI for various income ranges: 8.8% for AGIs below $25k, 8.8% for AGIs $25k-50k, 14.4% for AGIs $50k-75k, 17.5% for AGIs $75k-100k, 20.0% for AGIs $100k-200k, 16.7% for AGIs over 200k)
Charity contributions: $3,784 (reported on 24.9% of returns)
Here:
$3,784
State:
$4,659
(% of AGI for various income ranges: 0.7% for AGIs below $25k, 0.9% for AGIs $25k-50k, 1.6% for AGIs $50k-75k, 2.0% for AGIs $75k-100k, 2.2% for AGIs $100k-200k, 3.0% for AGIs over 200k)
Taxes paid: $9,413 (reported on 29.4% of returns)
92780:
$9,413
State:
$14,448
(% of AGI for various income ranges: 2.2% for AGIs below $25k, 1.9% for AGIs $25k-50k, 3.8% for AGIs $50k-75k, 5.5% for AGIs $75k-100k, 7.4% for AGIs $100k-200k, 8.8% for AGIs over 200k)
Earned income credit: $2,272 (reported on 17.2% of returns)
Here:
$2,272
State:
$2,286
(% of AGI for various income ranges: 5.5% for AGIs below $25k, 1.1% for AGIs $25k-50k)
Percentage of individuals using paid preparers for their 2012 taxes: 69.4%
Here:
69%
State:
64%
(% for various income ranges: 70.1% for AGIs below $25k, 71.1% for AGIs $25k-50k, 66.6% for AGIs $50k-75k, 67.6% for AGIs $75k-100k, 65.7% for AGIs $100k-200k, 77.0% for AGIs over 200k)
Averages for the 2004 tax year for zip code 92780, filed in 2005:
Average Adjusted Gross Income (AGI) in 2004: $44,999 (Individual Income Tax Returns)
Here:
$44,999
State:
$58,600
Salary/wage: $41,213 (reported on 87.4% of returns)
Here:
$41,213
State:
$49,455
(% of AGI for various income ranges: 182.3% for AGIs below $10k, 84.3% for AGIs $10k-25k, 89.0% for AGIs $25k-50k, 84.9% for AGIs $50k-75k, 83.9% for AGIs $75k-100k, 66.0% for AGIs over 100k)
Taxable interest for individuals: $1,444 (reported on 38.5% of returns)
This zip code:
$1,444
California:
$2,365
(% of AGI for various income ranges: 8.2% for AGIs below $10k, 1.2% for AGIs $10k-25k, 0.8% for AGIs $25k-50k, 1.0% for AGIs $50k-75k, 1.1% for AGIs $75k-100k, 1.6% for AGIs over 100k)
Taxable dividends: $2,577 (reported on 16.2% of returns)
Here:
$2,577
State:
$4,746
(% of AGI for various income ranges: 5.8% for AGIs below $10k, 0.7% for AGIs $10k-25k, 0.5% for AGIs $25k-50k, 0.6% for AGIs $50k-75k, 0.8% for AGIs $75k-100k, 1.4% for AGIs over 100k)
Net capital gain/loss: +$5,294 (reported on 14.5% of returns)
Here:
+$5,294
State:
+$23,418
(% of AGI for various income ranges: -1.9% for AGIs below $10k, -0.2% for AGIs $10k-25k, -0.1% for AGIs $25k-50k, 0.6% for AGIs $50k-75k, 0.7% for AGIs $75k-100k, 4.6% for AGIs over 100k)
Profit/loss from business: +$12,582 (reported on 15.8% of returns)
Here:
+$12,582
State:
+$16,826
(% of AGI for various income ranges: 17.0% for AGIs below $10k, 6.9% for AGIs $10k-25k, 4.0% for AGIs $25k-50k, 3.3% for AGIs $50k-75k, 4.3% for AGIs $75k-100k, 4.3% for AGIs over 100k)
IRA payment deduction: $3,009 (reported on 2.6% of returns)
92780:
$3,009
California:
$3,192
(% of AGI for various income ranges: 0.4% for AGIs below $10k, 0.2% for AGIs $10k-25k, 0.2% for AGIs $25k-50k, 0.2% for AGIs $50k-75k, 0.2% for AGIs $75k-100k, 0.1% for AGIs over 100k)
Self-employed pension: $12,416 (reported on 0.9% of returns)
Here:
$12,416
California:
$17,688
(% of AGI for various income ranges: 0.1% for AGIs $25k-50k, 0.1% for AGIs $50k-75k, 0.2% for AGIs $75k-100k, 0.5% for AGIs over 100k)
Total itemized deductions: $23,640 (28% of AGI, reported on 33.2% of returns)
Here:
$23,640
State:
$28,113
Here:
28.1% of AGI
State:
25.3% of AGI
(% of AGI for various income ranges: 27.8% for AGIs below $10k, 8.9% for AGIs $10k-25k, 12.8% for AGIs $25k-50k, 19.1% for AGIs $50k-75k, 21.9% for AGIs $75k-100k, 20.3% for AGIs over 100k)
Charity contributions deductions: $3,705 (4% of AGI, reported on 29.5% of returns)
Here:
$3,705
State:
$3,923
Here:
4.3% of AGI
State:
3.3% of AGI
(% of AGI for various income ranges: 1.2% for AGIs below $10k, 0.7% for AGIs $10k-25k, 1.4% for AGIs $25k-50k, 2.1% for AGIs $50k-75k, 2.6% for AGIs $75k-100k, 3.8% for AGIs over 100k)
Total tax: $6,535 (reported on 73.5% of returns)
92780:
$6,535
State:
$10,761
(% of AGI for various income ranges: 6.9% for AGIs below $10k, 3.8% for AGIs $10k-25k, 6.5% for AGIs $25k-50k, 8.8% for AGIs $50k-75k, 10.0% for AGIs $75k-100k, 17.0% for AGIs over 100k)
Earned income credit: $1,730 (reported on 14.0% of returns)
Here:
$1,730
State:
$1,763
Percentage of individuals using paid preparers for their 2004 taxes: 68.0%
Here:
68%
State:
66%
(% for various income ranges: 60.1% for AGIs below $10k, 71.5% for AGIs $10k-25k, 67.1% for AGIs $25k-50k, 68.0% for AGIs $50k-75k, 69.3% for AGIs $75k-100k, 73.1% for AGIs over 100k)
Likely homosexual households (counted as self-reported same-sex unmarried-partner households)
Lesbian couples: 0.1% of all households
Gay men: 0.0% of all households
Household received Food Stamps/SNAP in the past 12 months: 1,896 Household did not receive Food Stamps/SNAP in the past 12 months: 15,675
Women who had a birth in the past 12 months: 537 (365 now married, 172 unmarried) Women who did not have a birth in the past 12 months: 12,763 (4,910 now married, 7,858 unmarried)
Housing units in zip code 92780 with a mortgage: 5,302 (446 second mortgage, 28 home equity loan, 336 both second mortgage and home equity loan) Houses without a mortgage: 165
Median monthly owner costs for units with a mortgage: $2,695 Median monthly owner costs for units without a mortgage: $711
Residents with income below the poverty level in 2022:
This zip code:
10.5%
Whole state:
12.2%
Residents with income below 50% of the poverty level in 2022:
This zip code:
6.6%
Whole state:
6.2%
Median number of rooms in houses and condos:
Here:
6.2
State:
6.0
Median number of rooms in apartments:
Here:
3.8
State:
3.9
Notable locations in this zip code not listed on our city pages
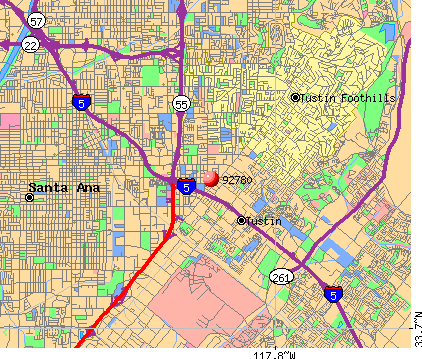
Notable locations in zip code 92780: Irvine Siding (A), Tustin Branch Orange County Public Library (B), Orange County Fire Authority Station 21 (C), Orange County Fire Authority Station 37 (D). Display/hide their locations on the map
Shopping Centers: Tustin Heights Shopping Center (1), The Courtyard Shopping Center (2), Larwin Square Shopping Center (3), El Camino Plaza Shopping Center (4), Enderle Shopping Center (5). Display/hide their locations on the map
Parks in zip code 92780 include: Centennial Park (1), Columbus Tustin Park (2), Frontier Park (3), Magnolia Park (4), Pepper Tree Park (5), Pine Tree Park (6), Utt Park (7). Display/hide their locations on the map
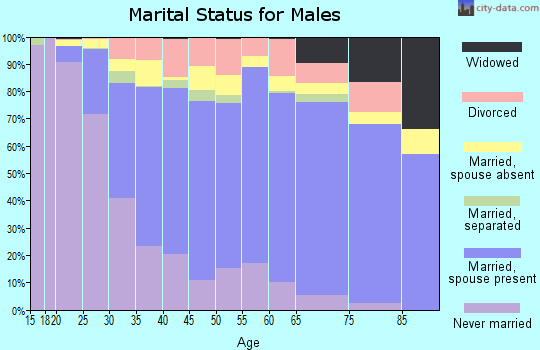
7,449 married couples with children.
3,417 single-parent households (460 men, 2,957 women).
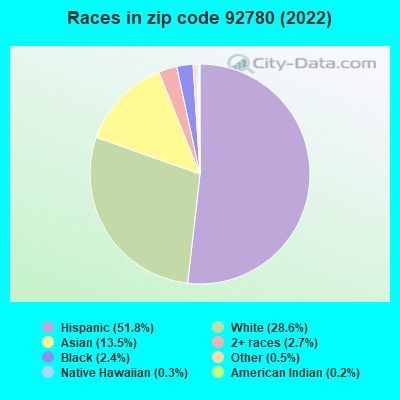
47.5% of residents of 92780 zip code speak English at home.
38.2% of residents speak Spanish at home (61% very well, 22% well, 10% not well, 7% not at all).
4.4% of residents speak other Indo-European language at home (62% very well, 19% well, 13% not well, 6% not at all).
8.9% of residents speak Asian or Pacific Island language at home (49% very well, 27% well, 20% not well, 4% not at all).
0.8% of residents speak other language at home (64% very well, 24% well, 6% not well, 6% not at all).
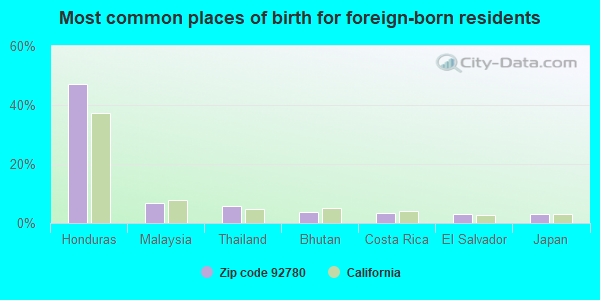
Foreign born population: 16,897 (31.0%) (50.2% of them are naturalized citizens)
Major facilities with environmental interests located in this zip code:
CHEROKEE INTERNATIONAL INCORPORATED (2841 DOW AVE. in TUSTIN, CA)
STATE MASTER (California - Hazardous Waste Tracking) - HAZARDOU WASTE PROGRAM CRITERIA AND HAZARDOUS AIR POLLUTANT INVENTORY (Inventory of air pollution sources) Large Quantity Generators, more that 1000 kg of hazardous waste/month (Resource Conservation and Recovery Act (tracking hazardous waste)) TRI REPORTER (Tracking of toxic chemicals releasing facilities) Business SIC classification: ELECTRON TUBES Business NAICS classification: OTHER ELECTRONIC COMPONENT MANUFACTURING. Alternative names: CHEROKEE INTL. L.L.C.
CHEVRON STATION NO 98149 (13052 NEWPORT AVE in TUSTIN, CA)
STATE MASTER (California - Hazardous Waste Tracking) - HAZARDOU WASTE PROGRAM Large Quantity Generators, more that 1000 kg of hazardous waste/month (Resource Conservation and Recovery Act (tracking hazardous waste)) Organizations: CHEVRON PRODUCTS CO. (CONTACT/OPERATOR)
FISHER SCIENTIFIC TUSTIN (2761 WALNUT AVE in TUSTIN, CA)
STATE MASTER (California - Hazardous Waste Tracking) - HAZARDOU WASTE PROGRAM (Resource Conservation and Recovery Act (tracking hazardous waste)) Alternative names: FISHER SCIENTIFIC LLC
CHEEK ENGINEERING (14341 FRANKLIN AVENUE in TUSTIN, CA)
STATE MASTER (California - Hazardous Waste Tracking) - HAZARDOU WASTE PROGRAM CRITERIA AND HAZARDOUS AIR POLLUTANT INVENTORY (Inventory of air pollution sources) Small Quantity Generators, between 100 kg and 1000 kg of hazardous waste/month (Resource Conservation and Recovery Act (tracking hazardous waste)) - notification Business SIC classification: SHEET METALWORK Business NAICS classification: METAL STAMPING.
MUTUAL LIQUID GAS AND EQUIPMENT (1001 EAST EDINGER AVENUE in TUSTIN, CA)
STATE MASTER (California - Hazardous Waste Tracking) - HAZARDOU WASTE PROGRAM Small Quantity Generators, between 100 kg and 1000 kg of hazardous waste/month (Resource Conservation and Recovery Act (tracking hazardous waste)) - notification Business NAICS classification: LIQUEFIED PETROLEUM GAS (BOTTLED GAS) DEALERS. Organizations: MUTUAL LIQUID GAS & EQUIPMENT (CONTACT/OWNER)
CHEVRON USA INCORPORATED (2120 EAST MC FADDEN in TUSTIN, CA)
STATE MASTER (California - Hazardous Waste Tracking) - HAZARDOU WASTE PROGRAM Small Quantity Generators, between 100 kg and 1000 kg of hazardous waste/month (Resource Conservation and Recovery Act (tracking hazardous waste)) - notification Alternative names: CHEVRON 92830
CHEVRON STATION 201233 (2740 BRYAN AVENUE in TUSTIN, CA)
STATE MASTER (California - Hazardous Waste Tracking) - HAZARDOU WASTE PROGRAM HAZARDOUS WASTE BIENNIAL REPORTER (Resource Conservation and Recovery Act (tracking hazardous waste)) Small Quantity Generators, between 100 kg and 1000 kg of hazardous waste/month (Resource Conservation and Recovery Act (tracking hazardous waste)) - notification Organizations: CHEVRON PRODUCTS CO (CONTACT/OWNER)
Alternative names: CHEVRON STATION NO 201233
A G CURRIE MIDDLE SCHOOL (1402 SYCAMORE AVE in TUSTIN, CA)
(Geographic Names Information System) (National Center for Education Statistics) - STATE ID-6085377 Organizations: TUSTIN UNIFIED (SCHOOL DISTRICT)
Alternative names: CURRIE (A.G.) MIDDLE
JIFFY LUBE #1406 (3087 EDINGER AVE in TUSTIN, CA)
Small Quantity Generators, between 100 kg and 1000 kg of hazardous waste/month (Resource Conservation and Recovery Act (tracking hazardous waste)) - notification STATE MASTER (California - Used Oil Recycling System ) - USED OIL RECYCLING Organizations: ALLIED LUBE INC (CONTACT/OWNER)
Alternative names: JIFFY LUBE NO 1406
MARKET PLACE CLEANERS (2981 EL CAMINO REAL WEST STREET in TUSTIN, CA)
STATE MASTER (California - Hazardous Waste Tracking) - HAZARDOU WASTE PROGRAM Small Quantity Generators, between 100 kg and 1000 kg of hazardous waste/month (Resource Conservation and Recovery Act (tracking hazardous waste)) - notification Organizations: EDMON HACTORIAN (CONTACT/OWNER)
MORTON ELECTRONIC MATERIALS (2631 MICHELLE DRIVE in TUSTIN, CA)
AIR MAJOR ("Best Available" air pollution technologies tracking) HAZARDOUS WASTE BIENNIAL REPORTER (Resource Conservation and Recovery Act (tracking hazardous waste)) Large Quantity Generators, more that 1000 kg of hazardous waste/month (Resource Conservation and Recovery Act (tracking hazardous waste)) - notification TSD (Resource Conservation and Recovery Act (tracking hazardous waste)) TRI REPORTER (Tracking of toxic chemicals releasing facilities) Business SIC classification: CHEMICALS AND CHEMICAL PREPARATIONS; PRINTED CIRCUIT BOARDS Organizations: SHIPLEY COMPANY, LLC (CONTACT/OPERATOR)
, ROHM & HAAS (CONTACT/OWNER)
Alternative names: MORTON INTERNATIONAL - ELECTRONIC MATERIALS, MORTON INTERNATIONAL - ELECTRONIC MATERIALS, SHIPLEY COMPANY L L C, SHIPLEY COMPANY LLC
ENDRLE CLEANERS (17440 EAST 17TH STREET in TUSTIN, CA)
STATE MASTER (California - Hazardous Waste Tracking) - HAZARDOU WASTE PROGRAM Small Quantity Generators, between 100 kg and 1000 kg of hazardous waste/month (Resource Conservation and Recovery Act (tracking hazardous waste)) - notification Organizations: SU LEE (CONTACT/OWNER)
CHEVRON STATION NO 93505 (17241 17TH ST in TUSTIN, CA)
STATE MASTER (California - Hazardous Waste Tracking) - HAZARDOU WASTE PROGRAM Small Quantity Generators, between 100 kg and 1000 kg of hazardous waste/month (Resource Conservation and Recovery Act (tracking hazardous waste)) - notification Organizations: CHEVRON PRODUCTS CO (CONTACT/OWNER)
Housing units lacking complete plumbing facilities: 0.4% Housing units lacking complete kitchen facilities: 3.3%
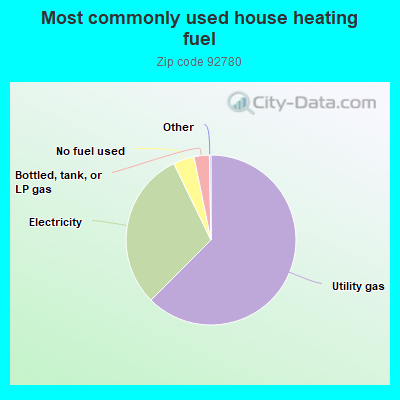
62.5%Utility gas
30.3%Electricity
4.0%No fuel used
2.9%Bottled, tank, or LP gas
Place of birth for U.S.-born residents:
This state: 30,509
Northeast: 1,401
Midwest: 1,863
South: 1,376
West: 1,613
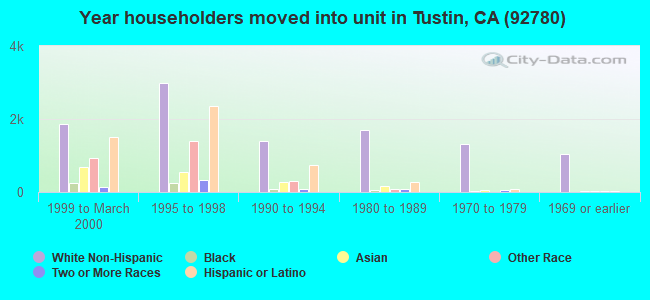
44% of the 92780 zip code residents lived in the same house 5 years ago. Out of people who lived in different houses, 79% lived in this county. Out of people who lived in different counties, 50% lived in California.
89% of the 92780 zip code residents lived in the same house 1 year ago. Out of people who lived in different houses, 69% moved from this county. Out of people who lived in different houses, 15% moved from different county within same state. Out of people who lived in different houses, 8% moved from different state. Out of people who lived in different houses, 6% moved from abroad.
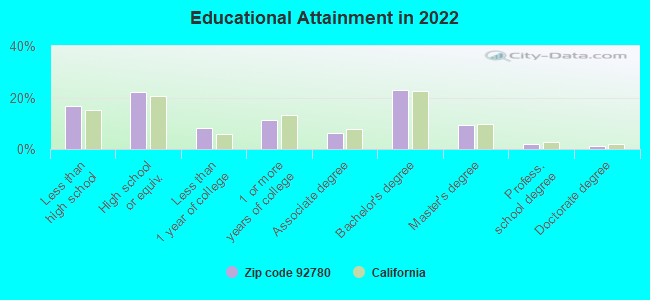
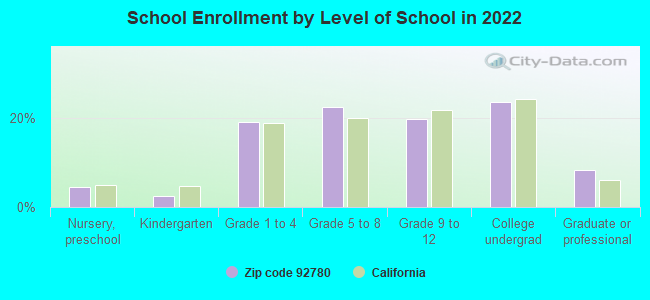
Private vs. public school enrollment:
Students in private schools in grades 1 to 8 (elementary and middle school): 531
Here:
8.6%
California:
10.5%
Students in private schools in grades 9 to 12 (high school): 140
Here:
4.8%
California:
8.5%
Students in private undergraduate colleges: 494
Here:
14.1%
California:
15.9%
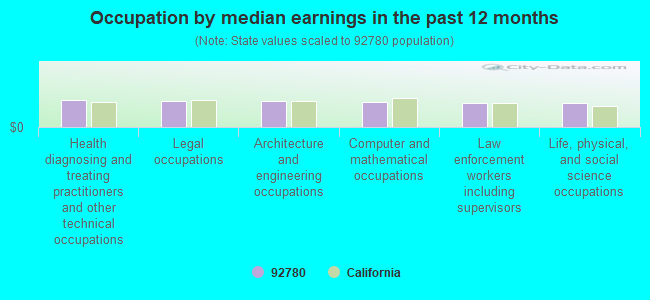
Occupation by median earnings in the past 12 months ($)
98,738Health diagnosing and treating practitioners and other technical occupations
96,127Legal occupations
95,331Architecture and engineering occupations
91,805Computer and mathematical occupations
87,443Law enforcement workers including supervisors
87,428Life, physical, and social science occupations
Companies with biggest federal contracts located in this zip code (TUSTIN, CA):
MEGGITT DEFENSE SYSTEMS TUSTIN (2672 DOW AVE) : $9,298,701 in 67 contractsfrom 2000 to 2006
Contracts for Airframe Structural Components, Radar Equipment, Airborne, Aircraft Gunnery Fire Control Components, Armament Training Devices, and moreby Air Force, Army, Defense Logistics Agency, Navy, and others Signed by year:2000: $707,089; 2001: $181,805; 2002: $314,956; 2003: $3,273,901; 2004: $1,896,905; 2005: $2,163,023; 2006: $761,022.
Biggest contracts:
$1,059,048 with Air Force for Airframe Structural Components. Signed on 2003-12-17. Completion date: 2004-07-30.
$1,022,614, same as above.Signed on 2005-09-21. Completion date: 2006-06-30.
$705,243 with Army for Radar Equipment, Airborne. Signed on 2003-04-10. Completion date: 2007-12-31.
$544,150 with Air Force for Airframe Structural Components. Signed on 2003-09-30. Completion date: 2004-06-30.
OMOHUNDRO CO (14792 FRANKLIN AVE; small business) : $4,581,784 in 80 contractsfrom 1999 to 2006
Contracts for Radar Equipment, Airborne, Antennas, Waveguides, and Related Equipment, Hardware, Commercial, Electronic Countermeasures, Counter-Countermeasures and Quick Reaction Capability Equipment, and moreby Navy, Air Force, Defense Logistics Agency Signed by year:2000: $706,495; 2001: $372,113; 2002: $304,182; 2003: $850,460; 2004: $546,495; 2005: $1,138,350; 2006: $401,038.
Biggest contracts:
$496,947 with Navy for Radar Equipment, Airborne. Signed on 2005-09-16. Completion date: 2006-03-16.
$261,065 with Air Force for Antennas, Waveguides, and Related Equipment. Signed on 2003-03-14. Completion date: 2003-09-30.
$207,434, same as above.Signed on 2005-08-29. Completion date: 2006-02-28.
$163,488, same as above.Signed on 2001-09-24. Completion date: 2002-01-31.
COMMERCE OVERSEAS CORPORATION (14312 CHAMBERS ROAD, -A; small business) : $4,328,167 in 78 contractsfrom 2002 to 2006
Contracts for Airframe Structural Components, Armament Training Devices, Coils and Transformers, Aircraft Hydraulic, Vacuum, and De-icing System Components, and moreby Defense Logistics Agency, Navy, Air Force Signed by year:2000: $0; 2001: $0; 2002: $91,546; 2003: $225,371; 2004: $174,496; 2005: $729,777; 2006: $3,106,977.
Biggest contracts:
$2,567,300 with Defense Logistics Agency for Airframe Structural Components. Signed on 2006-01-05. Completion date: 2007-03-22.
$171,936, same as above.Signed on 2003-11-26. Completion date: 2004-04-28.
$171,500 with Defense Logistics Agency for Armament Training Devices. Signed on 2004-09-09. Completion date: 2004-10-09.
$95,075 with Defense Logistics Agency for Airframe Structural Components. Signed on 2005-12-29. Completion date: 2007-01-19.
MILLENWORKS INC (1361 VALENCIA AVENUE; small business) : $3,551,122 in 25 contractsfrom 2000 to 2006
Contracts for Other Defense -- Management and Support (R&D), Services -- Basic Research (R&D), Defense Tank - Automotive -- Engineering Development (R&D), Other Research and Development -- Basic Research (R&D), and moreby Army, Air Force, Department of Defense, Navy, and others Signed by year:2000: $119,896; 2001: $364,075; 2002: $577,888; 2003: $937,410; 2004: $604,045; 2005: $464,513; 2006: $483,295.
Biggest contracts:
$387,186 with Army for Other Defense -- Management and Support (R&D). Signed on 2004-03-16. Completion date: 2005-04-18.
$365,792 with Army for Services -- Basic Research (R&D). Signed on 2002-03-06. Completion date: 2003-01-30.
$364,075, same as above.Signed on 2001-02-03. Completion date: 2003-01-30.
$342,471 with Army for Other Defense -- Management and Support (R&D). Signed on 2003-04-18. Completion date: 2005-04-18.
SYAGEN TECHNOLOGY INC (1411 WARNER AVE STE D; small business) : $2,570,822 in 15 contractsfrom 1999 to 2005
Contracts for Other Defense -- Applied Research and Exploratory Development (R&D), ADP Supplies, Aeronautics and Space Technology -- Applied Research and Exploratory Development (R&D), Laboratory Equipment and Supplies, and moreby Army, Navy, NASA, Department of Defense, and others Signed by year:2000: $895,000; 2001: $199,000; 2002: $134,000; 2003: $663,301; 2004: $343,904; 2005: $150,000; 2006: $0.
Biggest contracts:
$749,000 with Army for Other Defense -- Applied Research and Exploratory Development (R&D). Signed on 2000-08-29. Completion date: 2002-08-29.
$300,000 with Navy for ADP Supplies. Signed on 2004-12-03. Completion date: 2006-12-02.
$249,972 with Army for Other Defense -- Applied Research and Exploratory Development (R&D). Signed on 2003-12-23. Completion date: 2003-09-30.
$199,000 with NASA for Aeronautics and Space Technology -- Applied Research and Exploratory Development (R&D). Signed on 2001-04-15. Completion date: 2002-04-15.
DESIGN WEST ARATECH (14401 CHAMBERS RD; small business) 50 employees, $0 revenue. Small Disadvantaged Business: $2,259,249 in 31 contractsfrom 2004 to 2006
Contracts for Guns, through 30 mm, Household and Commercial Utility Containers, Vehicular Furniture and Accessories, Meteorological Instruments and Apparatus, and moreby Army, Defense Logistics Agency, National Oceanic and Atmospheric Administration/Under Secretary for Oceans and Atmosphere, Bureau of Reclamation, and others Signed by year:2000: $0; 2001: $0; 2002: $0; 2003: $0; 2004: $762,575; 2005: $333,093; 2006: $1,163,581.
Biggest contracts:
$904,473 with Army for Guns, through 30 mm. Signed on 2006-02-22. Completion date: 2012-02-28.
$560,450 with Defense Logistics Agency for Household and Commercial Utility Containers. Signed on 2004-12-21. Completion date: 2005-03-21.
$122,692 with Defense Logistics Agency for Vehicular Furniture and Accessories. Signed on 2005-09-30. Completion date: 2006-01-28.
$108,870 with National Oceanic and Atmospheric Administration/Under Secretary for Oceans and Atmosphere for Meteorological Instruments and Apparatus. Signed on 2004-09-23. Completion date: 2005-01-21.
A & J MANUFACTURING COMPANY IN (14831 FRANKLIN AVE; small business) : $2,199,592 in 94 contractsfrom 2000 to 2006
Contracts for Laboratory Equipment and Supplies, Hardware, Commercial, Electrical Hardware and Supplies, Miscellaneous Electrical and Electronic Components, and moreby Navy, Defense Logistics Agency, Minerals Management Service, U.S. Army Corps of Engineers - civil program financing only, and others Signed by year:2000: $267,724; 2001: $281,941; 2002: $379,207; 2003: $414,735; 2004: $415,927; 2005: $297,737; 2006: $142,321.
Biggest contracts:
$96,691 with Navy for Laboratory Equipment and Supplies. Signed on 2002-06-25. Completion date: 2002-09-20.
$95,475 with Navy for Hardware, Commercial. Signed on 2006-03-13. Completion date: 2006-04-14.
$82,465 with Navy for Electrical Hardware and Supplies. Signed on 2002-02-05. Completion date: 2002-03-25.
$79,825 with Navy for Miscellaneous Electrical and Electronic Components. Taking place in MD. Signed on 2003-08-19. Completion date: 2003-09-17.
POLYTEC INC (1342 BELL AVE; small business) : $1,936,633 in 24 contractsfrom 2000 to 2006
Contracts for Laboratory Equipment and Supplies, Optical Instruments, Test Equipment, Components and Accessories, Electrical and Electronic Properties Measuring and Testing Instruments, Stimulated Coherent Radiation Devices, Components and Accessories, and moreby NASA, National Institute of Standards and Technology, Army, Navy, and others Signed by year:2000: $496,000; 2001: $639,941; 2002: $182,685; 2003: $379,342; 2004: $110,040; 2005: $68,165; 2006: $60,460.
Biggest contracts:
$350,000 with NASA for Laboratory Equipment and Supplies. Taking place in MA. Signed on 2000-06-15. Completion date: 2000-09-15.
$280,620 with National Institute of Standards and Technology for Optical Instruments, Test Equipment, Components and Accessories. Taking place in MA. Signed on 2003-09-15. Completion date: 2005-01-15.
$250,026 with Army for Electrical and Electronic Properties Measuring and Testing Instruments. Taking place in MA. Signed on 2001-04-19. Completion date: 2001-07-03.
$146,000 with NASA for Stimulated Coherent Radiation Devices, Components and Accessories. Taking place in MA. Signed on 2000-06-15. Completion date: 2000-08-15.
TRUESDAIL LABORATORIES, INC (14201 FRANKLIN AVENUE; small business) : $1,602,382 in 108 contractsfrom 1999 to 2006
Contracts for Other Quality Control, Testing and Inspection Services -- Miscellaneous, Maintenance, Repair or Alteration of Real Property -- Sewage and Waste Facilities, Inspection Services (including commercial testing and lab services, except medical/dental) -- Water Purification and Sewage Treatment Equipment, Facilities Operations Support Services, and moreby Navy, Air Force, Bureau of Prisoners/Federal Prison System, Geological Survey, and others Signed by year:2000: $0; 2001: $47,053; 2002: $735,691; 2003: $72,605; 2004: $370,938; 2005: $325,018; 2006: $13,454.
Biggest contracts:
$599,977 with Navy for Other Quality Control, Testing and Inspection Services -- Miscellaneous. Signed on 2002-10-01. Completion date: 2003-09-30.
$219,766 with Navy for Maintenance, Repair or Alteration of Real Property -- Sewage and Waste Facilities. Signed on 2004-12-21. Completion date: 2005-05-30.
$152,964, same as above.Signed on 2005-05-25. Completion date: 2005-05-30.
$99,970, same as above.Signed on 2005-05-19. Completion date: 2006-05-22.
REVERE TRANSDUCERS, INC (14192 FRANKLIN AVENUE) : $1,174,008 in 25 contractsfrom 1999 to 2006
Contracts for Engine Instruments, Scales and Balances, Miscellaneous Aircraft Accessories and Components, Cable, Cord, and Wire Assemblies: Communications Equipment, and moreby Navy, Air Force, Defense Logistics Agency, Army, and others Signed by year:2000: $236,421; 2001: $138,888; 2002: $271,678; 2003: $20,362; 2004: $283,892; 2005: $58,894; 2006: $12,393.
Biggest contracts:
$209,421 with Navy for Engine Instruments. Signed on 2000-03-17. Completion date: 2001-02-05.
$205,005 with Air Force for Scales and Balances. Signed on 2004-06-21. Completion date: 2004-09-30.
$192,888 with Navy for Engine Instruments. Signed on 2002-03-15. Completion date: 2002-07-12.
$138,888, same as above.Signed on 2001-04-26. Completion date: 2002-02-11.
Top industries in this zip code by the number of employees in 2005:
Administrative and Support and Waste Management and Remediation Services: Temporary Help Services (250-499 employees: 3 establishments, 100-249 employees: 7 establishments, 50-99 employees: 1 establishment, 10-19 employees: 1 establishment, 5-9 employees: 1 establishment, 1-4 employees: 3 establishments)
Administrative and Support and Waste Management and Remediation Services: Professional Employer Organizations (over 1000: 1, 50-99: 1, 10-19: 1)
2005 - 2018 National Fire Incident Reporting System (NFIRS) incidents
According to the data from the years 2005 - 2018 the average number of fire incidents per year is 8. The highest number of fire incidents - 31 took place in 2005, and the least - 1 in 2012. The data has a decreasing trend.
When looking into fire subcategories, the most incidents belonged to: Structure Fires (47.0%), and Outside Fires (23.9%).
Fire incident types reported to NFIRS in Zip Code 92780


 Nearest zip codes: 92606, 92782, 92701, 92705, 92604, 92614.


 According to the data from the years 2005 - 2018 the average number of fire incidents per year is 8. The highest number of fire incidents - 31 took place in 2005, and the least - 1 in 2012. The data has a decreasing trend.
 When looking into fire subcategories, the most incidents belonged to: Structure Fires (47.0%), and Outside Fires (23.9%).