Estimated zip code population in 2022: 21,704 Zip code population in 2010: 21,649 Zip code population in 2000: 22,123
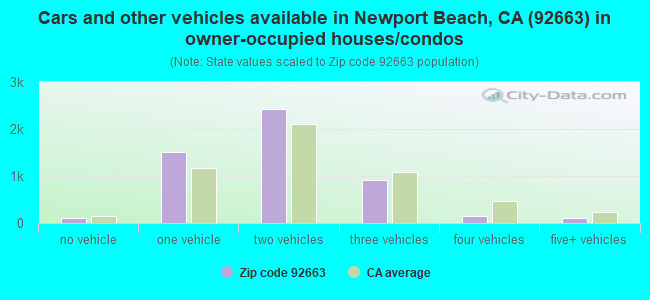
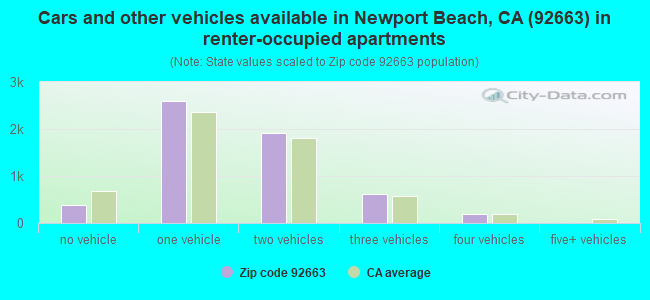
Houses and condos: 12,687 Renter-occupied apartments: 5,682
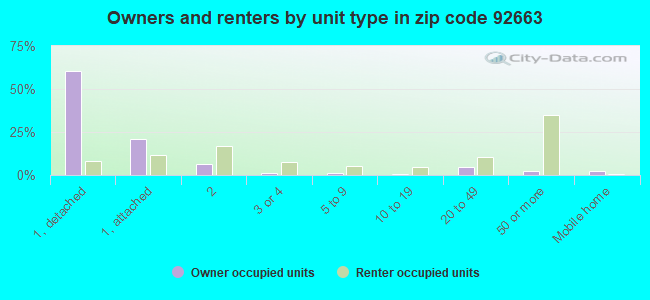
% of renters here:
52%
State:
44%
March 2022 cost of living index in zip code 92663: 92.3 (less than average, U.S. average is 100)
Land area: 3.3 sq. mi. Water area: 1.3 sq. mi.
Population density: 6,574 people per square mile
(high).
OSM Map
General Map
Google Map
MSN Map
OSM Map
General Map
Google Map
MSN Map
OSM Map
General Map
Google Map
MSN Map
OSM Map
General Map
Google Map
MSN Map
Please wait while loading the map...
Real estate property taxes paid for housing units in 2022:
This zip code:
0.5% ($9,069)
California:
0.7% ($4,831)
Median real estate property taxes paid for housing units with mortgages in 2022: $10,330 (0.5%) Median real estate property taxes paid for housing units with no mortgage in 2022: $6,575 (0.3%)
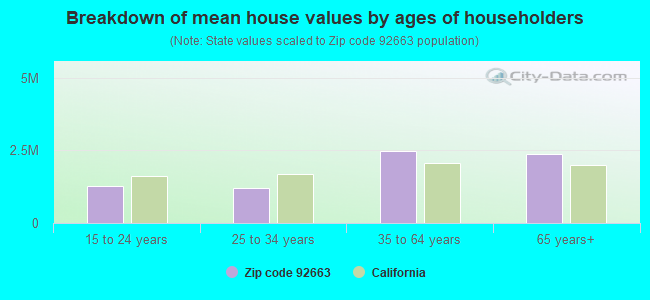
Estimated median house/condo value in 2022: $2,002,196
92663:
$2,002,196
California:
$715,900
According to our research of California and other state lists, there were 7 registered sex offenders living in 92663 zip code as of April 27, 2024. The ratio of all residents to sex offenders in zip code 92663 is 3,247 to 1. The ratio of registered sex offenders to all residents in this zip code is much lower than the state average.
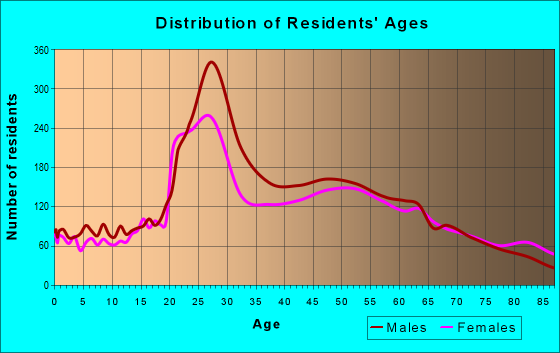
Median resident age:
This zip code:
45.1 years
California median age:
37.9 years
Average household size:
This zip code:
2.0 people
California:
2.8 people
Averages for the 2020 tax year for zip code 92663, filed in 2021:
Average Adjusted Gross Income (AGI) in 2020: $246,699 (Individual Income Tax Returns)
Here:
$246,699
State:
$95,910
Salary/wage: $130,342 (reported on 73.5% of returns)
Here:
$130,342
State:
$77,331
(% of AGI for various income ranges: 1258.4% for AGIs below $25k, 3978.6% for AGIs $25k-50k, 7494.0% for AGIs $50k-75k, 11691.8% for AGIs $75k-100k, 21785.8% for AGIs $100k-200k, 176917.6% for AGIs over 200k)
Taxable interest for individuals: $10,041 (reported on 45.9% of returns)
This zip code:
$10,041
California:
$2,294
(% of AGI for various income ranges: 49.9% for AGIs below $25k, 91.1% for AGIs $25k-50k, 91.6% for AGIs $50k-75k, 148.4% for AGIs $75k-100k, 525.8% for AGIs $100k-200k, 11228.4% for AGIs over 200k)
Ordinary dividends: $27,149 (reported on 40.3% of returns)
Here:
$27,149
State:
$10,949
(% of AGI for various income ranges: 126.1% for AGIs below $25k, 189.8% for AGIs $25k-50k, 243.6% for AGIs $50k-75k, 438.2% for AGIs $75k-100k, 1293.9% for AGIs $100k-200k, 26425.9% for AGIs over 200k)
Net capital gain/loss in AGI: +$157,324 (reported on 40.7% of returns)
Here:
+$157,324
State:
+$49,306
(% of AGI for various income ranges: 54.5% for AGIs below $25k, 120.8% for AGIs $25k-50k, 194.5% for AGIs $50k-75k, 486.1% for AGIs $75k-100k, 1393.9% for AGIs $100k-200k, 178611.4% for AGIs over 200k)
Profit/loss from business: +$28,620 (reported on 23.2% of returns)
Here:
+$28,620
State:
+$15,671
(% of AGI for various income ranges: 267.2% for AGIs below $25k, 438.6% for AGIs $25k-50k, 455.9% for AGIs $50k-75k, 540.0% for AGIs $75k-100k, 2013.3% for AGIs $100k-200k, 10821.4% for AGIs over 200k)
Taxable individual retirement arrangement distribution: $36,072 (reported on 9.3% of returns)
92663:
$36,072
California:
$23,505
(% of AGI for various income ranges: 80.2% for AGIs below $25k, 116.3% for AGIs $25k-50k, 226.7% for AGIs $50k-75k, 447.4% for AGIs $75k-100k, 1404.5% for AGIs $100k-200k, 4897.8% for AGIs over 200k)
Self-employed (Keogh) retirement plans: $35,135 (reported on 2.2% of returns)
92663:
$35,135
California:
$30,163
(% of AGI for various income ranges: 42.1% for AGIs $50k-75k, 118.3% for AGIs $100k-200k, 1842.2% for AGIs over 200k)
Total itemized deductions: $67,377 (reported on 26.0% of returns)
Here:
$67,377
State:
$39,517
(% of AGI for various income ranges: 319.9% for AGIs below $25k, 439.4% for AGIs $25k-50k, 771.5% for AGIs $50k-75k, 1030.8% for AGIs $75k-100k, 3293.0% for AGIs $100k-200k, 37503.0% for AGIs over 200k)
Charity contributions: $30,397 (reported on 22.4% of returns)
Here:
$30,397
State:
$12,598
(% of AGI for various income ranges: 12.1% for AGIs below $25k, 39.6% for AGIs $25k-50k, 81.7% for AGIs $50k-75k, 124.5% for AGIs $75k-100k, 530.3% for AGIs $100k-200k, 17831.1% for AGIs over 200k)
Taxes paid: $9,040 (reported on 26.0% of returns)
92663:
$9,040
State:
$8,807
(% of AGI for various income ranges: 57.3% for AGIs below $25k, 90.6% for AGIs $25k-50k, 154.0% for AGIs $50k-75k, 286.1% for AGIs $75k-100k, 829.2% for AGIs $100k-200k, 3734.9% for AGIs over 200k)
Earned income credit: $1,146 (reported on 5.6% of returns)
Here:
$1,146
State:
$2,074
(% of AGI for various income ranges: 36.9% for AGIs below $25k, 22.3% for AGIs $25k-50k)
Percentage of individuals using paid preparers for their 2020 taxes: 93.3%
Here:
93%
State:
92%
(% for various income ranges: 91.9% for AGIs below $25k, 91.9% for AGIs $25k-50k, 94.4% for AGIs $50k-75k, 92.9% for AGIs $75k-100k, 94.7% for AGIs $100k-200k, 94.3% for AGIs over 200k)
Averages for the 2012 tax year for zip code 92663, filed in 2013:
Average Adjusted Gross Income (AGI) in 2012: $161,189 (Individual Income Tax Returns)
Here:
$161,189
State:
$72,726
Salary/wage: $95,523 (reported on 76.0% of returns)
Here:
$95,523
State:
$59,079
(% of AGI for various income ranges: 67.7% for AGIs below $25k, 76.1% for AGIs $25k-50k, 77.8% for AGIs $50k-75k, 74.2% for AGIs $75k-100k, 63.7% for AGIs $100k-200k, 34.0% for AGIs over 200k)
Taxable interest for individuals: $6,960 (reported on 44.6% of returns)
This zip code:
$6,960
California:
$2,146
(% of AGI for various income ranges: 2.7% for AGIs below $25k, 1.4% for AGIs $25k-50k, 1.4% for AGIs $50k-75k, 1.2% for AGIs $75k-100k, 1.8% for AGIs $100k-200k, 2.1% for AGIs over 200k)
Ordinary dividends: $33,448 (reported on 33.3% of returns)
Here:
$33,448
State:
$9,308
(% of AGI for various income ranges: 4.7% for AGIs below $25k, 2.1% for AGIs $25k-50k, 2.2% for AGIs $50k-75k, 2.4% for AGIs $75k-100k, 5.2% for AGIs $100k-200k, 8.3% for AGIs over 200k)
Net capital gain/loss in AGI: +$98,121 (reported on 32.6% of returns)
Here:
+$98,121
State:
+$30,460
(% of AGI for various income ranges: 0.5% for AGIs $25k-50k, 0.8% for AGIs $50k-75k, 1.8% for AGIs $75k-100k, 2.1% for AGIs $100k-200k, 27.9% for AGIs over 200k)
Profit/loss from business: +$25,531 (reported on 22.5% of returns)
Here:
+$25,531
State:
+$17,064
(% of AGI for various income ranges: 16.7% for AGIs below $25k, 7.9% for AGIs $25k-50k, 5.8% for AGIs $50k-75k, 4.4% for AGIs $75k-100k, 5.6% for AGIs $100k-200k, 2.3% for AGIs over 200k)
Taxable individual retirement arrangement distribution: $30,272 (reported on 10.3% of returns)
92663:
$30,272
California:
$19,557
(% of AGI for various income ranges: 2.9% for AGIs below $25k, 2.0% for AGIs $25k-50k, 2.0% for AGIs $50k-75k, 2.8% for AGIs $75k-100k, 4.3% for AGIs $100k-200k, 1.4% for AGIs over 200k)
Self-employment retirement plans: $26,712 (reported on 2.2% of returns)
92663:
$26,712
California:
$24,530
(% of AGI for various income ranges: 0.4% for AGIs below $25k, 0.3% for AGIs $50k-75k, 0.4% for AGIs $75k-100k, 0.7% for AGIs $100k-200k, 0.3% for AGIs over 200k)
Total itemized deductions: $57,324 (19% of AGI, reported on 48.3% of returns)
Here:
$57,324
State:
$34,004
Here:
19.5% of AGI
State:
22.7% of AGI
(% of AGI for various income ranges: 22.2% for AGIs below $25k, 15.9% for AGIs $25k-50k, 15.5% for AGIs $50k-75k, 19.3% for AGIs $75k-100k, 21.9% for AGIs $100k-200k, 16.2% for AGIs over 200k)
Charity contributions: $9,171 (reported on 40.1% of returns)
Here:
$9,171
State:
$4,659
(% of AGI for various income ranges: 1.0% for AGIs below $25k, 1.1% for AGIs $25k-50k, 1.5% for AGIs $50k-75k, 1.8% for AGIs $75k-100k, 2.1% for AGIs $100k-200k, 2.5% for AGIs over 200k)
Taxes paid: $29,688 (reported on 48.1% of returns)
92663:
$29,688
State:
$14,448
(% of AGI for various income ranges: 4.7% for AGIs below $25k, 3.2% for AGIs $25k-50k, 4.2% for AGIs $50k-75k, 7.2% for AGIs $75k-100k, 9.0% for AGIs $100k-200k, 9.8% for AGIs over 200k)
Earned income credit: $1,272 (reported on 7.4% of returns)
Here:
$1,272
State:
$2,286
(% of AGI for various income ranges: 2.3% for AGIs below $25k, 0.2% for AGIs $25k-50k)
Percentage of individuals using paid preparers for their 2012 taxes: 66.4%
Here:
66%
State:
64%
(% for various income ranges: 60.5% for AGIs below $25k, 57.8% for AGIs $25k-50k, 57.4% for AGIs $50k-75k, 66.7% for AGIs $75k-100k, 76.0% for AGIs $100k-200k, 91.0% for AGIs over 200k)
Averages for the 2004 tax year for zip code 92663, filed in 2005:
Average Adjusted Gross Income (AGI) in 2004: $117,511 (Individual Income Tax Returns)
Here:
$117,511
State:
$58,600
Salary/wage: $78,936 (reported on 74.6% of returns)
Here:
$78,936
State:
$49,455
(% of AGI for various income ranges: 70.4% for AGIs $10k-25k, 80.3% for AGIs $25k-50k, 77.7% for AGIs $50k-75k, 70.3% for AGIs $75k-100k, 40.0% for AGIs over 100k)
Taxable interest for individuals: $8,486 (reported on 53.8% of returns)
This zip code:
$8,486
California:
$2,365
(% of AGI for various income ranges: 3.5% for AGIs $10k-25k, 2.1% for AGIs $25k-50k, 2.0% for AGIs $50k-75k, 2.2% for AGIs $75k-100k, 4.0% for AGIs over 100k)
Taxable dividends: $14,185 (reported on 37.1% of returns)
Here:
$14,185
State:
$4,746
(% of AGI for various income ranges: 3.5% for AGIs $10k-25k, 2.0% for AGIs $25k-50k, 2.3% for AGIs $50k-75k, 3.0% for AGIs $75k-100k, 4.7% for AGIs over 100k)
Net capital gain/loss: +$54,880 (reported on 36.0% of returns)
Here:
+$54,880
State:
+$23,418
(% of AGI for various income ranges: 0.5% for AGIs $10k-25k, 0.8% for AGIs $25k-50k, 1.0% for AGIs $50k-75k, 2.3% for AGIs $75k-100k, 20.3% for AGIs over 100k)
Profit/loss from business: +$28,041 (reported on 22.8% of returns)
Here:
+$28,041
State:
+$16,826
(% of AGI for various income ranges: 14.6% for AGIs $10k-25k, 6.6% for AGIs $25k-50k, 5.8% for AGIs $50k-75k, 7.0% for AGIs $75k-100k, 4.5% for AGIs over 100k)
IRA payment deduction: $3,485 (reported on 3.8% of returns)
92663:
$3,485
California:
$3,192
(% of AGI for various income ranges: 0.4% for AGIs $10k-25k, 0.3% for AGIs $25k-50k, 0.2% for AGIs $50k-75k, 0.2% for AGIs $75k-100k, 0.1% for AGIs over 100k)
Self-employed pension: $21,021 (reported on 3.0% of returns)
Here:
$21,021
California:
$17,688
(% of AGI for various income ranges: 0.3% for AGIs $10k-25k, 0.2% for AGIs $25k-50k, 0.4% for AGIs $50k-75k, 0.7% for AGIs $75k-100k, 0.6% for AGIs over 100k)
Total itemized deductions: $48,295 (22% of AGI, reported on 48.4% of returns)
Here:
$48,295
State:
$28,113
Here:
21.7% of AGI
State:
25.3% of AGI
(% of AGI for various income ranges: 20.2% for AGIs $10k-25k, 15.4% for AGIs $25k-50k, 20.8% for AGIs $50k-75k, 24.9% for AGIs $75k-100k, 18.7% for AGIs over 100k)
Charity contributions deductions: $10,457 (4% of AGI, reported on 43.3% of returns)
Here:
$10,457
State:
$3,923
Here:
4.4% of AGI
State:
3.3% of AGI
(% of AGI for various income ranges: 1.4% for AGIs $10k-25k, 1.6% for AGIs $25k-50k, 2.3% for AGIs $50k-75k, 2.6% for AGIs $75k-100k, 4.2% for AGIs over 100k)
Total tax: $27,562 (reported on 84.6% of returns)
92663:
$27,562
State:
$10,761
(% of AGI for various income ranges: 6.6% for AGIs $10k-25k, 9.8% for AGIs $25k-50k, 11.9% for AGIs $50k-75k, 13.0% for AGIs $75k-100k, 21.5% for AGIs over 100k)
Earned income credit: $1,037 (reported on 5.6% of returns)
Here:
$1,037
State:
$1,763
Percentage of individuals using paid preparers for their 2004 taxes: 68.1%
Here:
68%
State:
66%
(% for various income ranges: 63.5% for AGIs below $10k, 61.3% for AGIs $10k-25k, 58.0% for AGIs $25k-50k, 67.4% for AGIs $50k-75k, 74.0% for AGIs $75k-100k, 85.9% for AGIs over 100k)
Household received Food Stamps/SNAP in the past 12 months: 405 Household did not receive Food Stamps/SNAP in the past 12 months: 10,276
Women who had a birth in the past 12 months: 192 (181 now married, 10 unmarried) Women who did not have a birth in the past 12 months: 4,488 (1,432 now married, 3,070 unmarried)
Housing units in zip code 92663 with a mortgage: 3,034 (326 second mortgage, 12 home equity loan, 291 both second mortgage and home equity loan) Houses without a mortgage: 79
Median monthly owner costs for units with a mortgage: $3,876 Median monthly owner costs for units without a mortgage: $1,183
Residents with income below the poverty level in 2022:
This zip code:
9.5%
Whole state:
12.2%
Residents with income below 50% of the poverty level in 2022:
This zip code:
2.6%
Whole state:
6.2%
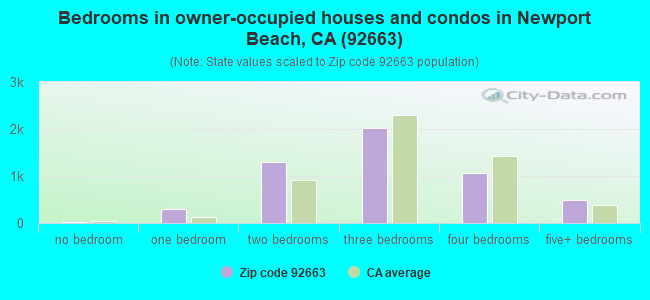
Median number of rooms in houses and condos:
Here:
5.9
State:
6.0
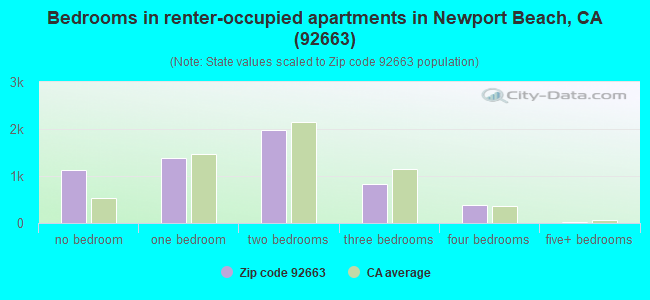
Median number of rooms in apartments:
Here:
3.7
State:
3.9
Notable locations in this zip code not listed on our city pages
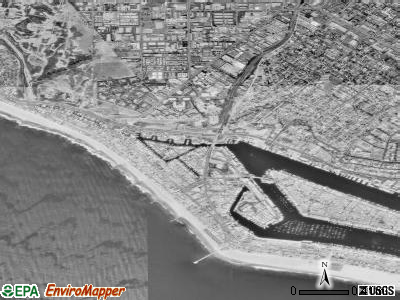
Notable locations in zip code 92663: The Arches (A), American Legion Yacht Club (B), South Shore Yacht Club (C), Newport Pier (D), Newport Harbor Nautical Museum (E), Newport Beach City Hall (F), Newport Beach Fire Department Station 2 (G). Display/hide their locations on the map
Parks in zip code 92663 include: Channel Park (1), Santa Ana River County Beach (2), Cliff Drive Park (3), Thirty-eighth Street Park (4), West Newport Park (5). Display/hide their locations on the map
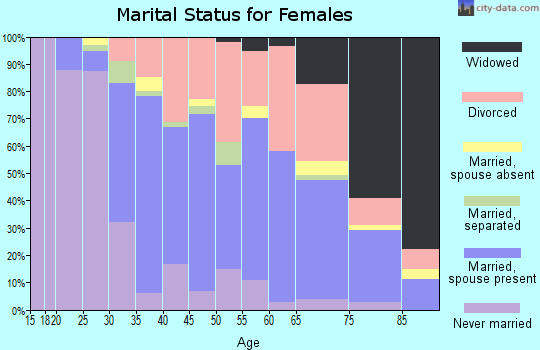
1,480 married couples with children.
527 single-parent households (174 men, 353 women).
84.9% of residents of 92663 zip code speak English at home.
6.7% of residents speak Spanish at home (74% very well, 12% well, 10% not well, 3% not at all).
5.9% of residents speak other Indo-European language at home (93% very well, 5% well, 1% not at all).
2.2% of residents speak Asian or Pacific Island language at home (54% very well, 30% well, 15% not well, 1% not at all).
0.1% of residents speak other language at home (100% very well).
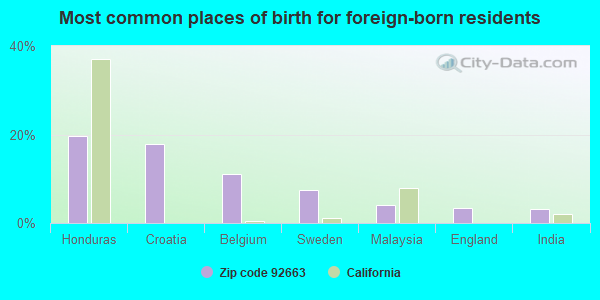
Foreign born population: 2,319 (10.7%) (49.3% of them are naturalized citizens)
Major facilities with environmental interests located in this zip code:
HIXSON METAL FINISHING (829 PRODUCTION PL in NEWPORT BEACH, CA)
AIR MINOR (AIRS/AFS) STATE MASTER (California - Hazardous Waste Tracking) - HAZARDOU WASTE PROGRAM CRITERIA AND HAZARDOUS AIR POLLUTANT INVENTORY (Inventory of air pollution sources) HAZARDOUS WASTE BIENNIAL REPORTER (Resource Conservation and Recovery Act (tracking hazardous waste)) Large Quantity Generators, more that 1000 kg of hazardous waste/month (Resource Conservation and Recovery Act (tracking hazardous waste)) TRI REPORTER (Tracking of toxic chemicals releasing facilities) Business SIC classification: ELECTROPLATING, PLATING, POLISHING, ANODIZING, AND COLORING; BROOMS AND BRUSHES Business NAICS classification: ALL OTHER MISCELLANEOUS FABRICATED METAL PRODUCT MANUFACTURING.
CHIC CLEANERS (1495 SUPERIOR AVE in NEWPORT BEACH, CA)
STATE MASTER (California - Hazardous Waste Tracking) - HAZARDOU WASTE PROGRAM Small Quantity Generators, between 100 kg and 1000 kg of hazardous waste/month (Resource Conservation and Recovery Act (tracking hazardous waste)) - notification Organizations: WRIGHT PAULINE (CONTACT/OWNER)
NEWPORT HARBOR SHIPYARD (151 SHIPYARD WAY BERTH C in NEWPORT BEACH, CA)
STATE MASTER (California - Hazardous Waste Tracking) - HAZARDOU WASTE PROGRAM Small Quantity Generators, between 100 kg and 1000 kg of hazardous waste/month (Resource Conservation and Recovery Act (tracking hazardous waste)) - notification Organizations: BAIN MICHEAL (CONTACT/OWNER)
FIVE STAR AUTO CARE INC (925 W 16TH ST in NEWPORT BEACH, CA)
STATE MASTER (California - Hazardous Waste Tracking) - HAZARDOU WASTE PROGRAM Small Quantity Generators, between 100 kg and 1000 kg of hazardous waste/month (Resource Conservation and Recovery Act (tracking hazardous waste)) - notification
FREEFORM R AND D (1539 MONROVIA UNIT 23 in NEWPORT BEACH, CA)
STATE MASTER (California - Hazardous Waste Tracking) - HAZARDOU WASTE PROGRAM Small Quantity Generators, between 100 kg and 1000 kg of hazardous waste/month (Resource Conservation and Recovery Act (tracking hazardous waste)) - notification
HOAG NEWPORT LIDO RADIOLOGY (351 HOSPITAL RD STE 007 in NEWPORT BEACH, CA)
STATE MASTER (California - Hazardous Waste Tracking) - HAZARDOU WASTE PROGRAM Small Quantity Generators, between 100 kg and 1000 kg of hazardous waste/month (Resource Conservation and Recovery Act (tracking hazardous waste)) - notification Organizations: NEWPORT LIDO MED CTR (CONTACT/OWNER)
ENSIGN (HORACE) INTERMEDIATE (2000 CLIFF DR. in NEWPORT BEACH, CA)
(National Center for Education Statistics) - STATE ID-6029367 Organizations: NEWPORT-MESA UNIFIED (SCHOOL DISTRICT)
HOAG MEMORIAL HOSPITAL (ONE HOAG DR in NEWPORT BEACH, CA) . Federal Facility
AIR MAJOR (AIRS/AFS) STATE MASTER (California - Hazardous Waste Tracking) - HAZARDOU WASTE PROGRAM Alternative names: HOAG MEMORIAL HOSPITAL PRESBYTERIAN
NEWPORT ELEMENTARY (14TH ST. AND BALBOA BLVD. in NEWPORT BEACH, CA)
(National Center for Education Statistics) - STATE ID-6029433 Organizations: NEWPORT-MESA UNIFIED (SCHOOL DISTRICT)
NEWPORT HARBOR HIGH (600 IRVINE AVE. in NEWPORT BEACH, CA)
(National Center for Education Statistics) - STATE ID-3035045 Organizations: NEWPORT-MESA UNIFIED (SCHOOL DISTRICT)
NEWPORT HEIGHTS ELEMENTARY (300 E. 15TH ST. in NEWPORT BEACH, CA)
(National Center for Education Statistics) - STATE ID-6029441 Organizations: NEWPORT-MESA UNIFIED (SCHOOL DISTRICT)
NEWPORT BANNING RANCH (PACIFIC COAST HWY AT 19TH ST in NEWPORT BEACH, CA)
(Integrated Compliance Information System) - ICIS-09-1998-0106, FORMAL ENFORCEMENT ACTION Business SIC classification: CRUDE PETROLEUM AND NATURAL GAS; DRILLING OIL AND GAS WELLS
LIDO PENINSULA CO (201 SHIPYARD WY CABIN NUMBER 1 in NEWPORT BEACH, CA)
(Resource Conservation and Recovery Act (tracking hazardous waste)) Organizations: CURCI TURNER CO (CONTACT/OWNER)
Housing units lacking complete plumbing facilities: 0.2% Housing units lacking complete kitchen facilities: 3.3%
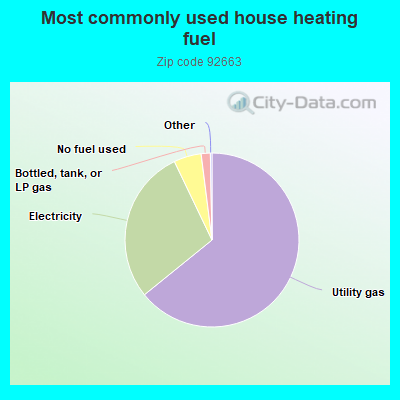
64.1%Utility gas
28.7%Electricity
5.1%No fuel used
1.7%Bottled, tank, or LP gas
Population in 1990: 19,826. Population change in the 1990s: +2,297 (+11.6%).
Place of birth for U.S.-born residents:
This state: 13,706
Northeast: 1,587
Midwest: 2,398
South: 609
West: 618
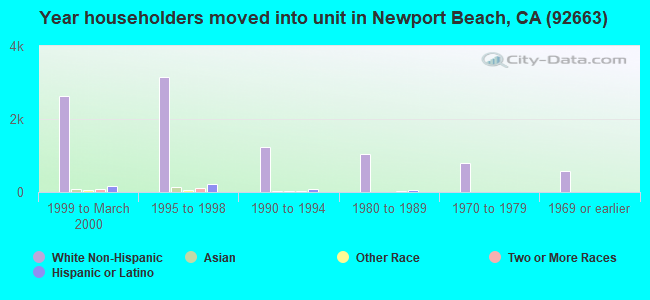
41% of the 92663 zip code residents lived in the same house 5 years ago. Out of people who lived in different houses, 59% lived in this county. Out of people who lived in different counties, 50% lived in California.
80% of the 92663 zip code residents lived in the same house 1 year ago. Out of people who lived in different houses, 59% moved from this county. Out of people who lived in different houses, 23% moved from different county within same state. Out of people who lived in different houses, 11% moved from different state. Out of people who lived in different houses, 3% moved from abroad.
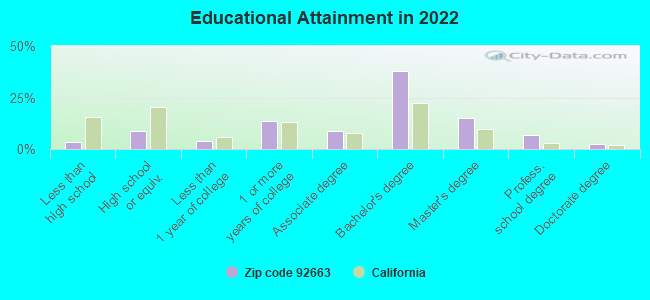
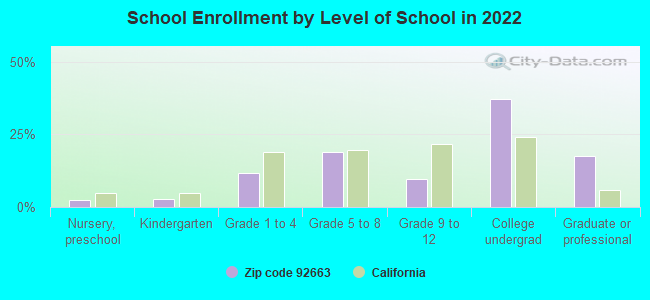
Private vs. public school enrollment:
Students in private schools in grades 1 to 8 (elementary and middle school): 395
Here:
34.8%
California:
10.5%
Students in private schools in grades 9 to 12 (high school): 42
Here:
12.1%
California:
8.5%
Students in private undergraduate colleges: 308
Here:
22.7%
California:
15.9%
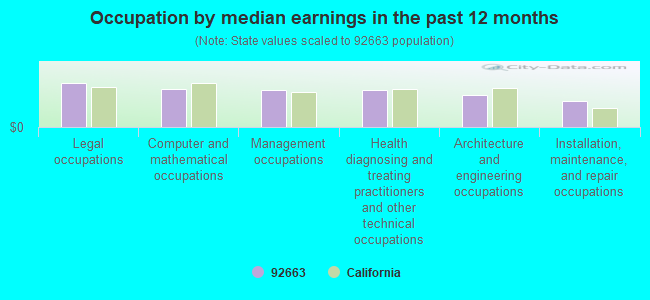
Occupation by median earnings in the past 12 months ($)
151,311Legal occupations
132,931Computer and mathematical occupations
128,832Management occupations
128,721Health diagnosing and treating practitioners and other technical occupations
112,316Architecture and engineering occupations
91,497Installation, maintenance, and repair occupations
Companies with biggest federal contracts located in this zip code (NEWPORT BEACH, CA):
BAKHTAR ASSOCIATES (3420 VIA OPORTO, SUITE 201; small business) : $3,231,348 in 9 contractsfrom 2000 to 2004
Contracts for Other Defense -- Applied Research and Exploratory Development (R&D), Ammunition -- Basic Research (R&D), Weapons -- Applied Research and Exploratory Development (R&D), Other Research and Development -- Basic Research (R&D) by Department of Defense, Air Force, Defense Threat Reduction Agency Signed by year:2000: $540,142; 2001: $145,361; 2002: $1,217,339; 2003: $990,745; 2004: $337,761; 2005: $0; 2006: $0.
Biggest contracts:
$990,745 with Department of Defense for Other Defense -- Applied Research and Exploratory Development (R&D). Signed on 2003-09-30. Completion date: 2004-06-04.
$467,655, same as above.Signed on 2002-09-23. Completion date: 2003-09-30.
$374,842 with Air Force for Ammunition -- Basic Research (R&D). Signed on 2002-12-23. Completion date: 2004-06-29.
$374,842, same as above.Signed on 2002-03-22. Completion date: 2004-06-25.
C & H HYDRAULICS, INC (1585 MONROVIA AVE; small business) : $2,240,069 in 30 contractsfrom 2000 to 2006
Contracts for Aircraft Hydraulic, Vacuum, and De-icing System Components, Switches, Launchers, Guided Missile, Airframe Structural Components, and moreby Air Force, Defense Logistics Agency, Army Signed by year:2000: $439,310; 2001: $523,598; 2002: $136,897; 2003: $0; 2004: $235,668; 2005: $831,390; 2006: $73,206.
Biggest contracts:
$339,794 with Air Force for Aircraft Hydraulic, Vacuum, and De-icing System Components. Signed on 2005-02-01. Completion date: 2006-01-31.
$287,510 with Defense Logistics Agency for Switches. Signed on 2005-04-12. Completion date: 2005-11-02.
$240,488 with Army for Launchers, Guided Missile. Signed on 2000-03-06. Completion date: 2000-09-19.
$216,440, same as above.Signed on 2001-02-07. Completion date: 2000-08-30.
MICROCIRC ASSOCIATES (102 SCHOLZ PLAZA; small business) : $849,998 in 3 contractsfrom 2001 to 2003
$375,000 with Air Force for Defense Missile and Space Systems -- Basic Research (R&D). Signed on 2003-01-31. Completion date: 2004-12-15.
$375,000, same as above.Signed on 2002-09-25. Completion date: 2004-12-15.
$99,998 with Air Force for Defense Aircraft -- Basic Research (R&D). Signed on 2001-04-26. Completion date: 2002-03-09.
ERCAN PARA-SUPPLIES / ERCAN IN (3345 NEWPORT BLVD STE#203; small business)
$604,202 with Army for Parachutes; Aerial Pick Up, Delivery, Recovery Systems; and Cargo Tie Down Equipment. Signed on 2003-06-12. Completion date: 2003-06-28.
RAYTHEON COMPANY (500 SUPERIOR AVE) : $328,522 in 4 contractsfrom 1999 to 2000
$118,640 with Defense Logistics Agency for Microcircuits, Electronic. Signed on 2000-02-11. Completion date: 2000-03-27.
$100,000 with Department of Defense for Engineering and Technical Services. Signed on 2000-04-25. Completion date: 2000-03-30.
$81,882 with Defense Logistics Agency for Microcircuits, Electronic. Signed on 1999-11-03. Completion date: 2000-05-31.
$28,000, same as above.Signed on 2000-04-11. Completion date: 2000-05-11.
RAYTHEON COMPANY (500 SUPERIOR AVENUE)
$99,170 with Defense Logistics Agency for Microcircuits, Electronic. Signed on 2001-07-20. Completion date: 2002-09-23.
CORPORATE TECHNOLOGY DIRECT (315 LINDO AVE; small business)
$75,075 with Air Force for ADP Components. Signed on 2001-07-24. Completion date: 2001-07-24.
WP BEVERAGE PARTNERS LLC (2801 W COAST HWY STE 370; small business) : $20,503 in 2 contractsfrom 2005 to 2006
$15,189 with Defense Commissary Agency for Non-Food Items For Resale. Signed on 2006-01-01. Completion date: 2006-03-31.
$5,314, same as above.Signed on 2005-10-01. Completion date: 2005-12-31.
BAILEY, COLLEEN (280 CAGNEY LANE 202; small business)
$10,560 with Navy for Educational Services. Signed on 2005-06-03. Completion date: 2005-08-19.
ALCOM MARINE ELECTRONICS, INC (151 SHIPYARD WAY STE 4; small business)
$5,984 with Navy for Radio and Television Communication Equipment, Except Airborne. Signed on 2003-08-29. Completion date: 2003-09-18.
Top industries in this zip code by the number of employees in 2005:
2005 - 2018 National Fire Incident Reporting System (NFIRS) incidents
Based on the data from the years 2005 - 2018 the average number of fires per year is 32. The highest number of fires - 77 took place in 2006, and the least - 3 in 2010. The data has a growing trend.
When looking into fire subcategories, the most incidents belonged to: Structure Fires (57.8%), and Outside Fires (21.9%).
Fire incident types reported to NFIRS in Zip Code 92663


 Nearest zip codes: 92627, 92661, 92662, 92646, 92626, 92660.
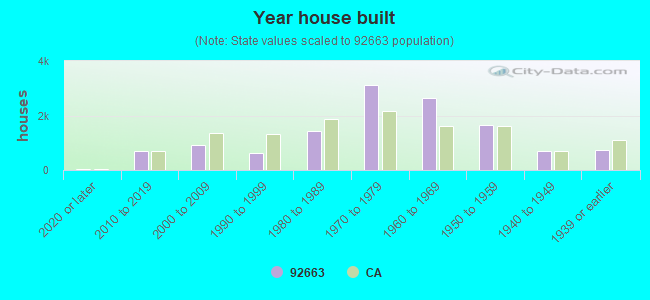


 Based on the data from the years 2005 - 2018 the average number of fires per year is 32. The highest number of fires - 77 took place in 2006, and the least - 3 in 2010. The data has a growing trend.
 When looking into fire subcategories, the most incidents belonged to: Structure Fires (57.8%), and Outside Fires (21.9%).