Estimated zip code population in 2022: 21,102 Zip code population in 2010: 20,589 Zip code population in 2000: 21,624
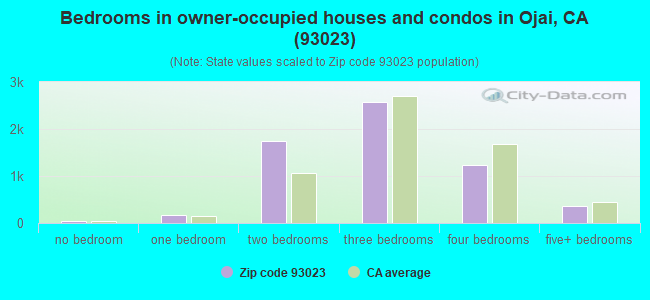
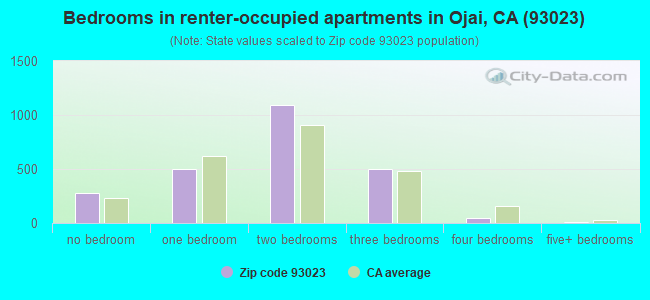
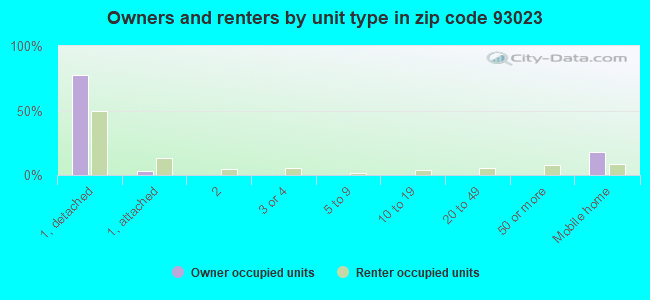
Houses and condos: 9,543 Renter-occupied apartments: 2,423
% of renters here:
28%
State:
44%
March 2022 cost of living index in zip code 93023: 94.4 (less than average, U.S. average is 100)
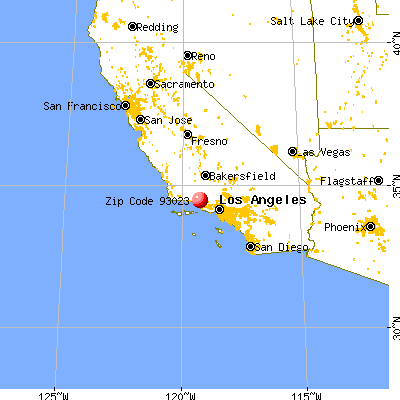
Land area: 269.5 sq. mi. Water area: 1.0 sq. mi.
Population density: 78 people per square mile
(very low).
OSM Map
General Map
Google Map
MSN Map
OSM Map
General Map
Google Map
MSN Map
OSM Map
General Map
Google Map
MSN Map
OSM Map
General Map
Google Map
MSN Map
Please wait while loading the map...
Real estate property taxes paid for housing units in 2022:
This zip code:
0.7% ($6,096)
California:
0.7% ($4,831)
Median real estate property taxes paid for housing units with mortgages in 2022: $6,953 (0.7%) Median real estate property taxes paid for housing units with no mortgage in 2022: $4,748 (0.6%)
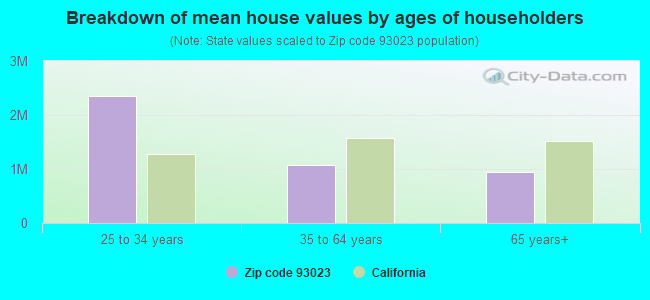
Estimated median house/condo value in 2022: $900,386
93023:
$900,386
California:
$715,900
According to our research of California and other state lists, there were 5 registered sex offenders living in 93023 zip code as of April 27, 2024. The ratio of all residents to sex offenders in zip code 93023 is 4,091 to 1. The ratio of registered sex offenders to all residents in this zip code is much lower than the state average.
Median resident age:
This zip code:
52.7 years
California median age:
37.9 years
Average household size:
This zip code:
2.4 people
California:
2.8 people
Averages for the 2020 tax year for zip code 93023, filed in 2021:
Average Adjusted Gross Income (AGI) in 2020: $105,811 (Individual Income Tax Returns)
Here:
$105,811
State:
$95,910
Salary/wage: $73,947 (reported on 67.7% of returns)
Here:
$73,947
State:
$77,331
(% of AGI for various income ranges: 1199.9% for AGIs below $25k, 3744.7% for AGIs $25k-50k, 6734.2% for AGIs $50k-75k, 9990.9% for AGIs $75k-100k, 18655.4% for AGIs $100k-200k, 96256.7% for AGIs over 200k)
Taxable interest for individuals: $3,180 (reported on 43.8% of returns)
This zip code:
$3,180
California:
$2,294
(% of AGI for various income ranges: 34.1% for AGIs below $25k, 61.6% for AGIs $25k-50k, 98.8% for AGIs $50k-75k, 156.1% for AGIs $75k-100k, 366.4% for AGIs $100k-200k, 3969.5% for AGIs over 200k)
Ordinary dividends: $15,359 (reported on 30.3% of returns)
Here:
$15,359
State:
$10,949
(% of AGI for various income ranges: 92.2% for AGIs below $25k, 172.5% for AGIs $25k-50k, 340.3% for AGIs $50k-75k, 628.9% for AGIs $75k-100k, 1003.3% for AGIs $100k-200k, 14069.5% for AGIs over 200k)
Net capital gain/loss in AGI: +$49,285 (reported on 29.5% of returns)
Here:
+$49,285
State:
+$49,306
(% of AGI for various income ranges: 43.9% for AGIs below $25k, 130.8% for AGIs $25k-50k, 327.5% for AGIs $50k-75k, 543.7% for AGIs $75k-100k, 1436.5% for AGIs $100k-200k, 59080.0% for AGIs over 200k)
Profit/loss from business: +$24,389 (reported on 26.2% of returns)
Here:
+$24,389
State:
+$15,671
(% of AGI for various income ranges: 321.8% for AGIs below $25k, 504.1% for AGIs $25k-50k, 935.1% for AGIs $50k-75k, 1040.9% for AGIs $75k-100k, 2336.8% for AGIs $100k-200k, 11292.4% for AGIs over 200k)
Taxable individual retirement arrangement distribution: $25,427 (reported on 12.6% of returns)
93023:
$25,427
California:
$23,505
(% of AGI for various income ranges: 93.7% for AGIs below $25k, 154.9% for AGIs $25k-50k, 429.0% for AGIs $50k-75k, 714.6% for AGIs $75k-100k, 1248.0% for AGIs $100k-200k, 6143.3% for AGIs over 200k)
Self-employed (Keogh) retirement plans: $25,650 (reported on 1.6% of returns)
93023:
$25,650
California:
$30,163
(% of AGI for various income ranges: 61.9% for AGIs $50k-75k, 139.6% for AGIs $100k-200k, 1292.4% for AGIs over 200k)
Total itemized deductions: $40,566 (reported on 19.6% of returns)
Here:
$40,566
State:
$39,517
(% of AGI for various income ranges: 199.2% for AGIs below $25k, 354.2% for AGIs $25k-50k, 854.6% for AGIs $50k-75k, 1483.7% for AGIs $75k-100k, 2994.5% for AGIs $100k-200k, 17364.3% for AGIs over 200k)
Charity contributions: $13,570 (reported on 16.4% of returns)
Here:
$13,570
State:
$12,598
(% of AGI for various income ranges: 10.3% for AGIs below $25k, 29.2% for AGIs $25k-50k, 102.3% for AGIs $50k-75k, 148.7% for AGIs $75k-100k, 353.3% for AGIs $100k-200k, 8212.9% for AGIs over 200k)
Taxes paid: $8,625 (reported on 19.5% of returns)
93023:
$8,625
State:
$8,807
(% of AGI for various income ranges: 41.2% for AGIs below $25k, 82.5% for AGIs $25k-50k, 221.0% for AGIs $50k-75k, 375.7% for AGIs $75k-100k, 810.6% for AGIs $100k-200k, 2786.7% for AGIs over 200k)
Earned income credit: $1,651 (reported on 10.4% of returns)
Here:
$1,651
State:
$2,074
(% of AGI for various income ranges: 65.4% for AGIs below $25k, 56.5% for AGIs $25k-50k)
Percentage of individuals using paid preparers for their 2020 taxes: 93.1%
Here:
93%
State:
92%
(% for various income ranges: 90.6% for AGIs below $25k, 92.5% for AGIs $25k-50k, 93.8% for AGIs $50k-75k, 93.5% for AGIs $75k-100k, 95.7% for AGIs $100k-200k, 96.0% for AGIs over 200k)
Averages for the 2012 tax year for zip code 93023, filed in 2013:
Average Adjusted Gross Income (AGI) in 2012: $82,070 (Individual Income Tax Returns)
Here:
$82,070
State:
$72,726
Salary/wage: $55,954 (reported on 71.2% of returns)
Here:
$55,954
State:
$59,079
(% of AGI for various income ranges: 63.0% for AGIs below $25k, 66.6% for AGIs $25k-50k, 61.4% for AGIs $50k-75k, 60.8% for AGIs $75k-100k, 60.6% for AGIs $100k-200k, 30.5% for AGIs over 200k)
Taxable interest for individuals: $2,875 (reported on 44.0% of returns)
This zip code:
$2,875
California:
$2,146
(% of AGI for various income ranges: 2.0% for AGIs below $25k, 1.5% for AGIs $25k-50k, 1.6% for AGIs $50k-75k, 1.3% for AGIs $75k-100k, 1.4% for AGIs $100k-200k, 1.6% for AGIs over 200k)
Ordinary dividends: $8,496 (reported on 27.1% of returns)
Here:
$8,496
State:
$9,308
(% of AGI for various income ranges: 3.6% for AGIs below $25k, 2.3% for AGIs $25k-50k, 2.9% for AGIs $50k-75k, 2.5% for AGIs $75k-100k, 2.7% for AGIs $100k-200k, 2.9% for AGIs over 200k)
Net capital gain/loss in AGI: +$29,071 (reported on 25.1% of returns)
Here:
+$29,071
State:
+$30,460
(% of AGI for various income ranges: 0.6% for AGIs $25k-50k, 0.9% for AGIs $50k-75k, 1.4% for AGIs $75k-100k, 3.3% for AGIs $100k-200k, 18.4% for AGIs over 200k)
Profit/loss from business: +$22,936 (reported on 25.7% of returns)
Here:
+$22,936
State:
+$17,064
(% of AGI for various income ranges: 15.8% for AGIs below $25k, 9.4% for AGIs $25k-50k, 8.2% for AGIs $50k-75k, 7.5% for AGIs $75k-100k, 7.1% for AGIs $100k-200k, 5.4% for AGIs over 200k)
Taxable individual retirement arrangement distribution: $19,438 (reported on 13.2% of returns)
93023:
$19,438
California:
$19,557
(% of AGI for various income ranges: 4.0% for AGIs below $25k, 3.0% for AGIs $25k-50k, 3.3% for AGIs $50k-75k, 3.8% for AGIs $75k-100k, 3.8% for AGIs $100k-200k, 2.5% for AGIs over 200k)
Self-employment retirement plans: $23,133 (reported on 1.6% of returns)
93023:
$23,133
California:
$24,530
(% of AGI for various income ranges: 0.5% for AGIs below $25k, 0.3% for AGIs $50k-75k, 0.6% for AGIs $100k-200k, 0.6% for AGIs over 200k)
Total itemized deductions: $38,012 (25% of AGI, reported on 41.7% of returns)
Here:
$38,012
State:
$34,004
Here:
24.6% of AGI
State:
22.7% of AGI
(% of AGI for various income ranges: 18.8% for AGIs below $25k, 15.4% for AGIs $25k-50k, 18.8% for AGIs $50k-75k, 20.1% for AGIs $75k-100k, 22.1% for AGIs $100k-200k, 18.6% for AGIs over 200k)
Charity contributions: $4,494 (reported on 35.1% of returns)
Here:
$4,494
State:
$4,659
(% of AGI for various income ranges: 0.9% for AGIs below $25k, 1.1% for AGIs $25k-50k, 1.5% for AGIs $50k-75k, 1.8% for AGIs $75k-100k, 2.0% for AGIs $100k-200k, 2.3% for AGIs over 200k)
Taxes paid: $15,010 (reported on 41.4% of returns)
93023:
$15,010
State:
$14,448
(% of AGI for various income ranges: 3.5% for AGIs below $25k, 3.6% for AGIs $25k-50k, 4.7% for AGIs $50k-75k, 6.2% for AGIs $75k-100k, 8.2% for AGIs $100k-200k, 9.5% for AGIs over 200k)
Earned income credit: $1,721 (reported on 13.0% of returns)
Here:
$1,721
State:
$2,286
(% of AGI for various income ranges: 4.0% for AGIs below $25k, 0.7% for AGIs $25k-50k)
Percentage of individuals using paid preparers for their 2012 taxes: 66.0%
Here:
66%
State:
64%
(% for various income ranges: 56.6% for AGIs below $25k, 66.3% for AGIs $25k-50k, 68.8% for AGIs $50k-75k, 73.3% for AGIs $75k-100k, 73.9% for AGIs $100k-200k, 86.0% for AGIs over 200k)
Averages for the 2004 tax year for zip code 93023, filed in 2005:
Average Adjusted Gross Income (AGI) in 2004: $63,377 (Individual Income Tax Returns)
Here:
$63,377
State:
$58,600
Salary/wage: $47,886 (reported on 72.3% of returns)
Here:
$47,886
State:
$49,455
(% of AGI for various income ranges: 63.3% for AGIs $10k-25k, 66.1% for AGIs $25k-50k, 67.8% for AGIs $50k-75k, 70.5% for AGIs $75k-100k, 42.6% for AGIs over 100k)
Taxable interest for individuals: $3,015 (reported on 54.6% of returns)
This zip code:
$3,015
California:
$2,365
(% of AGI for various income ranges: 4.6% for AGIs $10k-25k, 2.9% for AGIs $25k-50k, 2.1% for AGIs $50k-75k, 1.5% for AGIs $75k-100k, 2.4% for AGIs over 100k)
Taxable dividends: $5,514 (reported on 33.3% of returns)
Here:
$5,514
State:
$4,746
(% of AGI for various income ranges: 3.1% for AGIs $10k-25k, 2.6% for AGIs $25k-50k, 2.4% for AGIs $50k-75k, 1.9% for AGIs $75k-100k, 3.0% for AGIs over 100k)
Net capital gain/loss: +$30,731 (reported on 30.3% of returns)
Here:
+$30,731
State:
+$23,418
(% of AGI for various income ranges: 1.0% for AGIs $10k-25k, 1.1% for AGIs $25k-50k, 1.7% for AGIs $50k-75k, 2.4% for AGIs $75k-100k, 24.5% for AGIs over 100k)
Profit/loss from business: +$20,339 (reported on 25.3% of returns)
Here:
+$20,339
State:
+$16,826
(% of AGI for various income ranges: 12.4% for AGIs $10k-25k, 9.4% for AGIs $25k-50k, 8.3% for AGIs $50k-75k, 9.1% for AGIs $75k-100k, 7.0% for AGIs over 100k)
IRA payment deduction: $3,424 (reported on 4.2% of returns)
93023:
$3,424
California:
$3,192
(% of AGI for various income ranges: 0.3% for AGIs $10k-25k, 0.4% for AGIs $25k-50k, 0.4% for AGIs $50k-75k, 0.3% for AGIs $75k-100k, 0.1% for AGIs over 100k)
Self-employed pension: $15,205 (reported on 2.5% of returns)
Here:
$15,205
California:
$17,688
(% of AGI for various income ranges: 0.1% for AGIs $10k-25k, 0.3% for AGIs $25k-50k, 0.4% for AGIs $50k-75k, 0.6% for AGIs $75k-100k, 0.8% for AGIs over 100k)
Total itemized deductions: $30,179 (26% of AGI, reported on 43.0% of returns)
Here:
$30,179
State:
$28,113
Here:
25.8% of AGI
State:
25.3% of AGI
(% of AGI for various income ranges: 18.5% for AGIs $10k-25k, 19.7% for AGIs $25k-50k, 22.6% for AGIs $50k-75k, 23.4% for AGIs $75k-100k, 18.9% for AGIs over 100k)
Charity contributions deductions: $3,682 (3% of AGI, reported on 38.5% of returns)
Here:
$3,682
State:
$3,923
Here:
3.0% of AGI
State:
3.3% of AGI
(% of AGI for various income ranges: 1.4% for AGIs $10k-25k, 1.7% for AGIs $25k-50k, 2.2% for AGIs $50k-75k, 2.7% for AGIs $75k-100k, 2.3% for AGIs over 100k)
Total tax: $11,232 (reported on 79.0% of returns)
93023:
$11,232
State:
$10,761
(% of AGI for various income ranges: 5.2% for AGIs $10k-25k, 7.7% for AGIs $25k-50k, 9.2% for AGIs $50k-75k, 10.3% for AGIs $75k-100k, 17.9% for AGIs over 100k)
Earned income credit: $1,440 (reported on 11.4% of returns)
Here:
$1,440
State:
$1,763
Percentage of individuals using paid preparers for their 2004 taxes: 69.3%
Here:
69%
State:
66%
(% for various income ranges: 59.7% for AGIs below $10k, 64.2% for AGIs $10k-25k, 70.2% for AGIs $25k-50k, 74.8% for AGIs $50k-75k, 73.6% for AGIs $75k-100k, 81.4% for AGIs over 100k)
Likely homosexual households (counted as self-reported same-sex unmarried-partner households)
Lesbian couples: 0.2% of all households
Gay men: 0.1% of all households
Household received Food Stamps/SNAP in the past 12 months: 637 Household did not receive Food Stamps/SNAP in the past 12 months: 7,803
Women who had a birth in the past 12 months: 244 (198 now married, 45 unmarried) Women who did not have a birth in the past 12 months: 3,647 (1,185 now married, 2,473 unmarried)
Housing units in zip code 93023 with a mortgage: 3,156 (356 second mortgage, 4 home equity loan, 303 both second mortgage and home equity loan) Houses without a mortgage: 35
Median monthly owner costs for units with a mortgage: $3,045 Median monthly owner costs for units without a mortgage: $966
Residents with income below the poverty level in 2022:
This zip code:
9.8%
Whole state:
12.2%
Residents with income below 50% of the poverty level in 2022:
This zip code:
3.7%
Whole state:
6.2%
Median number of rooms in houses and condos:
Here:
5.7
State:
6.0
Median number of rooms in apartments:
Here:
4.0
State:
3.9
Notable locations in this zip code not listed on our city pages
Notable locations in zip code 93023: Oak Flat Campground (A), Horsetheif (B), Ladybug Campsite (C), Ortega Rustic Campsite (D), Jackson Camp (E), Last Chance Camp (F), Circle B Ranch (G), Camp Comfort (H), Rancho Grande (I), Rancho Matilija (J), Soule Golf Course (K), Gymkhana Area (L), Ventura County Honor Farm (M), Ojai Refuse Transfer Station (N), Camp W (O), Camp Ramah (P), Camp O (Q), Camp M (R), Camp K (S), Camp J (T). Display/hide their locations on the map
Churches in zip code 93023 include: Church of the Living God (A), First Missionary Baptist Church (B), The Church of Jesus Christ of Latter Day Saints (C), Friends Worship (D), Ojai Presbyterian Church (E), Ojai Valley Foursquare Church (F), Ojai United Methodist Church (G), Saint Andrews Episcopal Church (H), Science of Mind Church (I). Display/hide their locations on the map
Lakes and reservoirs: Mirror Lake (A), Lower Rose Lake (B), Upper Rose Lake (C), Matilija Lake (D), Lion Canyon Reservoir (E), Murietta Dam (F), Senior Canyon Reservoir (G). Display/hide their locations on the map
Creeks: North Fork Santa Ana Creek (A), East Fork Coyote Creek (B), Derrydale Creek (C), Cherry Creek (D), Matilija Creek (E), Lion Creek (F), Burro Creek (G), Adobe Creek (H), Howard Creek (I). Display/hide their locations on the map
Parks in zip code 93023 include: Camp Comfort Park (1), Soule County Park (2), Soule Recreation Area (3), Daly Ranch Park (4), Libbey Park (5), Dennison Park (6), Sarzotti Park (7). Display/hide their locations on the map
1,810 married couples with children.
963 single-parent households (400 men, 563 women).
77.6% of residents of 93023 zip code speak English at home.
17.7% of residents speak Spanish at home (58% very well, 17% well, 17% not well, 8% not at all).
4.0% of residents speak other Indo-European language at home (87% very well, 11% well, 2% not well).
1.0% of residents speak Asian or Pacific Island language at home (71% very well, 26% well, 3% not well).
0.3% of residents speak other language at home (31% very well, 25% well, 45% not well).
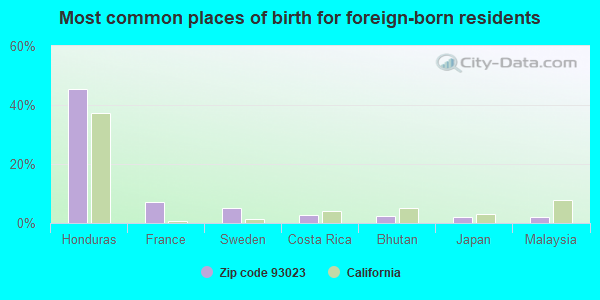
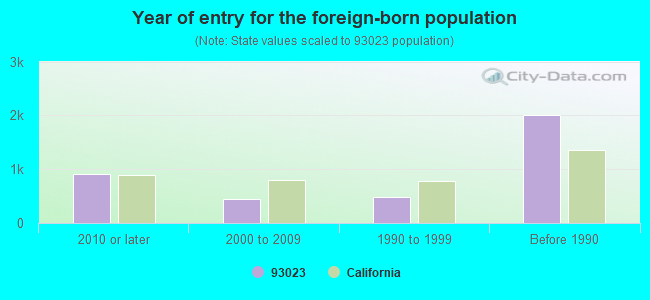
Foreign born population: 3,630 (17.2%) (53.5% of them are naturalized citizens)
This zip code:
17.2%
Whole state:
26.7%
45%Honduras
7%France
5%Sweden
3%Costa Rica
2%Bhutan
2%Japan
2%Malaysia
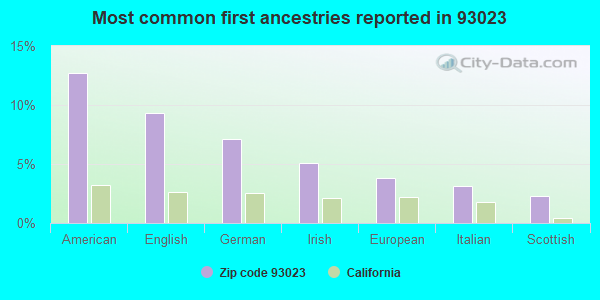
13%American
9%English
7%German
5%Irish
4%European
3%Italian
2%Scottish
Year of entry for the foreign-born population
9112010 or later
4442000 to 2009
4791990 to 1999
2,009Before 1990
Major facilities with environmental interests located in this zip code:
JOHN F. APPEL PROPERTY (111 OLD CREEK RD in OJAI, CA)
ENFORCEMENT/COMPLIANCE ACTIVITY (Integrated Compliance Information System) - ICIS-09-1994-0043, FORMAL ENFORCEMENT ACTION (Integrated Compliance Information System) - ICIS-09-1994-0043, FORMAL ENFORCEMENT ACTION Business SIC classification: ORNAMENTAL SHRUB AND TREE SERVICES
CALTRANS DISTRICT 7 (1116 MARICOPA HYW in OJAI, CA) . Federal Facility
STATE MASTER (California - Hazardous Waste Tracking) - HAZARDOU WASTE PROGRAM Small Quantity Generators, between 100 kg and 1000 kg of hazardous waste/month (Resource Conservation and Recovery Act (tracking hazardous waste)) - notification Alternative names: OJAI MAINT STATION
MATILIJA JUNIOR HIGH (703 EL PASEO ROAD in OJAI, CA)
(National Center for Education Statistics) - STATE ID-6060339 Organizations: OJAI UNIFIED (SCHOOL DISTRICT)
MEINERS OAKS ELEMENTARY (400 S. LOMITA AVE. in OJAI, CA)
(National Center for Education Statistics) - STATE ID-6055198 Organizations: OJAI UNIFIED (SCHOOL DISTRICT)
CHAPARRAL HIGH (CONT.) (114 N. MONTGOMERY in OJAI, CA)
(National Center for Education Statistics) - STATE ID-5631817 Organizations: OJAI UNIFIED (SCHOOL DISTRICT)
MIRA MONTE ELEMENTARY (1216 LOMA DR. in OJAI, CA)
(National Center for Education Statistics) - STATE ID-6055206 Organizations: OJAI UNIFIED (SCHOOL DISTRICT)
NORDHOFF HIGH (1401 MARICOPA HWY. in OJAI, CA)
(National Center for Education Statistics) - STATE ID-5634076 Organizations: OJAI UNIFIED (SCHOOL DISTRICT)
HAPPY VALLEY SCHOOL (8585 OJAI-SANTA PAULA RD in OJAI, CA)
COMPLIANCE ACTIVITY (Tracking inspections of insecticide, fungicide, and rodenticide, and toxic substances) Small Quantity Generators, between 100 kg and 1000 kg of hazardous waste/month (Resource Conservation and Recovery Act (tracking hazardous waste)) - notification Organizations: HAPPY VALLEY FOUNDATION (CONTACT/OWNER)
ARCHITECTURAL IRON WORKS INC (406 BRYANT CIR in OJAI, CA)
(Resource Conservation and Recovery Act (tracking hazardous waste)) Organizations: JIM MILLER (CONTACT/OWNER)
ARCHITECTURAL IRON WORKS INC (510 E OJAI AVE in OJAI, CA)
(Resource Conservation and Recovery Act (tracking hazardous waste)) Organizations: JAMES MILLER (CONTACT/OWNER)
INDUSTRIAL TOOLS INC (201 BRYANT STT in OJAI, CA)
Small Quantity Generators, between 100 kg and 1000 kg of hazardous waste/month (Resource Conservation and Recovery Act (tracking hazardous waste)) - notification Business NAICS classification: MACHINE TOOL (METAL CUTTING TYPES) MANUFACTURING. Organizations: WR NIELSON (CONTACT/OWNER)
CHEVRON STATION 90478 (360 E OJAI AVE in OJAI, CA)
Small Quantity Generators, between 100 kg and 1000 kg of hazardous waste/month (Resource Conservation and Recovery Act (tracking hazardous waste)) - notification Organizations: CHEVRON U S A PRODUCTS CO (CONTACT/OWNER)
Alternative names: 90478 CHEVRON STATION
MAVERICK OIL (SCHROEDER-SULPHUR MOUNTAIN RD. in OJAI, CA)
CRITERIA AND HAZARDOUS AIR POLLUTANT INVENTORY (Inventory of air pollution sources) Business SIC classification: CRUDE PETROLEUM AND NATURAL GAS Alternative names: BENTLEY / SIMONSON INC.
Housing units lacking complete plumbing facilities: 3.8% Housing units lacking complete kitchen facilities: 3.2%
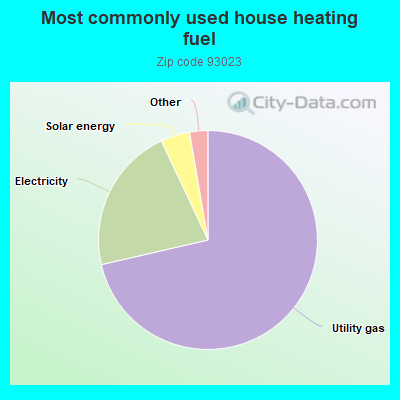
71.4%Utility gas
21.6%Electricity
4.3%Solar energy
1.0%Bottled, tank, or LP gas
0.9%No fuel used
0.7%Wood
Population in 1990: 22,778.
Place of birth for U.S.-born residents:
This state: 11,578
Northeast: 1,600
Midwest: 1,764
South: 1,344
West: 854
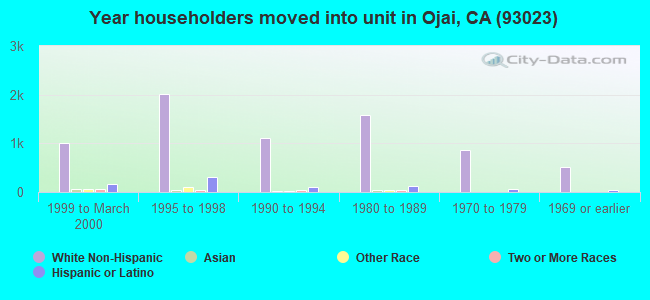
57% of the 93023 zip code residents lived in the same house 5 years ago. Out of people who lived in different houses, 66% lived in this county. Out of people who lived in different counties, 50% lived in California.
90% of the 93023 zip code residents lived in the same house 1 year ago. Out of people who lived in different houses, 53% moved from this county. Out of people who lived in different houses, 40% moved from different county within same state. Out of people who lived in different houses, 4% moved from different state. Out of people who lived in different houses, 3% moved from abroad.
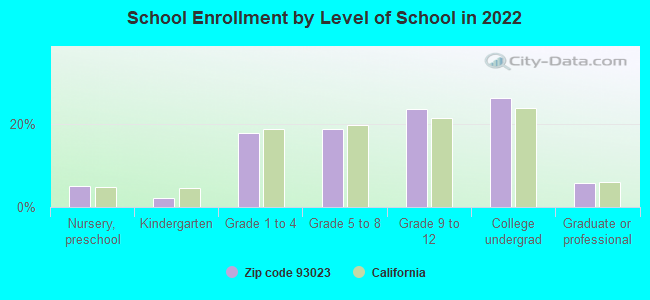
Private vs. public school enrollment:
Students in private schools in grades 1 to 8 (elementary and middle school): 558
Here:
37.5%
California:
10.5%
Students in private schools in grades 9 to 12 (high school): 124
Here:
13.3%
California:
8.5%
Students in private undergraduate colleges: 204
Here:
19.7%
California:
15.9%
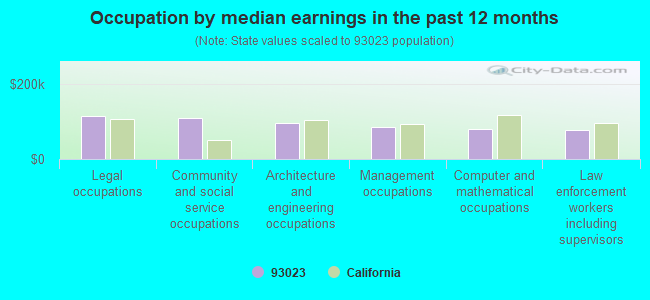
Occupation by median earnings in the past 12 months ($)
115,041Legal occupations
109,478Community and social service occupations
97,080Architecture and engineering occupations
85,777Management occupations
80,511Computer and mathematical occupations
78,359Law enforcement workers including supervisors
Companies with biggest federal contracts located in this zip code:
GEO INSIGHT INTERNATIONAL, INC (323 E MATILIJA ST STE 215 in OJAI, CA; small business) : $8,174,270 in 75 contractsfrom 1999 to 2006
Contracts for Other ADP and Telecommunications Services (includes data storage on tapes, compact disks, etc.), Digitizing Services. Includes cartographic and geographic information., ADP Systems Analysis Services, ADPE System Configuration, and moreby Federal Technology Service, Office of Policy, Management and Budget/Chief Financial Officer, Navy, Bureau of Land Management, and others Signed by year:2000: $3,078,480; 2001: $3,022,606; 2002: $423,101; 2003: $78,429; 2004: $178,450; 2005: -$14,284; 2006: -$6,004.
Biggest contracts:
$700,000 with Federal Technology Service for Other ADP and Telecommunications Services (includes data storage on tapes, compact disks, etc.). Signed on 2001-12-15. Completion date: 2002-12-15.
$661,000 with Federal Technology Service for Digitizing Services. Includes cartographic and geographic information.. Signed on 1999-10-15. Completion date: 2000-03-15.
$478,000 with Federal Technology Service for ADP Systems Analysis Services. Taking place in VA. Signed on 2000-11-15. Completion date: 2001-12-15.
$347,000 with Federal Technology Service for ADPE System Configuration. Signed on 2001-01-15. Completion date: 2001-09-15.
HATCH WORLDWIDE IMPORTS (1440 SAN GABRIEL ST in OJAI, CA) : $2,825,140 in 6 contractsin 2004
Contracts for Clothing, Special Purpose, R&D-TEXTILES,CLOTHING,ETC-COMERCLIZ by Army Signed by year:2000: $0; 2001: $0; 2002: $0; 2003: $0; 2004: $2,825,140; 2005: $0; 2006: $0.
Biggest contracts:
$1,400,000 with Army for Clothing, Special Purpose. Signed on 2004-07-23. Completion date: 2005-09-22.
$1,400,000, same as above.Signed on 2004-09-15. Completion date: 2006-05-22.
$21,840, same as above.Signed on 2004-09-15. Completion date: 2004-11-15.
$1,800 with Army for R&D-TEXTILES,CLOTHING,ETC-COMERCLIZ. Signed on 2004-09-23. Completion date: 2004-10-25.
SITTEL CORPORATION (1206 FOOTHILL RD in OJAI, CA; small business) : $541,462 in 6 contractsfrom 2000 to 2005
Contracts for Services -- Advanced Development (R&D), Other Defense -- Applied Research and Exploratory Development (R&D), Other Professional Services by Navy Signed by year:2000: $102,160; 2001: $412,506; 2002: $0; 2003: $0; 2004: $0; 2005: $26,796; 2006: $0.
Biggest contracts:
$174,991 with Navy for Services -- Advanced Development (R&D). Signed on 2001-01-10. Completion date: 2001-09-30.
$105,693, same as above.Signed on 2001-09-26. Completion date: 2002-04-20.
$102,160, same as above.Signed on 2000-05-15. Completion date: 2000-09-30.
$66,822, same as above.Signed on 2001-03-12. Completion date: 2001-09-30.
BUCHANAN PRECISION MACHINE (2040 LOS ENCINOS RD in OJAI, CA; small business) : $78,690 in 9 contractsfrom 2004 to 2006
Contracts for Hardware, Commercial, Winches, Hoists, Cranes, and Derricks, Bushings, Rings, Shims, and Spacers, Maintenance, Repair and Rebuilding of Equipment -- Materials Handling Equipment, and moreby Navy Signed by year:2000: $0; 2001: $0; 2002: $0; 2003: $0; 2004: $2,500; 2005: $46,440; 2006: $29,750.
Biggest contracts:
$29,750 with Navy for Hardware, Commercial. Signed on 2006-05-18. Completion date: 2006-07-18.
$17,775, same as above.Signed on 2005-02-18. Completion date: 2005-04-14.
$11,550 with Navy for Winches, Hoists, Cranes, and Derricks. Signed on 2005-09-25. Completion date: 2005-11-04.
$5,640 with Navy for Bushings, Rings, Shims, and Spacers. Signed on 2005-09-27. Completion date: 2005-11-14.
CLARK OLIVE RANCH (10990 CREEK ROAD in OJAI, CA; small business) : $65,008 in 2 contractsfrom 2000 to 2001
$32,508 with Navy for Other Professional Services. Signed on 2001-09-17. Completion date: 2004-09-30.
$32,500 with Navy for Lease or Rental of Facilities -- Religious Facilities. Signed on 2000-10-01. Completion date: 2001-09-30.
WEYRICH, WAYNE & NIELSON & SON (621 OJAI AVE in OJAI, CA; small business) : $55,000 in 3 contractsfrom 1999 to 2000
$47,000 with Forest Service (disused code: now 12C2) for Lease or Rental of Facilities -- Other Administrative Facilities and Service Buildings. Signed on 1999-10-15. Completion date: 2000-07-15.
$16,000 with Bureau of Land Management for Lease or Rental of Facilities -- Office Buildings. Signed on 1999-10-15. Completion date: 1999-12-15.
-$8,000 with Forest Service (disused code: now 12C2) for Lease or Rental of Facilities -- Other Administrative Facilities and Service Buildings. Signed on 2000-08-15. Completion date: 2000-09-15.
DAVID ALLEN & CO (1674 MCNELL ROAD in OJAI, CA; small business)
$38,000 with Navy for Technical Representation Services -- Aircraft Launching, Landing, and Ground Handling Equipment. Signed on 2002-11-21. Completion date: 2003-08-28.
INDUSTRIAL BOILER SERVICE (940 LOMA DR in OJAI, CA; small business) : $26,372 in 4 contractsfrom 2003 to 2005
$14,260 with Navy for Plumbing Fixtures and Accessories. Signed on 2003-03-07. Completion date: 2003-04-28.
$6,312, same as above.Signed on 2005-09-09. Completion date: 2005-10-14.
$3,500, same as above.Signed on 2005-08-17. Completion date: 2006-08-16.
$2,300, same as above.Signed on 2004-06-18. Completion date: 2004-07-23.
CHARLES LA BRAQUE (713 MERCER AVE in OJAI, CA; small business)
$10,000 with Army for Patent and Trademark Services. Signed on 2004-08-26. Completion date: 2005-02-25.
sHELDON bLOOM (410 Church Road, #38 in Ojai, CA) : $5,700 in 2 contractsfrom 2003 to 2004
$3,000 with Employment and Training Administration for Other Professional Services. Taking place in DC. Signed on 2003-10-17. Completion date: 2004-10-17.
$2,700, same as above.Signed on 2004-02-28. Effective on 2004-02-18. Completion date: 2004-10-16.
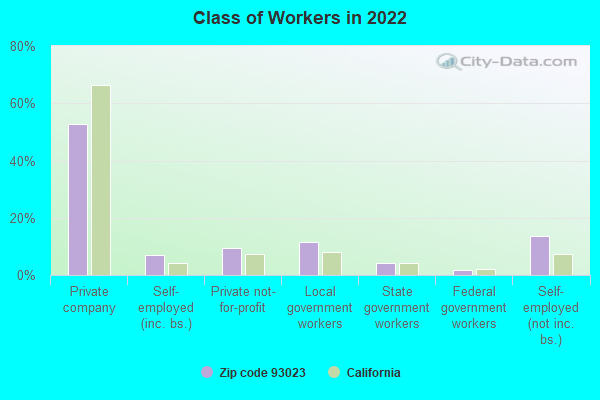
Top industries in this zip code by the number of employees in 2005:
2005 - 2018 National Fire Incident Reporting System (NFIRS) incidents
According to the data from the years 2005 - 2018 the average number of fire incidents per year is 54. The highest number of reported fire incidents - 76 took place in 2018, and the least - 30 in 2006. The data has an increasing trend.
When looking into fire subcategories, the most incidents belonged to: Outside Fires (39.8%), and Structure Fires (28.8%).
Fire incident types reported to NFIRS in Zip Code 93023


 Nearest zip codes: 93022, 93252, 93013, 93060, 93003, 93004.


 According to the data from the years 2005 - 2018 the average number of fire incidents per year is 54. The highest number of reported fire incidents - 76 took place in 2018, and the least - 30 in 2006. The data has an increasing trend.
 When looking into fire subcategories, the most incidents belonged to: Outside Fires (39.8%), and Structure Fires (28.8%).