Estimated zip code population in 2022: 52,902 Zip code population in 2010: 53,217 Zip code population in 2000: 49,970
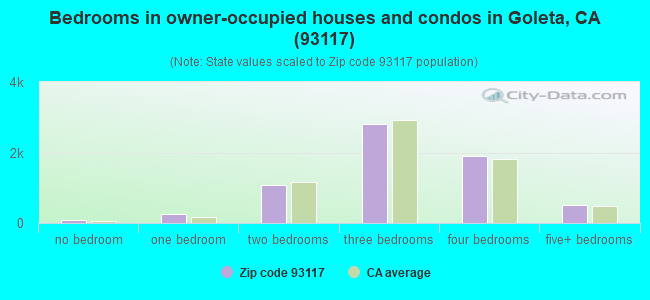
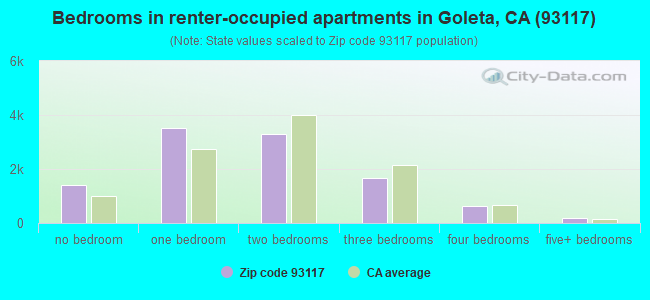
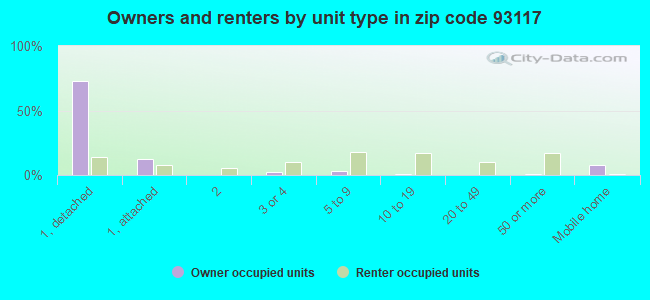
Houses and condos: 18,408 Renter-occupied apartments: 10,668
% of renters here:
62%
State:
44%
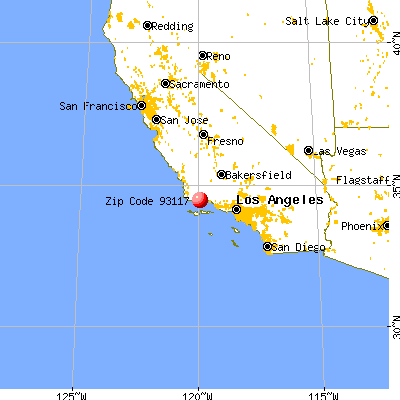
March 2022 cost of living index in zip code 93117: 117.3 (more than average, U.S. average is 100)
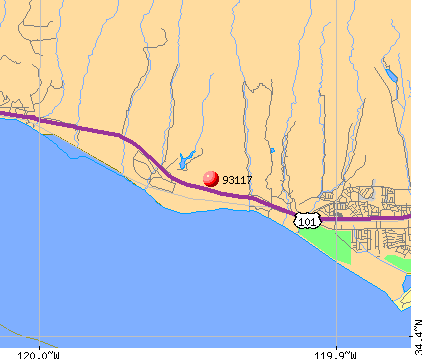
Land area: 170.1 sq. mi. Water area: 1.9 sq. mi.
Population density: 311 people per square mile
(very low).
OSM Map
General Map
Google Map
MSN Map
OSM Map
General Map
Google Map
MSN Map
OSM Map
General Map
Google Map
MSN Map
OSM Map
General Map
Google Map
MSN Map
Please wait while loading the map...
Real estate property taxes paid for housing units in 2022:
This zip code:
0.6% ($5,813)
California:
0.7% ($4,831)
Median real estate property taxes paid for housing units with mortgages in 2022: $7,059 (0.7%) Median real estate property taxes paid for housing units with no mortgage in 2022: $4,094 (0.4%)
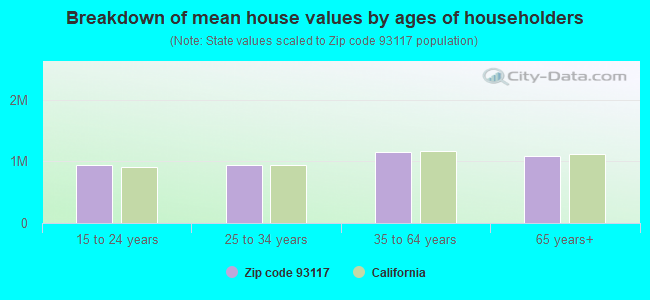
Estimated median house/condo value in 2022: $1,012,445
93117:
$1,012,445
California:
$715,900
According to our research of California and other state lists, there were 28 registered sex offenders living in 93117 zip code as of April 27, 2024. The ratio of all residents to sex offenders in zip code 93117 is 2,075 to 1. The ratio of registered sex offenders to all residents in this zip code is much lower than the state average.
Median resident age:
This zip code:
23.4 years
California median age:
37.9 years
Average household size:
This zip code:
2.7 people
California:
2.8 people
Averages for the 2020 tax year for zip code 93117, filed in 2021:
Average Adjusted Gross Income (AGI) in 2020: $82,715 (Individual Income Tax Returns)
Here:
$82,715
State:
$95,910
Salary/wage: $67,669 (reported on 82.7% of returns)
Here:
$67,669
State:
$77,331
(% of AGI for various income ranges: 1261.6% for AGIs below $25k, 4241.4% for AGIs $25k-50k, 7298.3% for AGIs $50k-75k, 11040.1% for AGIs $75k-100k, 20116.3% for AGIs $100k-200k, 76028.7% for AGIs over 200k)
Taxable interest for individuals: $1,957 (reported on 35.0% of returns)
This zip code:
$1,957
California:
$2,294
(% of AGI for various income ranges: 17.7% for AGIs below $25k, 20.5% for AGIs $25k-50k, 55.2% for AGIs $50k-75k, 84.3% for AGIs $75k-100k, 181.2% for AGIs $100k-200k, 1582.6% for AGIs over 200k)
Ordinary dividends: $6,774 (reported on 25.0% of returns)
Here:
$6,774
State:
$10,949
(% of AGI for various income ranges: 35.0% for AGIs below $25k, 50.9% for AGIs $25k-50k, 130.2% for AGIs $50k-75k, 247.6% for AGIs $75k-100k, 579.7% for AGIs $100k-200k, 3491.3% for AGIs over 200k)
Net capital gain/loss in AGI: +$26,593 (reported on 24.0% of returns)
Here:
+$26,593
State:
+$49,306
(% of AGI for various income ranges: 13.0% for AGIs below $25k, 41.6% for AGIs $25k-50k, 107.8% for AGIs $50k-75k, 298.1% for AGIs $75k-100k, 738.9% for AGIs $100k-200k, 22788.0% for AGIs over 200k)
Profit/loss from business: +$18,523 (reported on 16.9% of returns)
Here:
+$18,523
State:
+$15,671
(% of AGI for various income ranges: 127.3% for AGIs below $25k, 199.3% for AGIs $25k-50k, 303.7% for AGIs $50k-75k, 656.7% for AGIs $75k-100k, 1111.8% for AGIs $100k-200k, 4400.0% for AGIs over 200k)
Taxable individual retirement arrangement distribution: $23,863 (reported on 7.9% of returns)
93117:
$23,863
California:
$23,505
(% of AGI for various income ranges: 43.0% for AGIs below $25k, 77.4% for AGIs $25k-50k, 192.2% for AGIs $50k-75k, 395.1% for AGIs $75k-100k, 927.2% for AGIs $100k-200k, 2364.8% for AGIs over 200k)
Self-employed (Keogh) retirement plans: $22,338 (reported on 1.1% of returns)
93117:
$22,338
California:
$30,163
(% of AGI for various income ranges: 54.6% for AGIs $75k-100k, 98.8% for AGIs $100k-200k, 573.0% for AGIs over 200k)
Total itemized deductions: $37,325 (reported on 14.8% of returns)
Here:
$37,325
State:
$39,517
(% of AGI for various income ranges: 103.5% for AGIs below $25k, 146.6% for AGIs $25k-50k, 465.0% for AGIs $50k-75k, 944.2% for AGIs $75k-100k, 2393.5% for AGIs $100k-200k, 9443.7% for AGIs over 200k)
Charity contributions: $7,522 (reported on 11.9% of returns)
Here:
$7,522
State:
$12,598
(% of AGI for various income ranges: 4.1% for AGIs below $25k, 13.6% for AGIs $25k-50k, 35.0% for AGIs $50k-75k, 117.6% for AGIs $75k-100k, 300.1% for AGIs $100k-200k, 2242.8% for AGIs over 200k)
Taxes paid: $8,846 (reported on 14.8% of returns)
93117:
$8,846
State:
$8,807
(% of AGI for various income ranges: 17.9% for AGIs below $25k, 30.9% for AGIs $25k-50k, 112.1% for AGIs $50k-75k, 278.2% for AGIs $75k-100k, 688.1% for AGIs $100k-200k, 1789.6% for AGIs over 200k)
Earned income credit: $1,624 (reported on 8.1% of returns)
Here:
$1,624
State:
$2,074
(% of AGI for various income ranges: 38.8% for AGIs below $25k, 34.2% for AGIs $25k-50k, 0.9% for AGIs $50k-75k)
Percentage of individuals using paid preparers for their 2020 taxes: 92.2%
Here:
92%
State:
92%
(% for various income ranges: 91.1% for AGIs below $25k, 92.7% for AGIs $25k-50k, 91.6% for AGIs $50k-75k, 92.9% for AGIs $75k-100k, 92.4% for AGIs $100k-200k, 94.2% for AGIs over 200k)
Averages for the 2012 tax year for zip code 93117, filed in 2013:
Average Adjusted Gross Income (AGI) in 2012: $64,902 (Individual Income Tax Returns)
Here:
$64,902
State:
$72,726
Salary/wage: $52,631 (reported on 84.3% of returns)
Here:
$52,631
State:
$59,079
(% of AGI for various income ranges: 80.7% for AGIs below $25k, 81.9% for AGIs $25k-50k, 75.8% for AGIs $50k-75k, 73.1% for AGIs $75k-100k, 73.2% for AGIs $100k-200k, 48.3% for AGIs over 200k)
Taxable interest for individuals: $1,485 (reported on 36.2% of returns)
This zip code:
$1,485
California:
$2,146
(% of AGI for various income ranges: 1.2% for AGIs below $25k, 0.7% for AGIs $25k-50k, 0.8% for AGIs $50k-75k, 0.7% for AGIs $75k-100k, 0.8% for AGIs $100k-200k, 0.9% for AGIs over 200k)
Ordinary dividends: $6,708 (reported on 22.6% of returns)
Here:
$6,708
State:
$9,308
(% of AGI for various income ranges: 1.7% for AGIs below $25k, 1.1% for AGIs $25k-50k, 1.5% for AGIs $50k-75k, 1.8% for AGIs $75k-100k, 1.7% for AGIs $100k-200k, 4.3% for AGIs over 200k)
Net capital gain/loss in AGI: +$11,750 (reported on 19.7% of returns)
Here:
+$11,750
State:
+$30,460
(% of AGI for various income ranges: 0.2% for AGIs $25k-50k, 0.4% for AGIs $50k-75k, 0.6% for AGIs $75k-100k, 1.8% for AGIs $100k-200k, 10.7% for AGIs over 200k)
Profit/loss from business: +$19,734 (reported on 16.5% of returns)
Here:
+$19,734
State:
+$17,064
(% of AGI for various income ranges: 8.3% for AGIs below $25k, 5.4% for AGIs $25k-50k, 4.6% for AGIs $50k-75k, 4.2% for AGIs $75k-100k, 4.4% for AGIs $100k-200k, 5.2% for AGIs over 200k)
Taxable individual retirement arrangement distribution: $18,749 (reported on 9.1% of returns)
93117:
$18,749
California:
$19,557
(% of AGI for various income ranges: 2.2% for AGIs below $25k, 1.9% for AGIs $25k-50k, 3.0% for AGIs $50k-75k, 3.3% for AGIs $75k-100k, 3.2% for AGIs $100k-200k, 2.1% for AGIs over 200k)
Self-employment retirement plans: $19,412 (reported on 1.0% of returns)
93117:
$19,412
California:
$24,530
(% of AGI for various income ranges: 0.2% for AGIs $50k-75k, 0.3% for AGIs $100k-200k, 0.6% for AGIs over 200k)
Total itemized deductions: $32,007 (24% of AGI, reported on 31.3% of returns)
Here:
$32,007
State:
$34,004
Here:
23.7% of AGI
State:
22.7% of AGI
(% of AGI for various income ranges: 11.1% for AGIs below $25k, 9.1% for AGIs $25k-50k, 13.4% for AGIs $50k-75k, 16.4% for AGIs $75k-100k, 19.0% for AGIs $100k-200k, 16.4% for AGIs over 200k)
Charity contributions: $4,007 (reported on 26.4% of returns)
Here:
$4,007
State:
$4,659
(% of AGI for various income ranges: 0.5% for AGIs below $25k, 0.7% for AGIs $25k-50k, 1.2% for AGIs $50k-75k, 1.6% for AGIs $75k-100k, 1.9% for AGIs $100k-200k, 2.3% for AGIs over 200k)
Taxes paid: $11,956 (reported on 31.3% of returns)
93117:
$11,956
State:
$14,448
(% of AGI for various income ranges: 1.8% for AGIs below $25k, 1.9% for AGIs $25k-50k, 3.4% for AGIs $50k-75k, 5.1% for AGIs $75k-100k, 7.5% for AGIs $100k-200k, 8.1% for AGIs over 200k)
Earned income credit: $1,804 (reported on 10.0% of returns)
Here:
$1,804
State:
$2,286
(% of AGI for various income ranges: 2.8% for AGIs below $25k, 0.7% for AGIs $25k-50k)
Percentage of individuals using paid preparers for their 2012 taxes: 54.5%
Here:
55%
State:
64%
(% for various income ranges: 47.4% for AGIs below $25k, 55.9% for AGIs $25k-50k, 58.4% for AGIs $50k-75k, 59.3% for AGIs $75k-100k, 59.6% for AGIs $100k-200k, 70.4% for AGIs over 200k)
Averages for the 2004 tax year for zip code 93117, filed in 2005:
Average Adjusted Gross Income (AGI) in 2004: $54,533 (Individual Income Tax Returns)
Here:
$54,533
State:
$58,600
Salary/wage: $43,197 (reported on 84.7% of returns)
Here:
$43,197
State:
$49,455
(% of AGI for various income ranges: 142.5% for AGIs below $10k, 81.0% for AGIs $10k-25k, 83.0% for AGIs $25k-50k, 77.6% for AGIs $50k-75k, 76.5% for AGIs $75k-100k, 53.2% for AGIs over 100k)
Taxable interest for individuals: $1,770 (reported on 47.0% of returns)
This zip code:
$1,770
California:
$2,365
(% of AGI for various income ranges: 6.6% for AGIs below $10k, 2.1% for AGIs $10k-25k, 1.3% for AGIs $25k-50k, 1.4% for AGIs $50k-75k, 1.6% for AGIs $75k-100k, 1.4% for AGIs over 100k)
Taxable dividends: $3,327 (reported on 27.0% of returns)
Here:
$3,327
State:
$4,746
(% of AGI for various income ranges: 5.3% for AGIs below $10k, 1.6% for AGIs $10k-25k, 1.3% for AGIs $25k-50k, 1.4% for AGIs $50k-75k, 1.6% for AGIs $75k-100k, 1.8% for AGIs over 100k)
Net capital gain/loss: +$34,643 (reported on 21.6% of returns)
Here:
+$34,643
State:
+$23,418
(% of AGI for various income ranges: 5.5% for AGIs below $10k, 0.3% for AGIs $10k-25k, 0.5% for AGIs $25k-50k, 0.7% for AGIs $50k-75k, 1.4% for AGIs $75k-100k, 26.6% for AGIs over 100k)
Profit/loss from business: +$17,303 (reported on 16.0% of returns)
Here:
+$17,303
State:
+$16,826
(% of AGI for various income ranges: 4.4% for AGIs below $10k, 6.7% for AGIs $10k-25k, 4.3% for AGIs $25k-50k, 5.4% for AGIs $50k-75k, 4.0% for AGIs $75k-100k, 5.2% for AGIs over 100k)
IRA payment deduction: $3,080 (reported on 3.2% of returns)
93117:
$3,080
California:
$3,192
(% of AGI for various income ranges: 0.4% for AGIs below $10k, 0.2% for AGIs $10k-25k, 0.2% for AGIs $25k-50k, 0.3% for AGIs $50k-75k, 0.2% for AGIs $75k-100k, 0.1% for AGIs over 100k)
Self-employed pension: $14,951 (reported on 1.5% of returns)
Here:
$14,951
California:
$17,688
(% of AGI for various income ranges: 0.1% for AGIs $10k-25k, 0.1% for AGIs $25k-50k, 0.2% for AGIs $50k-75k, 0.3% for AGIs $75k-100k, 0.6% for AGIs over 100k)
Total itemized deductions: $25,096 (24% of AGI, reported on 35.5% of returns)
Here:
$25,096
State:
$28,113
Here:
23.5% of AGI
State:
25.3% of AGI
(% of AGI for various income ranges: 20.1% for AGIs below $10k, 10.9% for AGIs $10k-25k, 13.2% for AGIs $25k-50k, 19.2% for AGIs $50k-75k, 21.7% for AGIs $75k-100k, 15.9% for AGIs over 100k)
Charity contributions deductions: $3,595 (3% of AGI, reported on 30.3% of returns)
Here:
$3,595
State:
$3,923
Here:
3.1% of AGI
State:
3.3% of AGI
(% of AGI for various income ranges: 1.0% for AGIs below $10k, 0.9% for AGIs $10k-25k, 1.1% for AGIs $25k-50k, 2.0% for AGIs $50k-75k, 2.4% for AGIs $75k-100k, 2.4% for AGIs over 100k)
Total tax: $8,873 (reported on 76.8% of returns)
93117:
$8,873
State:
$10,761
(% of AGI for various income ranges: 4.6% for AGIs below $10k, 4.8% for AGIs $10k-25k, 7.2% for AGIs $25k-50k, 9.4% for AGIs $50k-75k, 10.0% for AGIs $75k-100k, 16.9% for AGIs over 100k)
Earned income credit: $1,439 (reported on 8.1% of returns)
Here:
$1,439
State:
$1,763
Percentage of individuals using paid preparers for their 2004 taxes: 52.0%
Here:
52%
State:
66%
(% for various income ranges: 38.3% for AGIs below $10k, 49.7% for AGIs $10k-25k, 54.5% for AGIs $25k-50k, 57.6% for AGIs $50k-75k, 60.1% for AGIs $75k-100k, 63.8% for AGIs over 100k)
Likely homosexual households (counted as self-reported same-sex unmarried-partner households)
Lesbian couples: 0.2% of all households
Gay men: 0.1% of all households
Household received Food Stamps/SNAP in the past 12 months: 2,398 Household did not receive Food Stamps/SNAP in the past 12 months: 14,950
Women who had a birth in the past 12 months: 493 (329 now married, 164 unmarried) Women who did not have a birth in the past 12 months: 17,457 (2,741 now married, 14,889 unmarried)
Housing units in zip code 93117 with a mortgage: 4,405 (555 second mortgage, 25 home equity loan, 419 both second mortgage and home equity loan) Houses without a mortgage: 21
Median monthly owner costs for units with a mortgage: $3,357 Median monthly owner costs for units without a mortgage: $745
Residents with income below the poverty level in 2022:
This zip code:
28.8%
Whole state:
12.2%
Residents with income below 50% of the poverty level in 2022:
This zip code:
7.8%
Whole state:
6.2%
Median number of rooms in houses and condos:
Here:
5.8
State:
6.0
Median number of rooms in apartments:
Here:
3.5
State:
3.9
Notable locations in this zip code not listed on our city pages
Notable locations in zip code 93117: Goleta Pier (A), Santa Barbara Twin Drive-In (B), Cathedral Oaks Tennis Club (C), Twin Lakes Golf Course (D), Sandpiper Golf Course (E), Ocean Meadows Golf Course (F), Santa Anita Ranch (G), Tajiguas Ranch (H), Tip Top Ranch (I), Southern Pacific Station (J), Folded Hills Ranch (K), Gardner Ranch (L), Gaviota Pier (M), Refugio Guard Station (N), El Capitan Lodge (O), Ellwood Ranch (P), Dos Pueblos Ranch (Q), Corona Del Mar Rancho (R), Ellwood Energy Support Facility (S), Woodhouse Laboratory (T). Display/hide their locations on the map
Shopping Centers: Calle Real Shopping Center (1), University Plaza Shopping Center (2), Padre Shopping Center (3), Magnolia Shopping Center (4). Display/hide their locations on the map
Churches in zip code 93117 include: Beth Messiah Congregation (A), Christ Lutheran Church (B), The Church of Jesus Christ of Latter Day Saints (C), Lutheran Campus Ministry (D), Saint Marks University Parish Church (E), Saint Michaels University Episcopal Church (F), Santa Barbara Pyong Kang Church (G), Unitarian Universalist Live Oak Congregation (H), University Church of Goleta (I). Display/hide their locations on the map
Lakes, reservoirs, and swamps: Devereux Lagoon (A), Glen Anne Reservoir (B), Glen Annie Reservoir (C), Lake Los Carneros (D), Campus Lagoon (E), Goleta Slough (F). Display/hide their locations on the map
Streams, rivers, and creeks: Las Vegas Creek (A), Arroyo El Bulito (B), Alamo Creek (C), El Capitan Creek (D), Dry Creek (E), Tecolotito Creek (F), Yridisis Creek (G), Tajiguas Creek (H), San Jose Creek (I). Display/hide their locations on the map
Parks in zip code 93117 include: Del Sol Vernal Pool Preserve (1), Evergreen Park (2), Little Acorn Park (3), Trigo-Pasado Park (4), Window-to-the-Sea Park (5), Goleta Beach County Park (6), Gaviota State Park (7), Fremont Foxon Historical Marker (8), El Capitán State Beach (9). Display/hide their locations on the map
4,135 married couples with children.
1,918 single-parent households (399 men, 1,519 women).
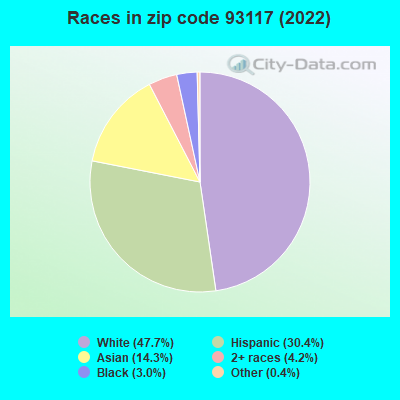
66.4% of residents of 93117 zip code speak English at home.
17.7% of residents speak Spanish at home (69% very well, 13% well, 15% not well, 3% not at all).
4.6% of residents speak other Indo-European language at home (88% very well, 6% well, 5% not well).
9.5% of residents speak Asian or Pacific Island language at home (71% very well, 22% well, 7% not well).
1.0% of residents speak other language at home (71% very well, 12% well, 15% not well, 1% not at all).
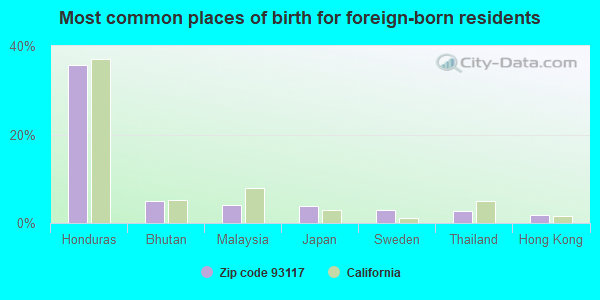
Foreign born population: 10,654 (20.1%) (39.5% of them are naturalized citizens)
This zip code:
20.1%
Whole state:
26.7%
36%Honduras
5%Bhutan
4%Malaysia
4%Japan
3%Sweden
3%Thailand
2%Hong Kong
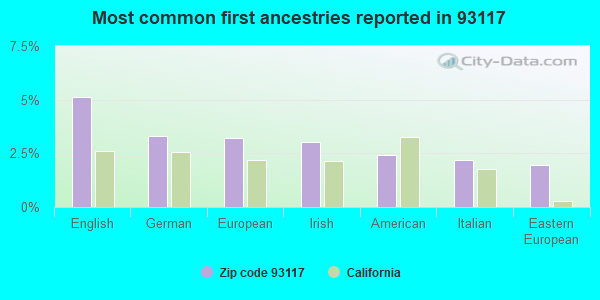
5%English
3%German
3%European
3%Irish
2%American
2%Italian
2%Eastern European
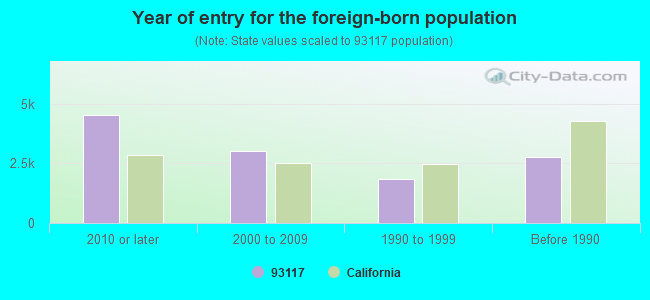
Year of entry for the foreign-born population
4,5202010 or later
3,0112000 to 2009
1,8251990 to 1999
2,777Before 1990
Public elementary/middle school in in zip code 93117 not listed on the city page:
VISTA DE LAS CRUCES(Students: 66, Location: 9467 SAN JULIAN RD., Grades: KG-8)
Major facilities with environmental interests located in this zip code:
GAVIOTA OIL AND GAS PLANT (17100 CALLE MARIPOSA REINA in GOLETA, CA)
AIR MAJOR (AIRS/AFS) OIL CONTROL (Facility Response Plan for oil discharge) STATE MASTER (California - Hazardous Waste Tracking) - HAZARDOU WASTE PROGRAM CRITERIA AND HAZARDOUS AIR POLLUTANT INVENTORY (Inventory of air pollution sources) AIR MAJOR ("Best Available" air pollution technologies tracking) HAZARDOUS WASTE BIENNIAL REPORTER (Resource Conservation and Recovery Act (tracking hazardous waste)) Large Quantity Generators, more that 1000 kg of hazardous waste/month (Resource Conservation and Recovery Act (tracking hazardous waste)) - notification Large Quantity Generators, more that 1000 kg of hazardous waste/month (Resource Conservation and Recovery Act (tracking hazardous waste)) - notification Business SIC and NAICS classification: CRUDE PETROLEUM AND NATURAL GAS Organizations: CHEVRON U.S.A. PRODUCTS (CONTACT/GENERAL)
, ARGUELLO INC (CONTACT/OWNER)
, OESTE VISTA POWER GEN LLC (CONTACT/OWNER)
Alternative names: ARGUELLO INC GAVIOTA FACILITY, ARGUELLO INC GAVIOTA OIL HEATING FACILIT, CHEVRON GAVIOTA OIL AND GAS PLANT, CHEVRON GAVIOTA OIL AND GAS PLANT, GAVIOTA O AND G - CHEVRON, GAVIOTA OIL AND GAS PROCESSING PLANT , OESTE POWER GEN
EXXON MOBIL PRODUCTION COMPANY (12000 CALLE REAL in GOLETA, CA) . Federal Facility
AIR MAJOR (AIRS/AFS) OIL CONTROL (Facility Response Plan for oil discharge) STATE MASTER (California - Hazardous Waste Tracking) - HAZARDOU WASTE PROGRAM AIR MAJOR ("Best Available" air pollution technologies tracking) HAZARDOUS WASTE BIENNIAL REPORTER (Resource Conservation and Recovery Act (tracking hazardous waste)) Large Quantity Generators, more that 1000 kg of hazardous waste/month (Resource Conservation and Recovery Act (tracking hazardous waste)) Large Quantity Generators, more that 1000 kg of hazardous waste/month (Resource Conservation and Recovery Act (tracking hazardous waste)) Business SIC classification: CRUDE PETROLEUM AND NATURAL GAS; PETROLEUM REFINING Business NAICS classification: CRUDE PETROLEUM AND NATURAL GAS EXTRACTION. Organizations: EXXON COMPANY, U.S.A. (CONTACT/GENERAL)
, EXXONMOBIL PRODUCTION COMPANY (CONTACT/OPERATOR)
Alternative names: EBASCO CONSTRUCTORS INC, EXXON CO. USA - LAS FLORES CANYO (SANTA YNEZ UNIT), EXXON CO USA LAS FLORES CANYON, EXXON COMPANY UNITED STATES OF AMERICA LAS FLORES CANYON PLANT, EXXON CO. USA - LAS FLORES CANYO (SANTA YNEZ UNIT), EXXONMOBIL-POPCO GAS PLANT, EXXONMOBIL-SYU PROJ./LAS FLORES CANYON, SANTA YNEZ UNIT/LAS FLORES CANYON SANTA YNEZ UNIT/LAS FLORES CAN
CHEVRON STATION 92580 (6895 HOLLISTER AVE in GOLETA, CA)
STATE MASTER (California - Hazardous Waste Tracking) - HAZARDOU WASTE PROGRAM HAZARDOUS WASTE BIENNIAL REPORTER (Resource Conservation and Recovery Act (tracking hazardous waste)) Large Quantity Generators, more that 1000 kg of hazardous waste/month (Resource Conservation and Recovery Act (tracking hazardous waste)) Large Quantity Generators, more that 1000 kg of hazardous waste/month (Resource Conservation and Recovery Act (tracking hazardous waste)) Organizations: CHEVRON PRODUCTS CO. (CONTACT/OPERATOR)
Alternative names: CHEVRON 92580
APPLIED MAGNETICS CORPORATION (75 ROBIN HILL ROAD in GOLETA, CA)
STATE MASTER (California - Hazardous Waste Tracking) - HAZARDOU WASTE PROGRAM CRITERIA AND HAZARDOUS AIR POLLUTANT INVENTORY (Inventory of air pollution sources) AIR MAJOR ("Best Available" air pollution technologies tracking) HAZARDOUS WASTE BIENNIAL REPORTER (Resource Conservation and Recovery Act (tracking hazardous waste)) Large Quantity Generators, more that 1000 kg of hazardous waste/month (Resource Conservation and Recovery Act (tracking hazardous waste)) TRI REPORTER (Tracking of toxic chemicals releasing facilities) Business SIC classification: ELECTRONIC COMPONENTS Business NAICS classification: OTHER ELECTRONIC COMPONENT MANUFACTURING. Organizations: ANDREW WALLIS (CONTACT/OPERATOR)
, JOHN FOSTER (CONTACT/OWNER)
Alternative names: APPLIED MAGNETICS CORP. (ROBIN HILL RD. FACILITY), APPLIED MAGNETICS CORP. (ROBIN HILL RD. FACILITY), APPLIED MAGNETICS SYSTEM DIV, INNOVATIVE MICRO TECHNOLOGY
ELLWOOD ONSHORE TREATMENT FACILITY (7979 HOLLISTER AVENUE in GOLETA, CA)
AIR MAJOR (AIRS/AFS) STATE MASTER (California - Hazardous Waste Tracking) - HAZARDOU WASTE PROGRAM CRITERIA AND HAZARDOUS AIR POLLUTANT INVENTORY (Inventory of air pollution sources) Small Quantity Generators, between 100 kg and 1000 kg of hazardous waste/month (Resource Conservation and Recovery Act (tracking hazardous waste)) - notification Small Quantity Generators, between 100 kg and 1000 kg of hazardous waste/month (Resource Conservation and Recovery Act (tracking hazardous waste)) - notification Business SIC classification: CRUDE PETROLEUM AND NATURAL GAS; GASOLINE SERVICE STATIONS; NONCLASSIFIABLE ESTABLISHMENTS Business NAICS classification: CRUDE PETROLEUM AND NATURAL GAS EXTRACTION. Organizations: MOBIL OIL CORPORATION (CONTACT/OWNER)
, VENOCO INC (CONTACT/OWNER)
, ATLANTIC RICHFIELD CO (CONTACT/OWNER)
Alternative names: 421 LEASE VENOCO INC, ELLWOOD O & G PROCESSING FACIL, ELLWOOD ONSHORE VENOCO INC, VENOCO INC, VENOCO-ELLWOOD MVFF, VENOCO-ELLWOOD-O & G PROCESSING FACILITY
EQUILON ENTERPRISES (16899 HWY 101 in GOLETA, CA) . Federal Facility
OIL CONTROL (Facility Response Plan for oil discharge) STATE MASTER (California - Hazardous Waste Tracking) - HAZARDOU WASTE PROGRAM HAZARDOUS WASTE BIENNIAL REPORTER (Resource Conservation and Recovery Act (tracking hazardous waste)) Large Quantity Generators, more that 1000 kg of hazardous waste/month (Resource Conservation and Recovery Act (tracking hazardous waste)) - notification Organizations: TEXACO TRADING AND TRANSPORTATION (CONTACT/GENERAL)
, SHELL PIPELINE COMPANY LP (CONTACT/OPERATOR)
Alternative names: GAVIOTA PUMP STATION, GAVIOTA TERMINAL
AGILITY COMMUNICATIONS (475 PINE AVENUE in GOLETA, CA)
STATE MASTER (California - Hazardous Waste Tracking) - HAZARDOU WASTE PROGRAM HAZARDOUS WASTE BIENNIAL REPORTER (Resource Conservation and Recovery Act (tracking hazardous waste)) Large Quantity Generators, more that 1000 kg of hazardous waste/month (Resource Conservation and Recovery Act (tracking hazardous waste)) TRI REPORTER (Tracking of toxic chemicals releasing facilities) Business SIC classification: COMPUTER MAINTENANCE AND REPAIR Business NAICS classification: SEMICONDUCTOR AND RELATED DEVICE MANUFACTURING. Organizations: AGILITY COMMUNICATIONS, INC (CONTACT/OPERATOR)
, PACIFICA REALTY (CONTACT/OWNER)
Alternative names: APPLIED PERIPHERALS TECHNOLOGY, MAGNETIC DATA INC.
ELLWOOD MARINE TERMINAL VENOCO INCORPORATED (SOUTH WAST OF PACIFIC OAKS DRIVE in GOLETA, CA)
AIR SYNTHETIC MINOR (AIRS/AFS) STATE MASTER (California - Hazardous Waste Tracking) - HAZARDOU WASTE PROGRAM CRITERIA AND HAZARDOUS AIR POLLUTANT INVENTORY (Inventory of air pollution sources) Small Quantity Generators, between 100 kg and 1000 kg of hazardous waste/month (Resource Conservation and Recovery Act (tracking hazardous waste)) - notification Business SIC classification: CRUDE PETROLEUM AND NATURAL GAS; CRUDE PETROLEUM PIPELINES Business NAICS classification: PIPELINE TRANSPORTATION OF CRUDE OIL. Organizations: MOBIL OIL CORPORATION (CONTACT/OWNER)
Alternative names: JOVALAN BARGE, VENOCO-ELLWOOD-MARINE TERMINAL, VENOCO-ELLWOOD MARINE TERMINAL-JOVALAN
NEAL FEAY COMPANY (133 LA PATERA in GOLETA, CA)
STATE MASTER (California - Hazardous Waste Tracking) - HAZARDOU WASTE PROGRAM ENFORCEMENT/COMPLIANCE ACTIVITY (Integrated Compliance Information System) National Pollutant Discharge Elimination System NON-MAJOR (Tracking pollutant discharge elimination systems) - permit Small Quantity Generators, between 100 kg and 1000 kg of hazardous waste/month (Resource Conservation and Recovery Act (tracking hazardous waste)) - notification Business NAICS classification: METAL STAMPING. Organizations: NEAL FEY COMPANY (CONTACT/OWNER)
MENTOR H S INCORPORATED (600 PINE AVE. in GOLETA, CA)
(Integrated Compliance Information System) - ICIS-09-1992-0005, FORMAL ENFORCEMENT ACTION COMPLIANCE ACTIVITY (Tracking inspections of insecticide, fungicide, and rodenticide, and toxic substances) Small Quantity Generators, between 100 kg and 1000 kg of hazardous waste/month (Resource Conservation and Recovery Act (tracking hazardous waste)) TRI REPORTER (Tracking of toxic chemicals releasing facilities) Business SIC classification: ORTHOPEDIC, PROSTHETIC, AND SURGICAL APPLIANCES AND SUPPLIES Business NAICS classification: SURGICAL APPLIANCE AND SUPPLIES MANUFACTURING. Alternative names: MENTOR CORP, MENTOR OCRP
LOCKHEED MARTIN S B F (346 BOLLAY DR in GOLETA, CA)
STATE MASTER (California - Hazardous Waste Tracking) - HAZARDOU WASTE PROGRAM Large Quantity Generators, more that 1000 kg of hazardous waste/month (Resource Conservation and Recovery Act (tracking hazardous waste)) Business NAICS classification: SEMICONDUCTOR AND RELATED DEVICE MANUFACTURING.; OTHER AIRCRAFT PARTS AND AUXILIARY EQUIPMENT MANUFACTURING. Organizations: LOCKHEED MARTIN CORPORATION (CONTACT/OPERATOR)
Alternative names: LOCKHEED MARTIN-SANTA BARBARA FOCALPLANE
MCGHAN MEDICAL CORPORATION (71 S LOS CARNEROS in GOLETA, CA)
STATE MASTER (California - Hazardous Waste Tracking) - HAZARDOU WASTE PROGRAM Large Quantity Generators, more that 1000 kg of hazardous waste/month (Resource Conservation and Recovery Act (tracking hazardous waste)) - notification Organizations: INAMED CORPORATION (CONTACT/OWNER)
AERA MOLINO UNIT (14900 CALLE REAL in GOLETA, CA)
STATE MASTER (California - Hazardous Waste Tracking) - HAZARDOU WASTE PROGRAM Large Quantity Generators, more that 1000 kg of hazardous waste/month (Resource Conservation and Recovery Act (tracking hazardous waste)) - notification Organizations: AERA ENERGY LLC (CONTACT/OWNER)
Housing units lacking complete plumbing facilities: 0.6% Housing units lacking complete kitchen facilities: 3.4%
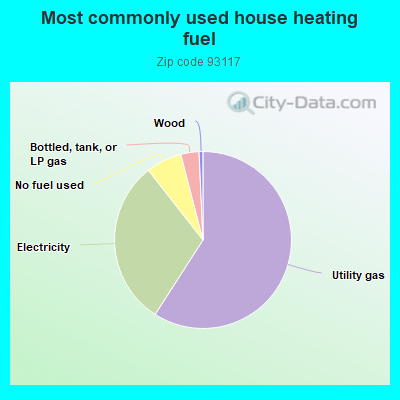
58.7%Utility gas
30.1%Electricity
6.5%No fuel used
3.3%Bottled, tank, or LP gas
0.7%Wood
Population in 1990: 45,988. Population change in the 1990s: +3,982 (+8.7%).
Place of birth for U.S.-born residents:
This state: 32,376
Northeast: 2,520
Midwest: 2,817
South: 1,531
West: 1,827
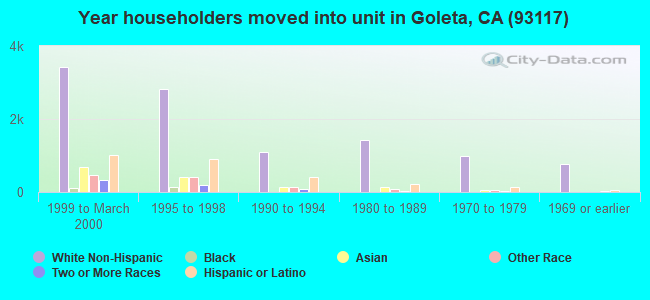
34% of the 93117 zip code residents lived in the same house 5 years ago. Out of people who lived in different houses, 33% lived in this county. Out of people who lived in different counties, 50% lived in California.
88% of the 93117 zip code residents lived in the same house 1 year ago. Out of people who lived in different houses, 57% moved from this county. Out of people who lived in different houses, 13% moved from different county within same state. Out of people who lived in different houses, 20% moved from different state. Out of people who lived in different houses, 10% moved from abroad.
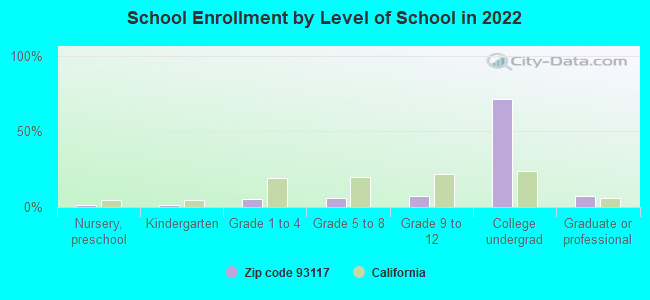
Private vs. public school enrollment:
Students in private schools in grades 1 to 8 (elementary and middle school): 404
Here:
13.5%
California:
10.5%
Students in private schools in grades 9 to 12 (high school): 62
Here:
3.4%
California:
8.5%
Students in private undergraduate colleges: 646
Here:
3.5%
California:
15.9%
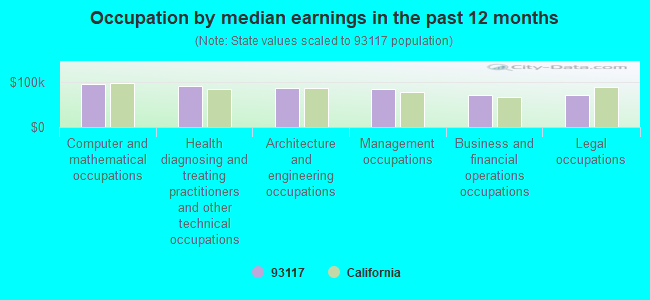
Occupation by median earnings in the past 12 months ($)
95,740Computer and mathematical occupations
90,526Health diagnosing and treating practitioners and other technical occupations
86,548Architecture and engineering occupations
83,641Management occupations
71,104Business and financial operations occupations
70,255Legal occupations
Companies with biggest federal contracts located in this zip code:
RAYTHEON COMPANY (6380 HOLLISTER AVE in GOLETA, CA) : $1,078,477,693 in 601 contractsfrom 1999 to 2006
Contracts for Electronic Countermeasures, Counter-Countermeasures and Quick Reaction Capability Equipment, Radar Equipment, Airborne, Maintenance, Repair and Rebuilding of Equipment -- Communication, Detection, and Coherent Radiation Equipment, Defense Electronics and Communication Equipment -- Operational Systems Development (R&D), and moreby Air Force, Navy, NASA, Army, and others Signed by year:2000: $135,253,607; 2001: $152,639,777; 2002: $112,779,648; 2003: $134,550,316; 2004: $182,529,551; 2005: $226,615,655; 2006: $64,587,230.
Biggest contracts:
$60,995,311 with Air Force for Electronic Countermeasures, Counter-Countermeasures and Quick Reaction Capability Equipment. Signed on 1999-12-22. Completion date: 2002-05-31.
$55,697,846, same as above.Signed on 2004-04-16. Completion date: 2006-08-31.
$54,577,779, same as above.Signed on 2001-04-09. Completion date: 2003-10-31.
$52,473,124, same as above.Signed on 2000-09-25. Completion date: 2002-12-31.
RAYTHEON COMPANY (26 CASTILIAN DR in GOLETA, CA) : $248,423,431 in 251 contractsfrom 1999 to 2006
Contracts for R&D-SPACE & TERRESTRIAL-OPSY DEV, Guided Missile Components, Night Vision Equipment, Emitted and Reflected Radiation, Defense Electronics and Communication Equipment -- Advanced Development (R&D), and moreby Air Force, Army, Navy, Defense Logistics Agency, and others Signed by year:2000: $34,355,596; 2001: $46,865,030; 2002: $79,705,793; 2003: $30,520,811; 2004: $32,329,918; 2005: $9,197,829; 2006: $11,703,528.
Biggest contracts:
$20,600,000 with Air Force for R&D-SPACE & TERRESTRIAL-OPSY DEV. Signed on 2002-01-30. Completion date: 2007-09-30.
$15,900,000 with Air Force for Guided Missile Components. Signed on 2000-08-18. Completion date: 2001-09-30.
$15,224,950 with Air Force for R&D-SPACE & TERRESTRIAL-OPSY DEV. Signed on 2001-03-28. Completion date: 2007-09-30.
$11,988,897, same as above.Signed on 2002-05-22. Completion date: 2007-12-15.
KIDDE TECHNOLOGIES INC (163 AERO CAMINO in GOLETA, CA; small business) : $97,533,805 in 150 contractsfrom 1999 to 2006
Contracts for Fire Fighting Equipment, Fire Control Maintenance and Repair Shop Specialized Equipment, Combat, Assault, and Tactical Vehicles, Tracked, Vehicular Furniture and Accessories, and moreby Army, Defense Logistics Agency, Navy Signed by year:2000: $1,617,857; 2001: $1,761,700; 2002: $3,125,564; 2003: $2,899,120; 2004: $5,389,935; 2005: $26,447,009; 2006: $55,871,885.
Biggest contracts:
$19,775,790 with Army for Fire Fighting Equipment. Signed on 2006-01-30. Completion date: 2009-12-31.
$19,571,220, same as above.Signed on 2006-02-03. Completion date: 2009-12-31.
$15,291,903, same as above.Signed on 2005-10-27. Completion date: 2006-10-31.
$9,469,176, same as above.Signed on 2006-05-05. Completion date: 2006-10-31.
METATECH CORPORATION (358 S FAIRVIEW AVENUE, SU in GOLETA, CA; small business) : $46,972,771 in 264 contractsfrom 1999 to 2006
Contracts for Defense Missile and Space Systems -- Basic Research (R&D), Weapons -- Operational Systems Development (R&D), Services -- Basic Research (R&D), Other Defense -- Applied Research and Exploratory Development (R&D), and moreby Air Force, Department of Defense, Army, National Oceanic and Atmospheric Administration/Under Secretary for Oceans and Atmosphere, and others Signed by year:2000: $5,145,242; 2001: $4,721,265; 2002: $8,404,404; 2003: $10,309,545; 2004: $7,024,299; 2005: $6,753,437; 2006: $3,465,296.
Biggest contracts:
$1,749,000 with Air Force for Defense Missile and Space Systems -- Basic Research (R&D). Signed on 2003-12-31. Completion date: 2010-01-15.
$1,350,000, same as above.Signed on 2004-03-30. Completion date: 2010-01-15.
$1,209,800 with Air Force for Weapons -- Operational Systems Development (R&D). Signed on 2002-03-05. Completion date: 2003-08-31.
$1,200,000 with Air Force for Defense Missile and Space Systems -- Basic Research (R&D). Signed on 2004-03-22. Completion date: 2010-01-15.
AEC-ABLE ENGINEERING CO INC (600 PINE AVE in GOLETA, CA) : $15,841,667 in 84 contractsfrom 1999 to 2006
Contracts for Other Research and Development -- Basic Research (R&D), Other Defense -- Basic Research (R&D), Engineering -- Basic Research (R&D), Defense Missile and Space Systems -- Advanced Development (R&D), and moreby NASA, Air Force, Army Signed by year:2000: $95,469; 2001: $1,699,760; 2002: $1,753,573; 2003: $6,766,492; 2004: $1,445,000; 2005: $3,166,668; 2006: $864,705.
Biggest contracts:
$3,298,922 with NASA for Other Research and Development -- Basic Research (R&D). Signed on 2003-06-15. Completion date: 2003-06-15.
$1,255,504 with Air Force for Other Defense -- Basic Research (R&D). Signed on 2005-08-30. Completion date: 2006-10-12.
$1,189,136 with NASA for Other Research and Development -- Basic Research (R&D). Signed on 2004-12-03. Completion date: 2005-06-30.
$1,029,829, same as above.Signed on 2005-02-14. Completion date: 2005-06-30.
ACOUSTIC TRANSDUCERS, INC (100 LOPEZ RD in GOLETA, CA) : $12,860,882 in 135 contractsfrom 2000 to 2006
Contracts for Combination and Miscellaneous Instruments, Underwater Sound Equipment, Lease or Rental of Equipment -- Communication, Detection, and Coherent Radiation Equipment, Drafting, Surveying, and Mapping Instruments, and moreby National Oceanic and Atmospheric Administration/Under Secretary for Oceans and Atmosphere, U.S. Army Corps of Engineers - civil program financing only, Army, Navy, and others Signed by year:2000: $1,045,292; 2001: $1,733,095; 2002: $2,098,121; 2003: $2,052,229; 2004: $2,032,348; 2005: $2,571,545; 2006: $1,328,252.
Biggest contracts:
$1,382,053 with National Oceanic and Atmospheric Administration/Under Secretary for Oceans and Atmosphere for Combination and Miscellaneous Instruments. Signed on 2003-04-15. Completion date: 2003-07-15.
$600,000 with National Oceanic and Atmospheric Administration/Under Secretary for Oceans and Atmosphere for Underwater Sound Equipment. Signed on 2005-08-11. Completion date: 2005-12-01.
$572,250, same as above.Signed on 2006-09-14. Completion date: 2007-01-30.
$371,480 with U.S. Army Corps of Engineers - civil program financing only for Combination and Miscellaneous Instruments. Signed on 2002-05-28. Completion date: 2002-08-25.
INTEGRATED PROCUREMENT TECHNOL (320 STORKE RD # 100 in GOLETA, CA; small business) : $12,759,954 in 768 contractsfrom 2000 to 2006
Contracts for Gas Turbines and Jet Engines, Non-Aircraft; and Components, Microcircuits, Electronic, Engine Fuel System Components, Aircraft and Missile Prime Movers, Electrical and Electronic assemblies, Boards, Cards, and Associated Hardware, and moreby Army, Defense Logistics Agency, Air Force, Bureau of Reclamation, and others Signed by year:2000: $440,430; 2001: $100,637; 2002: $0; 2003: $78,479; 2004: $3,492,929; 2005: $5,229,722; 2006: $3,417,757.
Biggest contracts:
$318,792 with Army for Gas Turbines and Jet Engines, Non-Aircraft; and Components. Taking place in CT. Signed on 2000-11-22. Completion date: 2002-03-14.
$252,325 with Defense Logistics Agency for Microcircuits, Electronic. Signed on 2004-08-26. Completion date: 2005-07-12.
$221,426 with Defense Logistics Agency for Engine Fuel System Components, Aircraft and Missile Prime Movers. Signed on 2006-01-31. Completion date: 2006-10-28.
$210,196 with Defense Logistics Agency for Microcircuits, Electronic. Signed on 2006-03-28. Completion date: 2006-12-26.
DUPONT DISPLAYS INC (120 CREMONA DR STE C in SANTA BARBARA, CA; small business) : $11,821,964 in 6 contractsfrom 1999 to 2002
Contracts for Other Defense -- Applied Research and Exploratory Development (R&D), Physical Sciences -- Applied Research and Exploratory Development (R&D), Defense Missile and Space Systems -- Advanced Development (R&D) by Department of Defense, Navy, Air Force, Army, and others Signed by year:2000: $3,823,898; 2001: $7,848,501; 2002: -$571; 2003: $0; 2004: $0; 2005: $0; 2006: $0.
Biggest contracts:
$7,148,504 with Department of Defense for Other Defense -- Applied Research and Exploratory Development (R&D). Signed on 2001-04-05. Completion date: 2003-05-11.
$3,573,915, same as above.Signed on 2000-05-12. Completion date: 2001-11-12.
$699,997 with Navy for Other Defense -- Applied Research and Exploratory Development (R&D). Signed on 2001-03-29. Completion date: 2001-09-30.
$249,983 with Air Force for Physical Sciences -- Applied Research and Exploratory Development (R&D). Signed on 2000-07-25. Completion date: 2001-08-04.
NAUTRONIX MARIPRO, INC (1522 COOK PL in GOLETA, CA; small business) : $7,995,331 in 37 contractsfrom 2000 to 2006
Contracts for Miscellaneous Communication Equipment, Underwater Sound Equipment, Cable, Cord, and Wire Assemblies: Communications Equipment, Defense Ships -- Applied Research and Exploratory Development (R&D), and moreby Navy, Air Force Signed by year:2000: $240,000; 2001: $4,040,313; 2002: $3,884,012; 2003: -$1,048,770; 2004: $624,207; 2005: $230,569; 2006: $25,000.
Biggest contracts:
$3,479,990 with Navy for Miscellaneous Communication Equipment. Signed on 2001-08-15. Completion date: 2003-08-14.
$1,644,228 with Navy for Underwater Sound Equipment. Signed on 2002-11-07. Completion date: 2003-10-20.
$859,734 with Navy for Cable, Cord, and Wire Assemblies: Communications Equipment. Signed on 2002-09-23. Completion date: 2003-05-23.
$560,000 with Navy for Defense Ships -- Applied Research and Exploratory Development (R&D). Signed on 2002-10-29. Completion date: 2007-04-30.
AGILE MATERIALS & TECHNOLOGIES (93 CASTILIAN DR in GOLETA, CA; small business) : $6,593,587 in 23 contractsfrom 2000 to 2006
Contracts for Defense Electronics and Communication Equipment -- Basic Research (R&D), Other Defense -- Management and Support (R&D), Other Research and Development -- Basic Research (R&D), Other Sciences Not Elsewhere Classified -- Basic Research (R&D), and moreby Army, Air Force Signed by year:2000: $399,816; 2001: $120,000; 2002: $358,045; 2003: $621,954; 2004: $2,198,681; 2005: $1,430,367; 2006: $1,464,724.
Biggest contracts:
$1,374,000 with Army for Defense Electronics and Communication Equipment -- Basic Research (R&D). Signed on 2004-10-28. Completion date: 2007-09-01.
$836,000, same as above.Signed on 2006-01-25. Completion date: 2007-09-01.
$475,000, same as above.Signed on 2004-08-02. Completion date: 2007-09-01.
$396,000, same as above.Signed on 2005-12-13. Completion date: 2007-09-01.
Top industries in this zip code by the number of employees in 2005:
Administrative and Support and Waste Management and Remediation Services: Telemarketing Bureaus (500-999 employees: 2 establishments, 100-249 employees: 1 establishment)
Professional, Scientific, and Technical Services: Research and Development in the Physical, Engineering, and Life Sciences (250-499: 1, 50-99: 1, 20-49: 4, 10-19: 4, 5-9: 2, 1-4: 9)
Health Care and Social Assistance: Residential Mental Retardation Facilities (250-499: 1, 20-49: 1, 1-4: 1)
People in group quarters in 2010:
7,935 people in college/university student housing
41 people in other noninstitutional facilities
40 people in group homes intended for adults
30 people in local jails and other municipal confinement facilities
8 people in group homes for juveniles (non-correctional)
3 people in workers' group living quarters and job corps centers
People in group quarters in 2000:
5,639 people in college dormitories (includes college quarters off campus)
204 people in schools, hospitals, or wards for the intellectually disabled
39 people in other noninstitutional group quarters
18 people in halfway houses
9 people in homes or halfway houses for drug/alcohol abuse
6 people in nursing homes
6 people in other nonhousehold living situations
4 people in homes for the mentally retarded
Fatal accident statistics in 2013:
Fatal accident count: 2
Vehicles involved in fatal accidents: 3
Fatal accidents caused by drunken drivers: 0
Fatalities: 2
Persons involved in fatal accidents: 4
Pedestrians involved in fatal accidents: 2
Fatal accident statistics in 2011:
Fatal accident count: 5
Vehicles involved in fatal accidents: 6
Fatal accidents caused by drunken drivers: 2
Fatalities: 5
Persons involved in fatal accidents: 11
Pedestrians involved in fatal accidents: 1
Home Mortgage Disclosure Act Aggregated Statistics For Year 2009 (Based on 13 full and 10 partial tracts)
A) FHA, FSA/RHS & VA Home Purchase Loans
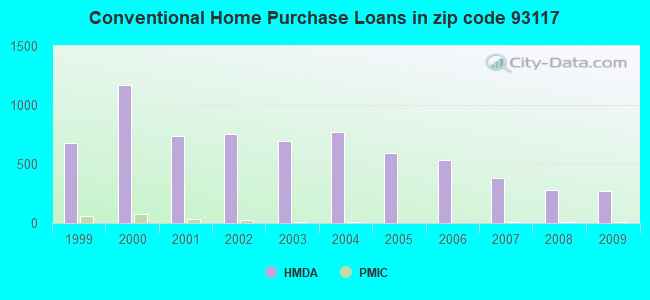
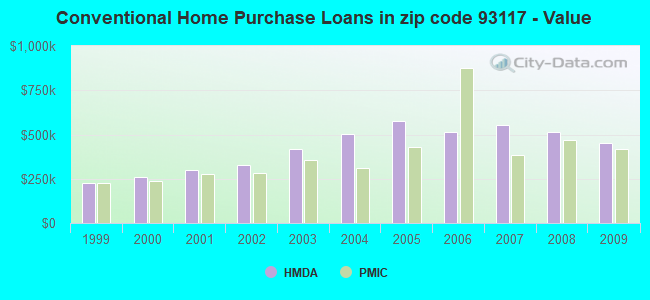
B) Conventional Home Purchase Loans
C) Refinancings
D) Home Improvement Loans
E) Loans on Dwellings For 5+ Families
F) Non-occupant Loans on < 5 Family Dwellings (A B C & D)
G) Loans On Manufactured Home Dwelling (A B C & D)
Number
Average Value
Number
Average Value
Number
Average Value
Number
Average Value
Number
Average Value
Number
Average Value
Number
Average Value
LOANS ORIGINATED
38
$494,464
267
$452,687
1,370
$367,321
64
$283,270
5
$2,226,600
205
$412,002
13
$144,432
APPLICATIONS APPROVED, NOT ACCEPTED
4
$378,268
22
$495,905
153
$377,465
4
$145,022
0
$0
33
$315,241
0
$0
APPLICATIONS DENIED
4
$421,790
35
$415,210
313
$418,186
21
$205,407
1
$750,000
41
$351,991
3
$196,080
APPLICATIONS WITHDRAWN
7
$545,974
38
$458,504
200
$499,013
10
$361,597
0
$0
32
$574,281
5
$126,582
FILES CLOSED FOR INCOMPLETENESS
0
$0
7
$424,891
49
$411,990
2
$296,000
0
$0
10
$444,997
0
$0
Aggregated Statistics For Year 2008 (Based on 13 full and 10 partial tracts)
A) FHA, FSA/RHS & VA Home Purchase Loans
B) Conventional Home Purchase Loans
C) Refinancings
D) Home Improvement Loans
E) Loans on Dwellings For 5+ Families
F) Non-occupant Loans on < 5 Family Dwellings (A B C & D)
G) Loans On Manufactured Home Dwelling (A B C & D)
Number
Average Value
Number
Average Value
Number
Average Value
Number
Average Value
Number
Average Value
Number
Average Value
Number
Average Value
LOANS ORIGINATED
15
$422,055
281
$511,614
473
$441,553
75
$320,838
16
$5,541,553
147
$536,936
52
$151,179
APPLICATIONS APPROVED, NOT ACCEPTED
3
$510,667
56
$473,296
120
$397,439
6
$100,047
0
$0
24
$433,545
5
$128,206
APPLICATIONS DENIED
4
$522,332
93
$506,684
285
$443,875
35
$266,585
0
$0
53
$510,688
28
$165,413
APPLICATIONS WITHDRAWN
4
$428,250
59
$486,708
121
$446,880
12
$359,652
0
$0
49
$533,160
7
$158,249
FILES CLOSED FOR INCOMPLETENESS
1
$368,000
9
$411,800
35
$580,049
5
$273,752
0
$0
7
$994,591
0
$0
Aggregated Statistics For Year 2007 (Based on 13 full and 10 partial tracts)
A) FHA, FSA/RHS & VA Home Purchase Loans
B) Conventional Home Purchase Loans
C) Refinancings
D) Home Improvement Loans
E) Loans on Dwellings For 5+ Families
F) Non-occupant Loans on < 5 Family Dwellings (A B C & D)
G) Loans On Manufactured Home Dwelling (A B C & D)
Number
Average Value
Number
Average Value
Number
Average Value
Number
Average Value
Number
Average Value
Number
Average Value
Number
Average Value
LOANS ORIGINATED
0
$0
383
$554,504
805
$481,360
93
$331,695
29
$1,818,069
262
$600,582
57
$135,646
APPLICATIONS APPROVED, NOT ACCEPTED
0
$0
75
$653,620
173
$557,665
16
$446,370
0
$0
46
$926,483
18
$148,264
APPLICATIONS DENIED
2
$344,000
119
$640,144
338
$567,422
38
$383,758
2
$1,500,000
89
$796,048
42
$139,185
APPLICATIONS WITHDRAWN
2
$344,000
70
$524,540
155
$568,581
16
$516,076
4
$1,262,000
46
$619,214
7
$146,334
FILES CLOSED FOR INCOMPLETENESS
0
$0
22
$722,120
58
$545,538
2
$237,540
0
$0
14
$622,170
6
$144,333
Aggregated Statistics For Year 2006 (Based on 13 full and 10 partial tracts)
B) Conventional Home Purchase Loans
C) Refinancings
D) Home Improvement Loans
E) Loans on Dwellings For 5+ Families
F) Non-occupant Loans on < 5 Family Dwellings (A B C & D)
G) Loans On Manufactured Home Dwelling (A B C & D)
Number
Average Value
Number
Average Value
Number
Average Value
Number
Average Value
Number
Average Value
Number
Average Value
LOANS ORIGINATED
533
$513,463
988
$493,241
160
$355,646
24
$2,290,610
273
$514,655
58
$153,176
APPLICATIONS APPROVED, NOT ACCEPTED
120
$540,530
219
$478,948
30
$451,442
0
$0
40
$528,050
9
$161,366
APPLICATIONS DENIED
166
$489,098
388
$547,819
52
$374,483
3
$2,108,333
50
$532,649
30
$143,498
APPLICATIONS WITHDRAWN
89
$556,426
257
$490,808
26
$427,369
0
$0
36
$485,266
2
$200,000
FILES CLOSED FOR INCOMPLETENESS
16
$440,952
69
$509,432
4
$341,148
0
$0
3
$1,133,523
5
$212,186
Aggregated Statistics For Year 2005 (Based on 13 full and 10 partial tracts)
B) Conventional Home Purchase Loans
C) Refinancings
D) Home Improvement Loans
E) Loans on Dwellings For 5+ Families
F) Non-occupant Loans on < 5 Family Dwellings (A B C & D)
G) Loans On Manufactured Home Dwelling (A B C & D)
Number
Average Value
Number
Average Value
Number
Average Value
Number
Average Value
Number
Average Value
Number
Average Value
LOANS ORIGINATED
591
$575,987
1,402
$451,489
189
$389,829
20
$3,794,238
335
$525,777
61
$141,561
APPLICATIONS APPROVED, NOT ACCEPTED
59
$520,248
154
$466,639
28
$253,307
0
$0
35
$423,996
6
$142,337
APPLICATIONS DENIED
160
$559,039
395
$456,205
53
$343,194
1
$1,922,000
83
$659,334
40
$148,312
APPLICATIONS WITHDRAWN
110
$531,937
325
$441,801
52
$375,694
2
$1,450,000
59
$436,602
9
$199,184
FILES CLOSED FOR INCOMPLETENESS
29
$540,179
149
$436,176
6
$351,910
0
$0
25
$594,975
2
$274,855
Aggregated Statistics For Year 2004 (Based on 13 full and 10 partial tracts)
B) Conventional Home Purchase Loans
C) Refinancings
D) Home Improvement Loans
E) Loans on Dwellings For 5+ Families
F) Non-occupant Loans on < 5 Family Dwellings (A B C & D)
G) Loans On Manufactured Home Dwelling (A B C & D)
Number
Average Value
Number
Average Value
Number
Average Value
Number
Average Value
Number
Average Value
Number
Average Value
LOANS ORIGINATED
774
$503,756
1,843
$377,100
121
$308,812
35
$2,347,657
399
$414,633
69
$130,601
APPLICATIONS APPROVED, NOT ACCEPTED
110
$473,934
282
$352,039
20
$273,104
1
$650,000
56
$419,013
5
$294,432
APPLICATIONS DENIED
146
$513,316
385
$393,719
40
$266,406
0
$0
63
$472,164
43
$118,562
APPLICATIONS WITHDRAWN
103
$424,898
414
$368,085
12
$229,764
15
$4,467,068
38
$460,279
19
$192,579
FILES CLOSED FOR INCOMPLETENESS
28
$342,856
80
$387,022
6
$239,345
1
$900,000
12
$382,757
2
$339,625
Aggregated Statistics For Year 2003 (Based on 13 full and 10 partial tracts)
A) FHA, FSA/RHS & VA Home Purchase Loans
B) Conventional Home Purchase Loans
C) Refinancings
D) Home Improvement Loans
E) Loans on Dwellings For 5+ Families
F) Non-occupant Loans on < 5 Family Dwellings (A B C & D)
Number
Average Value
Number
Average Value
Number
Average Value
Number
Average Value
Number
Average Value
Number
Average Value
LOANS ORIGINATED
0
$0
694
$416,454
4,648
$300,162
45
$60,354
44
$1,416,580
673
$325,897
APPLICATIONS APPROVED, NOT ACCEPTED
0
$0
76
$405,404
517
$312,745
11
$73,475
0
$0
72
$326,901
APPLICATIONS DENIED
1
$120,000
93
$437,099
507
$324,661
23
$52,994
0
$0
63
$370,048
APPLICATIONS WITHDRAWN
0
$0
89
$379,984
556
$294,884
7
$154,919
7
$2,217,429
58
$316,303
FILES CLOSED FOR INCOMPLETENESS
0
$0
24
$407,009
90
$299,432
4
$188,788
0
$0
15
$304,649
Aggregated Statistics For Year 2002 (Based on 13 full and 10 partial tracts)
A) FHA, FSA/RHS & VA Home Purchase Loans
B) Conventional Home Purchase Loans
C) Refinancings
D) Home Improvement Loans
E) Loans on Dwellings For 5+ Families
F) Non-occupant Loans on < 5 Family Dwellings (A B C & D)
Number
Average Value
Number
Average Value
Number
Average Value
Number
Average Value
Number
Average Value
Number
Average Value
LOANS ORIGINATED
1
$177,800
751
$327,274
3,205
$299,125
47
$90,583
37
$1,740,907
529
$302,651
APPLICATIONS APPROVED, NOT ACCEPTED
0
$0
112
$322,322
381
$294,575
13
$58,589
0
$0
62
$296,894
APPLICATIONS DENIED
0
$0
93
$324,826
423
$325,761
23
$113,548
0
$0
54
$434,755
APPLICATIONS WITHDRAWN
0
$0
63
$311,133
381
$305,608
14
$113,114
10
$6,163,002
67
$382,865
FILES CLOSED FOR INCOMPLETENESS
0
$0
26
$390,796
116
$316,392
0
$0
5
$1,528,600
7
$414,837
Aggregated Statistics For Year 2001 (Based on 13 full and 10 partial tracts)
A) FHA, FSA/RHS & VA Home Purchase Loans
B) Conventional Home Purchase Loans
C) Refinancings
D) Home Improvement Loans
E) Loans on Dwellings For 5+ Families
F) Non-occupant Loans on < 5 Family Dwellings (A B C & D)
Number
Average Value
Number
Average Value
Number
Average Value
Number
Average Value
Number
Average Value
Number
Average Value
LOANS ORIGINATED
2
$211,240
738
$300,272
2,451
$271,413
72
$67,382
34
$1,491,902
368
$296,628
APPLICATIONS APPROVED, NOT ACCEPTED
0
$0
87
$337,652
284
$260,471
14
$122,664
0
$0
36
$210,503
APPLICATIONS DENIED
0
$0
96
$340,364
376
$284,467
31
$27,369
4
$942,082
58
$418,166
APPLICATIONS WITHDRAWN
1
$213,690
103
$288,982
335
$239,103
23
$79,288
5
$1,266,666
32
$254,215
FILES CLOSED FOR INCOMPLETENESS
1
$184,000
22
$265,722
106
$232,329
4
$80,000
2
$820,000
10
$195,379
Aggregated Statistics For Year 2000 (Based on 13 full and 10 partial tracts)
A) FHA, FSA/RHS & VA Home Purchase Loans
B) Conventional Home Purchase Loans
C) Refinancings
D) Home Improvement Loans
E) Loans on Dwellings For 5+ Families
F) Non-occupant Loans on < 5 Family Dwellings (A B C & D)
Number
Average Value
Number
Average Value
Number
Average Value
Number
Average Value
Number
Average Value
Number
Average Value
LOANS ORIGINATED
4
$140,752
1,172
$261,066
519
$248,511
67
$44,370
20
$2,370,732
190
$299,647
APPLICATIONS APPROVED, NOT ACCEPTED
2
$30,000
149
$301,889
112
$206,763
24
$52,987
2
$2,000,000
28
$217,059
APPLICATIONS DENIED
1
$115,000
166
$280,686
176
$217,251
39
$36,350
0
$0
33
$268,658
APPLICATIONS WITHDRAWN
1
$71,000
111
$241,211
138
$160,451
13
$41,994
2
$500,000
13
$243,682
FILES CLOSED FOR INCOMPLETENESS
0
$0
64
$325,651
42
$219,274
0
$0
0
$0
13
$194,712
Aggregated Statistics For Year 1999 (Based on 3 full and 10 partial tracts)
A) FHA, FSA/RHS & VA Home Purchase Loans
B) Conventional Home Purchase Loans
C) Refinancings
D) Home Improvement Loans
E) Loans on Dwellings For 5+ Families
F) Non-occupant Loans on < 5 Family Dwellings (A B C & D)
2005 - 2018 National Fire Incident Reporting System (NFIRS) incidents
According to the data from the years 2005 - 2018 the average number of fire incidents per year is 96. The highest number of reported fire incidents - 228 took place in 2005, and the least - 1 in 2007. The data has a decreasing trend.
When looking into fire subcategories, the most incidents belonged to: Outside Fires (66.3%), and Structure Fires (17.6%).
Fire incident types reported to NFIRS in Zip Code 93117


 Nearest zip codes: 93463, 93427, 93460, 93440, 93111, 93105.


 (Students: 66, Location: 9467 SAN JULIAN RD., Grades: KG-8)
 According to the data from the years 2005 - 2018 the average number of fire incidents per year is 96. The highest number of reported fire incidents - 228 took place in 2005, and the least - 1 in 2007. The data has a decreasing trend.
 When looking into fire subcategories, the most incidents belonged to: Outside Fires (66.3%), and Structure Fires (17.6%).