Goleta, California Submit your own pictures of this place and show them to the world
OSM Map
General Map
Google Map
MSN Map
OSM Map
General Map
Google Map
MSN Map
OSM Map
General Map
Google Map
MSN Map
OSM Map
General Map
Google Map
MSN Map
Please wait while loading the map...
Population in 2022: 32,432 (100% urban, 0% rural). Population change since 2000: -41.3%Males: 16,787 Females: 15,645
March 2022 cost of living index in Goleta: 116.4 (more than average, U.S. average is 100) Percentage of residents living in poverty in 2022: 11.5%for White Non-Hispanic residents , 4.8% for Black residents , 16.1% for Hispanic or Latino residents , 20.2% for other race residents , 18.6% for two or more races residents )
Profiles of local businesses
Business Search - 14 Million verified businesses
Data:
Median household income ($)
Median household income (% change since 2000)
Household income diversity
Ratio of average income to average house value (%)
Ratio of average income to average rent
Median household income ($) - White
Median household income ($) - Black or African American
Median household income ($) - Asian
Median household income ($) - Hispanic or Latino
Median household income ($) - American Indian and Alaska Native
Median household income ($) - Multirace
Median household income ($) - Other Race
Median household income for houses/condos with a mortgage ($)
Median household income for apartments without a mortgage ($)
Races - White alone (%)
Races - White alone (% change since 2000)
Races - Black alone (%)
Races - Black alone (% change since 2000)
Races - American Indian alone (%)
Races - American Indian alone (% change since 2000)
Races - Asian alone (%)
Races - Asian alone (% change since 2000)
Races - Hispanic (%)
Races - Hispanic (% change since 2000)
Races - Native Hawaiian and Other Pacific Islander alone (%)
Races - Native Hawaiian and Other Pacific Islander alone (% change since 2000)
Races - Two or more races (%)
Races - Two or more races (% change since 2000)
Races - Other race alone (%)
Races - Other race alone (% change since 2000)
Racial diversity
Unemployment (%)
Unemployment (% change since 2000)
Unemployment (%) - White
Unemployment (%) - Black or African American
Unemployment (%) - Asian
Unemployment (%) - Hispanic or Latino
Unemployment (%) - American Indian and Alaska Native
Unemployment (%) - Multirace
Unemployment (%) - Other Race
Population density (people per square mile)
Population - Males (%)
Population - Females (%)
Population - Males (%) - White
Population - Males (%) - Black or African American
Population - Males (%) - Asian
Population - Males (%) - Hispanic or Latino
Population - Males (%) - American Indian and Alaska Native
Population - Males (%) - Multirace
Population - Males (%) - Other Race
Population - Females (%) - White
Population - Females (%) - Black or African American
Population - Females (%) - Asian
Population - Females (%) - Hispanic or Latino
Population - Females (%) - American Indian and Alaska Native
Population - Females (%) - Multirace
Population - Females (%) - Other Race
Coronavirus confirmed cases (Apr 27, 2024)
Deaths caused by coronavirus (Apr 27, 2024)
Coronavirus confirmed cases (per 100k population) (Apr 27, 2024)
Deaths caused by coronavirus (per 100k population) (Apr 27, 2024)
Daily increase in number of cases (Apr 27, 2024)
Weekly increase in number of cases (Apr 27, 2024)
Cases doubled (in days) (Apr 27, 2024)
Hospitalized patients (Apr 18, 2022)
Negative test results (Apr 18, 2022)
Total test results (Apr 18, 2022)
COVID Vaccine doses distributed (per 100k population) (Sep 19, 2023)
COVID Vaccine doses administered (per 100k population) (Sep 19, 2023)
COVID Vaccine doses distributed (Sep 19, 2023)
COVID Vaccine doses administered (Sep 19, 2023)
Likely homosexual households (%)
Likely homosexual households (% change since 2000)
Likely homosexual households - Lesbian couples (%)
Likely homosexual households - Lesbian couples (% change since 2000)
Likely homosexual households - Gay men (%)
Likely homosexual households - Gay men (% change since 2000)
Cost of living index
Median gross rent ($)
Median contract rent ($)
Median monthly housing costs ($)
Median house or condo value ($)
Median house or condo value ($ change since 2000)
Mean house or condo value by units in structure - 1, detached ($)
Mean house or condo value by units in structure - 1, attached ($)
Mean house or condo value by units in structure - 2 ($)
Mean house or condo value by units in structure by units in structure - 3 or 4 ($)
Mean house or condo value by units in structure - 5 or more ($)
Mean house or condo value by units in structure - Boat, RV, van, etc. ($)
Mean house or condo value by units in structure - Mobile home ($)
Median house or condo value ($) - White
Median house or condo value ($) - Black or African American
Median house or condo value ($) - Asian
Median house or condo value ($) - Hispanic or Latino
Median house or condo value ($) - American Indian and Alaska Native
Median house or condo value ($) - Multirace
Median house or condo value ($) - Other Race
Median resident age
Resident age diversity
Median resident age - Males
Median resident age - Females
Median resident age - White
Median resident age - Black or African American
Median resident age - Asian
Median resident age - Hispanic or Latino
Median resident age - American Indian and Alaska Native
Median resident age - Multirace
Median resident age - Other Race
Median resident age - Males - White
Median resident age - Males - Black or African American
Median resident age - Males - Asian
Median resident age - Males - Hispanic or Latino
Median resident age - Males - American Indian and Alaska Native
Median resident age - Males - Multirace
Median resident age - Males - Other Race
Median resident age - Females - White
Median resident age - Females - Black or African American
Median resident age - Females - Asian
Median resident age - Females - Hispanic or Latino
Median resident age - Females - American Indian and Alaska Native
Median resident age - Females - Multirace
Median resident age - Females - Other Race
Commute - mean travel time to work (minutes)
Travel time to work - Less than 5 minutes (%)
Travel time to work - Less than 5 minutes (% change since 2000)
Travel time to work - 5 to 9 minutes (%)
Travel time to work - 5 to 9 minutes (% change since 2000)
Travel time to work - 10 to 19 minutes (%)
Travel time to work - 10 to 19 minutes (% change since 2000)
Travel time to work - 20 to 29 minutes (%)
Travel time to work - 20 to 29 minutes (% change since 2000)
Travel time to work - 30 to 39 minutes (%)
Travel time to work - 30 to 39 minutes (% change since 2000)
Travel time to work - 40 to 59 minutes (%)
Travel time to work - 40 to 59 minutes (% change since 2000)
Travel time to work - 60 to 89 minutes (%)
Travel time to work - 60 to 89 minutes (% change since 2000)
Travel time to work - 90 or more minutes (%)
Travel time to work - 90 or more minutes (% change since 2000)
Marital status - Never married (%)
Marital status - Now married (%)
Marital status - Separated (%)
Marital status - Widowed (%)
Marital status - Divorced (%)
Median family income ($)
Median family income (% change since 2000)
Median non-family income ($)
Median non-family income (% change since 2000)
Median per capita income ($)
Median per capita income (% change since 2000)
Median family income ($) - White
Median family income ($) - Black or African American
Median family income ($) - Asian
Median family income ($) - Hispanic or Latino
Median family income ($) - American Indian and Alaska Native
Median family income ($) - Multirace
Median family income ($) - Other Race
Median year house/condo built
Median year apartment built
Year house built - Built 2005 or later (%)
Year house built - Built 2000 to 2004 (%)
Year house built - Built 1990 to 1999 (%)
Year house built - Built 1980 to 1989 (%)
Year house built - Built 1970 to 1979 (%)
Year house built - Built 1960 to 1969 (%)
Year house built - Built 1950 to 1959 (%)
Year house built - Built 1940 to 1949 (%)
Year house built - Built 1939 or earlier (%)
Average household size
Household density (households per square mile)
Average household size - White
Average household size - Black or African American
Average household size - Asian
Average household size - Hispanic or Latino
Average household size - American Indian and Alaska Native
Average household size - Multirace
Average household size - Other Race
Occupied housing units (%)
Vacant housing units (%)
Owner occupied housing units (%)
Renter occupied housing units (%)
Vacancy status - For rent (%)
Vacancy status - For sale only (%)
Vacancy status - Rented or sold, not occupied (%)
Vacancy status - For seasonal, recreational, or occasional use (%)
Vacancy status - For migrant workers (%)
Vacancy status - Other vacant (%)
Residents with income below the poverty level (%)
Residents with income below 50% of the poverty level (%)
Children below poverty level (%)
Poor families by family type - Married-couple family (%)
Poor families by family type - Male, no wife present (%)
Poor families by family type - Female, no husband present (%)
Poverty status for native-born residents (%)
Poverty status for foreign-born residents (%)
Poverty among high school graduates not in families (%)
Poverty among people who did not graduate high school not in families (%)
Residents with income below the poverty level (%) - White
Residents with income below the poverty level (%) - Black or African American
Residents with income below the poverty level (%) - Asian
Residents with income below the poverty level (%) - Hispanic or Latino
Residents with income below the poverty level (%) - American Indian and Alaska Native
Residents with income below the poverty level (%) - Multirace
Residents with income below the poverty level (%) - Other Race
Air pollution - Air Quality Index (AQI)
Air pollution - CO
Air pollution - NO2
Air pollution - SO2
Air pollution - Ozone
Air pollution - PM10
Air pollution - PM25
Air pollution - Pb
Crime - Murders per 100,000 population
Crime - Rapes per 100,000 population
Crime - Robberies per 100,000 population
Crime - Assaults per 100,000 population
Crime - Burglaries per 100,000 population
Crime - Thefts per 100,000 population
Crime - Auto thefts per 100,000 population
Crime - Arson per 100,000 population
Crime - City-data.com crime index
Crime - Violent crime index
Crime - Property crime index
Crime - Murders per 100,000 population (5 year average)
Crime - Rapes per 100,000 population (5 year average)
Crime - Robberies per 100,000 population (5 year average)
Crime - Assaults per 100,000 population (5 year average)
Crime - Burglaries per 100,000 population (5 year average)
Crime - Thefts per 100,000 population (5 year average)
Crime - Auto thefts per 100,000 population (5 year average)
Crime - Arson per 100,000 population (5 year average)
Crime - City-data.com crime index (5 year average)
Crime - Violent crime index (5 year average)
Crime - Property crime index (5 year average)
1996 Presidential Elections Results (%) - Democratic Party (Clinton)
1996 Presidential Elections Results (%) - Republican Party (Dole)
1996 Presidential Elections Results (%) - Other
2000 Presidential Elections Results (%) - Democratic Party (Gore)
2000 Presidential Elections Results (%) - Republican Party (Bush)
2000 Presidential Elections Results (%) - Other
2004 Presidential Elections Results (%) - Democratic Party (Kerry)
2004 Presidential Elections Results (%) - Republican Party (Bush)
2004 Presidential Elections Results (%) - Other
2008 Presidential Elections Results (%) - Democratic Party (Obama)
2008 Presidential Elections Results (%) - Republican Party (McCain)
2008 Presidential Elections Results (%) - Other
2012 Presidential Elections Results (%) - Democratic Party (Obama)
2012 Presidential Elections Results (%) - Republican Party (Romney)
2012 Presidential Elections Results (%) - Other
2016 Presidential Elections Results (%) - Democratic Party (Clinton)
2016 Presidential Elections Results (%) - Republican Party (Trump)
2016 Presidential Elections Results (%) - Other
2020 Presidential Elections Results (%) - Democratic Party (Biden)
2020 Presidential Elections Results (%) - Republican Party (Trump)
2020 Presidential Elections Results (%) - Other
Ancestries Reported - Arab (%)
Ancestries Reported - Czech (%)
Ancestries Reported - Danish (%)
Ancestries Reported - Dutch (%)
Ancestries Reported - English (%)
Ancestries Reported - French (%)
Ancestries Reported - French Canadian (%)
Ancestries Reported - German (%)
Ancestries Reported - Greek (%)
Ancestries Reported - Hungarian (%)
Ancestries Reported - Irish (%)
Ancestries Reported - Italian (%)
Ancestries Reported - Lithuanian (%)
Ancestries Reported - Norwegian (%)
Ancestries Reported - Polish (%)
Ancestries Reported - Portuguese (%)
Ancestries Reported - Russian (%)
Ancestries Reported - Scotch-Irish (%)
Ancestries Reported - Scottish (%)
Ancestries Reported - Slovak (%)
Ancestries Reported - Subsaharan African (%)
Ancestries Reported - Swedish (%)
Ancestries Reported - Swiss (%)
Ancestries Reported - Ukrainian (%)
Ancestries Reported - United States (%)
Ancestries Reported - Welsh (%)
Ancestries Reported - West Indian (%)
Ancestries Reported - Other (%)
Educational Attainment - No schooling completed (%)
Educational Attainment - Less than high school (%)
Educational Attainment - High school or equivalent (%)
Educational Attainment - Less than 1 year of college (%)
Educational Attainment - 1 or more years of college (%)
Educational Attainment - Associate degree (%)
Educational Attainment - Bachelor's degree (%)
Educational Attainment - Master's degree (%)
Educational Attainment - Professional school degree (%)
Educational Attainment - Doctorate degree (%)
School Enrollment - Nursery, preschool (%)
School Enrollment - Kindergarten (%)
School Enrollment - Grade 1 to 4 (%)
School Enrollment - Grade 5 to 8 (%)
School Enrollment - Grade 9 to 12 (%)
School Enrollment - College undergrad (%)
School Enrollment - Graduate or professional (%)
School Enrollment - Not enrolled in school (%)
School enrollment - Public schools (%)
School enrollment - Private schools (%)
School enrollment - Not enrolled (%)
Median number of rooms in houses and condos
Median number of rooms in apartments
Housing units lacking complete plumbing facilities (%)
Housing units lacking complete kitchen facilities (%)
Density of houses
Urban houses (%)
Rural houses (%)
Households with people 60 years and over (%)
Households with people 65 years and over (%)
Households with people 75 years and over (%)
Households with one or more nonrelatives (%)
Households with no nonrelatives (%)
Population in households (%)
Family households (%)
Nonfamily households (%)
Population in families (%)
Family households with own children (%)
Median number of bedrooms in owner occupied houses
Mean number of bedrooms in owner occupied houses
Median number of bedrooms in renter occupied houses
Mean number of bedrooms in renter occupied houses
Median number of vehichles in owner occupied houses
Mean number of vehichles in owner occupied houses
Median number of vehichles in renter occupied houses
Mean number of vehichles in renter occupied houses
Mortgage status - with mortgage (%)
Mortgage status - with second mortgage (%)
Mortgage status - with home equity loan (%)
Mortgage status - with both second mortgage and home equity loan (%)
Mortgage status - without a mortgage (%)
Average family size
Average family size - White
Average family size - Black or African American
Average family size - Asian
Average family size - Hispanic or Latino
Average family size - American Indian and Alaska Native
Average family size - Multirace
Average family size - Other Race
Geographical mobility - Same house 1 year ago (%)
Geographical mobility - Moved within same county (%)
Geographical mobility - Moved from different county within same state (%)
Geographical mobility - Moved from different state (%)
Geographical mobility - Moved from abroad (%)
Place of birth - Born in state of residence (%)
Place of birth - Born in other state (%)
Place of birth - Native, outside of US (%)
Place of birth - Foreign born (%)
Housing units in structures - 1, detached (%)
Housing units in structures - 1, attached (%)
Housing units in structures - 2 (%)
Housing units in structures - 3 or 4 (%)
Housing units in structures - 5 to 9 (%)
Housing units in structures - 10 to 19 (%)
Housing units in structures - 20 to 49 (%)
Housing units in structures - 50 or more (%)
Housing units in structures - Mobile home (%)
Housing units in structures - Boat, RV, van, etc. (%)
House/condo owner moved in on average (years ago)
Renter moved in on average (years ago)
Year householder moved into unit - Moved in 1999 to March 2000 (%)
Year householder moved into unit - Moved in 1995 to 1998 (%)
Year householder moved into unit - Moved in 1990 to 1994 (%)
Year householder moved into unit - Moved in 1980 to 1989 (%)
Year householder moved into unit - Moved in 1970 to 1979 (%)
Year householder moved into unit - Moved in 1969 or earlier (%)
Means of transportation to work - Drove car alone (%)
Means of transportation to work - Carpooled (%)
Means of transportation to work - Public transportation (%)
Means of transportation to work - Bus or trolley bus (%)
Means of transportation to work - Streetcar or trolley car (%)
Means of transportation to work - Subway or elevated (%)
Means of transportation to work - Railroad (%)
Means of transportation to work - Ferryboat (%)
Means of transportation to work - Taxicab (%)
Means of transportation to work - Motorcycle (%)
Means of transportation to work - Bicycle (%)
Means of transportation to work - Walked (%)
Means of transportation to work - Other means (%)
Working at home (%)
Industry diversity
Most Common Industries - Agriculture, forestry, fishing and hunting, and mining (%)
Most Common Industries - Agriculture, forestry, fishing and hunting (%)
Most Common Industries - Mining, quarrying, and oil and gas extraction (%)
Most Common Industries - Construction (%)
Most Common Industries - Manufacturing (%)
Most Common Industries - Wholesale trade (%)
Most Common Industries - Retail trade (%)
Most Common Industries - Transportation and warehousing, and utilities (%)
Most Common Industries - Transportation and warehousing (%)
Most Common Industries - Utilities (%)
Most Common Industries - Information (%)
Most Common Industries - Finance and insurance, and real estate and rental and leasing (%)
Most Common Industries - Finance and insurance (%)
Most Common Industries - Real estate and rental and leasing (%)
Most Common Industries - Professional, scientific, and management, and administrative and waste management services (%)
Most Common Industries - Professional, scientific, and technical services (%)
Most Common Industries - Management of companies and enterprises (%)
Most Common Industries - Administrative and support and waste management services (%)
Most Common Industries - Educational services, and health care and social assistance (%)
Most Common Industries - Educational services (%)
Most Common Industries - Health care and social assistance (%)
Most Common Industries - Arts, entertainment, and recreation, and accommodation and food services (%)
Most Common Industries - Arts, entertainment, and recreation (%)
Most Common Industries - Accommodation and food services (%)
Most Common Industries - Other services, except public administration (%)
Most Common Industries - Public administration (%)
Occupation diversity
Most Common Occupations - Management, business, science, and arts occupations (%)
Most Common Occupations - Management, business, and financial occupations (%)
Most Common Occupations - Management occupations (%)
Most Common Occupations - Business and financial operations occupations (%)
Most Common Occupations - Computer, engineering, and science occupations (%)
Most Common Occupations - Computer and mathematical occupations (%)
Most Common Occupations - Architecture and engineering occupations (%)
Most Common Occupations - Life, physical, and social science occupations (%)
Most Common Occupations - Education, legal, community service, arts, and media occupations (%)
Most Common Occupations - Community and social service occupations (%)
Most Common Occupations - Legal occupations (%)
Most Common Occupations - Education, training, and library occupations (%)
Most Common Occupations - Arts, design, entertainment, sports, and media occupations (%)
Most Common Occupations - Healthcare practitioners and technical occupations (%)
Most Common Occupations - Health diagnosing and treating practitioners and other technical occupations (%)
Most Common Occupations - Health technologists and technicians (%)
Most Common Occupations - Service occupations (%)
Most Common Occupations - Healthcare support occupations (%)
Most Common Occupations - Protective service occupations (%)
Most Common Occupations - Fire fighting and prevention, and other protective service workers including supervisors (%)
Most Common Occupations - Law enforcement workers including supervisors (%)
Most Common Occupations - Food preparation and serving related occupations (%)
Most Common Occupations - Building and grounds cleaning and maintenance occupations (%)
Most Common Occupations - Personal care and service occupations (%)
Most Common Occupations - Sales and office occupations (%)
Most Common Occupations - Sales and related occupations (%)
Most Common Occupations - Office and administrative support occupations (%)
Most Common Occupations - Natural resources, construction, and maintenance occupations (%)
Most Common Occupations - Farming, fishing, and forestry occupations (%)
Most Common Occupations - Construction and extraction occupations (%)
Most Common Occupations - Installation, maintenance, and repair occupations (%)
Most Common Occupations - Production, transportation, and material moving occupations (%)
Most Common Occupations - Production occupations (%)
Most Common Occupations - Transportation occupations (%)
Most Common Occupations - Material moving occupations (%)
People in Group quarters - Institutionalized population (%)
People in Group quarters - Correctional institutions (%)
People in Group quarters - Federal prisons and detention centers (%)
People in Group quarters - Halfway houses (%)
People in Group quarters - Local jails and other confinement facilities (including police lockups) (%)
People in Group quarters - Military disciplinary barracks (%)
People in Group quarters - State prisons (%)
People in Group quarters - Other types of correctional institutions (%)
People in Group quarters - Nursing homes (%)
People in Group quarters - Hospitals/wards, hospices, and schools for the handicapped (%)
People in Group quarters - Hospitals/wards and hospices for chronically ill (%)
People in Group quarters - Hospices or homes for chronically ill (%)
People in Group quarters - Military hospitals or wards for chronically ill (%)
People in Group quarters - Other hospitals or wards for chronically ill (%)
People in Group quarters - Hospitals or wards for drug/alcohol abuse (%)
People in Group quarters - Mental (Psychiatric) hospitals or wards (%)
People in Group quarters - Schools, hospitals, or wards for the mentally retarded (%)
People in Group quarters - Schools, hospitals, or wards for the physically handicapped (%)
People in Group quarters - Institutions for the deaf (%)
People in Group quarters - Institutions for the blind (%)
People in Group quarters - Orthopedic wards and institutions for the physically handicapped (%)
People in Group quarters - Wards in general hospitals for patients who have no usual home elsewhere (%)
People in Group quarters - Wards in military hospitals for patients who have no usual home elsewhere (%)
People in Group quarters - Juvenile institutions (%)
People in Group quarters - Long-term care (%)
People in Group quarters - Homes for abused, dependent, and neglected children (%)
People in Group quarters - Residential treatment centers for emotionally disturbed children (%)
People in Group quarters - Training schools for juvenile delinquents (%)
People in Group quarters - Short-term care, detention or diagnostic centers for delinquent children (%)
People in Group quarters - Type of juvenile institution unknown (%)
People in Group quarters - Noninstitutionalized population (%)
People in Group quarters - College dormitories (includes college quarters off campus) (%)
People in Group quarters - Military quarters (%)
People in Group quarters - On base (%)
People in Group quarters - Barracks, unaccompanied personnel housing (UPH), (Enlisted/Officer), ;and similar group living quarters for military personnel (%)
People in Group quarters - Transient quarters for temporary residents (%)
People in Group quarters - Military ships (%)
People in Group quarters - Group homes (%)
People in Group quarters - Homes or halfway houses for drug/alcohol abuse (%)
People in Group quarters - Homes for the mentally ill (%)
People in Group quarters - Homes for the mentally retarded (%)
People in Group quarters - Homes for the physically handicapped (%)
People in Group quarters - Other group homes (%)
People in Group quarters - Religious group quarters (%)
People in Group quarters - Dormitories (%)
People in Group quarters - Agriculture workers' dormitories on farms (%)
People in Group quarters - Job Corps and vocational training facilities (%)
People in Group quarters - Other workers' dormitories (%)
People in Group quarters - Crews of maritime vessels (%)
People in Group quarters - Other nonhousehold living situations (%)
People in Group quarters - Other noninstitutional group quarters (%)
Residents speaking English at home (%)
Residents speaking English at home - Born in the United States (%)
Residents speaking English at home - Native, born elsewhere (%)
Residents speaking English at home - Foreign born (%)
Residents speaking Spanish at home (%)
Residents speaking Spanish at home - Born in the United States (%)
Residents speaking Spanish at home - Native, born elsewhere (%)
Residents speaking Spanish at home - Foreign born (%)
Residents speaking other language at home (%)
Residents speaking other language at home - Born in the United States (%)
Residents speaking other language at home - Native, born elsewhere (%)
Residents speaking other language at home - Foreign born (%)
Class of Workers - Employee of private company (%)
Class of Workers - Self-employed in own incorporated business (%)
Class of Workers - Private not-for-profit wage and salary workers (%)
Class of Workers - Local government workers (%)
Class of Workers - State government workers (%)
Class of Workers - Federal government workers (%)
Class of Workers - Self-employed workers in own not incorporated business and Unpaid family workers (%)
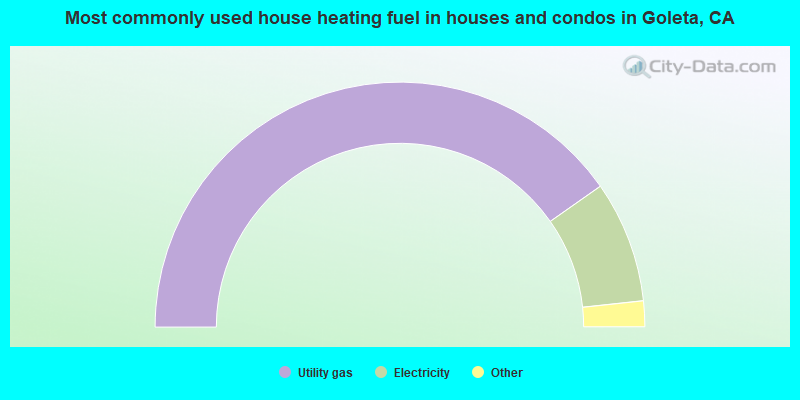
House heating fuel used in houses and condos - Utility gas (%)
House heating fuel used in houses and condos - Bottled, tank, or LP gas (%)
House heating fuel used in houses and condos - Electricity (%)
House heating fuel used in houses and condos - Fuel oil, kerosene, etc. (%)
House heating fuel used in houses and condos - Coal or coke (%)
House heating fuel used in houses and condos - Wood (%)
House heating fuel used in houses and condos - Solar energy (%)
House heating fuel used in houses and condos - Other fuel (%)
House heating fuel used in houses and condos - No fuel used (%)
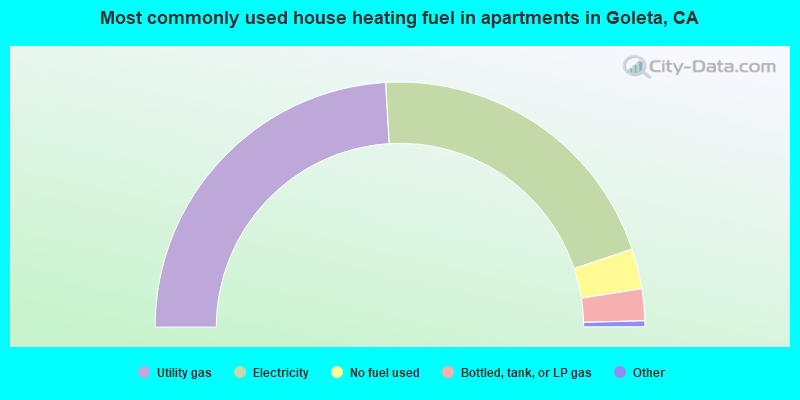
House heating fuel used in apartments - Utility gas (%)
House heating fuel used in apartments - Bottled, tank, or LP gas (%)
House heating fuel used in apartments - Electricity (%)
House heating fuel used in apartments - Fuel oil, kerosene, etc. (%)
House heating fuel used in apartments - Coal or coke (%)
House heating fuel used in apartments - Wood (%)
House heating fuel used in apartments - Solar energy (%)
House heating fuel used in apartments - Other fuel (%)
House heating fuel used in apartments - No fuel used (%)
Armed forces status - In Armed Forces (%)
Armed forces status - Civilian (%)
Armed forces status - Civilian - Veteran (%)
Armed forces status - Civilian - Nonveteran (%)
Fatal accidents locations in years 2005-2021
Fatal accidents locations in 2005
Fatal accidents locations in 2006
Fatal accidents locations in 2007
Fatal accidents locations in 2008
Fatal accidents locations in 2009
Fatal accidents locations in 2010
Fatal accidents locations in 2011
Fatal accidents locations in 2012
Fatal accidents locations in 2013
Fatal accidents locations in 2014
Fatal accidents locations in 2015
Fatal accidents locations in 2016
Fatal accidents locations in 2017
Fatal accidents locations in 2018
Fatal accidents locations in 2019
Fatal accidents locations in 2020
Fatal accidents locations in 2021
Alcohol use - People drinking some alcohol every month (%)
Alcohol use - People not drinking at all (%)
Alcohol use - Average days/month drinking alcohol
Alcohol use - Average drinks/week
Alcohol use - Average days/year people drink much
Audiometry - Average condition of hearing (%)
Audiometry - People that can hear a whisper from across a quiet room (%)
Audiometry - People that can hear normal voice from across a quiet room (%)
Audiometry - Ears ringing, roaring, buzzing (%)
Audiometry - Had a job exposure to loud noise (%)
Audiometry - Had off-work exposure to loud noise (%)
Blood Pressure & Cholesterol - Has high blood pressure (%)
Blood Pressure & Cholesterol - Checking blood pressure at home (%)
Blood Pressure & Cholesterol - Frequently checking blood cholesterol (%)
Blood Pressure & Cholesterol - Has high cholesterol level (%)
Consumer Behavior - Money monthly spent on food at supermarket/grocery store
Consumer Behavior - Money monthly spent on food at other stores
Consumer Behavior - Money monthly spent on eating out
Consumer Behavior - Money monthly spent on carryout/delivered foods
Consumer Behavior - Income spent on food at supermarket/grocery store (%)
Consumer Behavior - Income spent on food at other stores (%)
Consumer Behavior - Income spent on eating out (%)
Consumer Behavior - Income spent on carryout/delivered foods (%)
Current Health Status - General health condition (%)
Current Health Status - Blood donors (%)
Current Health Status - Has blood ever tested for HIV virus (%)
Current Health Status - Left-handed people (%)
Dermatology - People using sunscreen (%)
Diabetes - Diabetics (%)
Diabetes - Had a blood test for high blood sugar (%)
Diabetes - People taking insulin (%)
Diet Behavior & Nutrition - Diet health (%)
Diet Behavior & Nutrition - Milk product consumption (# of products/month)
Diet Behavior & Nutrition - Meals not home prepared (#/week)
Diet Behavior & Nutrition - Meals from fast food or pizza place (#/week)
Diet Behavior & Nutrition - Ready-to-eat foods (#/month)
Diet Behavior & Nutrition - Frozen meals/pizza (#/month)
Drug Use - People that ever used marijuana or hashish (%)
Drug Use - Ever used hard drugs (%)
Drug Use - Ever used any form of cocaine (%)
Drug Use - Ever used heroin (%)
Drug Use - Ever used methamphetamine (%)
Health Insurance - People covered by health insurance (%)
Kidney Conditions-Urology - Avg. # of times urinating at night
Medical Conditions - People with asthma (%)
Medical Conditions - People with anemia (%)
Medical Conditions - People with psoriasis (%)
Medical Conditions - People with overweight (%)
Medical Conditions - Elderly people having difficulties in thinking or remembering (%)
Medical Conditions - People who ever received blood transfusion (%)
Medical Conditions - People having trouble seeing even with glass/contacts (%)
Medical Conditions - People with arthritis (%)
Medical Conditions - People with gout (%)
Medical Conditions - People with congestive heart failure (%)
Medical Conditions - People with coronary heart disease (%)
Medical Conditions - People with angina pectoris (%)
Medical Conditions - People who ever had heart attack (%)
Medical Conditions - People who ever had stroke (%)
Medical Conditions - People with emphysema (%)
Medical Conditions - People with thyroid problem (%)
Medical Conditions - People with chronic bronchitis (%)
Medical Conditions - People with any liver condition (%)
Medical Conditions - People who ever had cancer or malignancy (%)
Mental Health - People who have little interest in doing things (%)
Mental Health - People feeling down, depressed, or hopeless (%)
Mental Health - People who have trouble sleeping or sleeping too much (%)
Mental Health - People feeling tired or having little energy (%)
Mental Health - People with poor appetite or overeating (%)
Mental Health - People feeling bad about themself (%)
Mental Health - People who have trouble concentrating on things (%)
Mental Health - People moving or speaking slowly or too fast (%)
Mental Health - People having thoughts they would be better off dead (%)
Oral Health - Average years since last visit a dentist
Oral Health - People embarrassed because of mouth (%)
Oral Health - People with gum disease (%)
Oral Health - General health of teeth and gums (%)
Oral Health - Average days a week using dental floss/device
Oral Health - Average days a week using mouthwash for dental problem
Oral Health - Average number of teeth
Pesticide Use - Households using pesticides to control insects (%)
Pesticide Use - Households using pesticides to kill weeds (%)
Physical Activity - People doing vigorous-intensity work activities (%)
Physical Activity - People doing moderate-intensity work activities (%)
Physical Activity - People walking or bicycling (%)
Physical Activity - People doing vigorous-intensity recreational activities (%)
Physical Activity - People doing moderate-intensity recreational activities (%)
Physical Activity - Average hours a day doing sedentary activities
Physical Activity - Average hours a day watching TV or videos
Physical Activity - Average hours a day using computer
Physical Functioning - People having limitations keeping them from working (%)
Physical Functioning - People limited in amount of work they can do (%)
Physical Functioning - People that need special equipment to walk (%)
Physical Functioning - People experiencing confusion/memory problems (%)
Physical Functioning - People requiring special healthcare equipment (%)
Prescription Medications - Average number of prescription medicines taking
Preventive Aspirin Use - Adults 40+ taking low-dose aspirin (%)
Reproductive Health - Vaginal deliveries (%)
Reproductive Health - Cesarean deliveries (%)
Reproductive Health - Deliveries resulted in a live birth (%)
Reproductive Health - Pregnancies resulted in a delivery (%)
Reproductive Health - Women breastfeeding newborns (%)
Reproductive Health - Women that had a hysterectomy (%)
Reproductive Health - Women that had both ovaries removed (%)
Reproductive Health - Women that have ever taken birth control pills (%)
Reproductive Health - Women taking birth control pills (%)
Reproductive Health - Women that have ever used Depo-Provera or injectables (%)
Reproductive Health - Women that have ever used female hormones (%)
Sexual Behavior - People 18+ that ever had sex (vaginal, anal, or oral) (%)
Sexual Behavior - Males 18+ that ever had vaginal sex with a woman (%)
Sexual Behavior - Males 18+ that ever performed oral sex on a woman (%)
Sexual Behavior - Males 18+ that ever had anal sex with a woman (%)
Sexual Behavior - Males 18+ that ever had any sex with a man (%)
Sexual Behavior - Females 18+ that ever had vaginal sex with a man (%)
Sexual Behavior - Females 18+ that ever performed oral sex on a man (%)
Sexual Behavior - Females 18+ that ever had anal sex with a man (%)
Sexual Behavior - Females 18+ that ever had any kind of sex with a woman (%)
Sexual Behavior - Average age people first had sex
Sexual Behavior - Average number of female sex partners in lifetime (males 18+)
Sexual Behavior - Average number of female vaginal sex partners in lifetime (males 18+)
Sexual Behavior - Average age people first performed oral sex on a woman (18+)
Sexual Behavior - Average number of woman performed oral sex on in lifetime (18+)
Sexual Behavior - Average number of male sex partners in lifetime (males 18+)
Sexual Behavior - Average number of male anal sex partners in lifetime (males 18+)
Sexual Behavior - Average age people first performed oral sex on a man (18+)
Sexual Behavior - Average number of male oral sex partners in lifetime (18+)
Sexual Behavior - People using protection when performing oral sex (%)
Sexual Behavior - Average number of times people have vaginal or anal sex a year
Sexual Behavior - People having sex without condom (%)
Sexual Behavior - Average number of male sex partners in lifetime (females 18+)
Sexual Behavior - Average number of male vaginal sex partners in lifetime (females 18+)
Sexual Behavior - Average number of female sex partners in lifetime (females 18+)
Sexual Behavior - Circumcised males 18+ (%)
Sleep Disorders - Average hours sleeping at night
Sleep Disorders - People that has trouble sleeping (%)
Smoking-Cigarette Use - People smoking cigarettes (%)
Taste & Smell - People 40+ having problems with smell (%)
Taste & Smell - People 40+ having problems with taste (%)
Taste & Smell - People 40+ that ever had wisdom teeth removed (%)
Taste & Smell - People 40+ that ever had tonsils teeth removed (%)
Taste & Smell - People 40+ that ever had a loss of consciousness because of a head injury (%)
Taste & Smell - People 40+ that ever had a broken nose or other serious injury to face or skull (%)
Taste & Smell - People 40+ that ever had two or more sinus infections (%)
Weight - Average height (inches)
Weight - Average weight (pounds)
Weight - Average BMI
Weight - People that are obese (%)
Weight - People that ever were obese (%)
Weight - People trying to lose weight (%)
14,539 44.7% White alone 12,049 37.0% Hispanic 3,287 10.1% Asian alone 1,708 5.2% Two or more races 768 2.4% Black alone 125 0.4% Other race alone
According to our research of California and other state lists, there were 40 registered sex offenders living in Goleta, California as of April 27, 2024 . The ratio of all residents to sex offenders in Goleta is 779 to 1.The ratio of registered sex offenders to all residents in this city is near the state average.
Officers per 1,000 residents here:
0.03California average:
1.98
Latest news from Goleta, CA collected exclusively by city-data.com from local newspapers, TV, and radio stations
Ancestries: English (4.2%), German (3.7%), Irish (3.1%), Eastern European (3.0%), European (2.6%), American (2.6%).
Current Local Time:
Land area: 26.3 square miles.
Population density: 1,235 people per square mile (low).
7,609 residents are foreign born (12.1% Latin America , 8.0% Asia ).
This place:
23.4%California:
26.5%
Median real estate property taxes paid for housing units with mortgages in 2022: $6,551 (0.7%)Median real estate property taxes paid for housing units with no mortgage in 2022: $3,862 (0.4%)
Nearest city with pop. 200,000+: Bakersfield, CA
Nearest city with pop. 1,000,000+: Los Angeles, CA
Nearest cities:
Latitude: 34.44 N, Longitude: 119.81 W
Daytime population change due to commuting: +5,775 (+17.7%)Workers who live and work in this place: 7,302 (42.1%)
Area code commonly used in this area: 805
Property values in Goleta, CA
Goleta tourist attractions:
Single-family new house construction building permits:
2022: 3 buildings , average cost: $111,7002021: 1 building , cost: $135,0002020: 109 buildings , average cost: $249,6002019: 146 buildings , average cost: $241,0002018: 44 buildings , average cost: $222,5002017: 42 buildings , average cost: $222,5002016: 3 buildings , average cost: $362,6002015: 3 buildings , average cost: $145,7002014: 4 buildings , average cost: $145,7002013: 4 buildings , average cost: $145,7002012: 3 buildings , average cost: $145,7002011: 2 buildings , average cost: $145,7002010: 2 buildings , average cost: $145,7002009: 37 buildings , average cost: $216,4002008: 43 buildings , average cost: $216,4002007: 14 buildings , average cost: $225,0002006: 56 buildings , average cost: $240,8002005: 1 building , cost: $189,4002004: 7 buildings , average cost: $287,300Unemployment in December 2023:
Most common occupations in Goleta, CA (%)
Both Males Females
Other management occupations, except farmers and farm managers (5.8%)
Computer specialists (3.9%)
Other office and administrative support workers, including supervisors (3.6%)
Building and grounds cleaning and maintenance occupations (3.5%)
Postsecondary teachers (3.5%)
Other sales and related occupations, including supervisors (3.3%)
Retail sales workers, except cashiers (2.9%)
Other management occupations, except farmers and farm managers (6.8%)
Computer specialists (5.6%)
Engineers (4.8%)
Building and grounds cleaning and maintenance occupations (4.7%)
Postsecondary teachers (3.6%)
Other sales and related occupations, including supervisors (3.5%)
Retail sales workers, except cashiers (2.9%)
Other office and administrative support workers, including supervisors (6.2%)
Secretaries and administrative assistants (6.0%)
Preschool, kindergarten, elementary, and middle school teachers (5.3%)
Other management occupations, except farmers and farm managers (4.7%)
Bookkeeping, accounting, and auditing clerks (3.7%)
Information and record clerks, except customer service representatives (3.6%)
Postsecondary teachers (3.3%)
Earthquake activity:
Goleta-area historical earthquake activity is significantly above California state average. It is 6480% greater than the overall U.S. average. On 7/21/1952 at 11:52:14, a magnitude 7.7 (7.7 UK, Class: Major, Intensity: VIII - XII) earthquake occurred 60.3 miles away from Goleta center, causing $50,000,000 total damage On 11/4/1927 at 13:51:53, a magnitude 7.5 (7.5 UK) earthquake occurred 76.6 miles away from the city center On 6/28/1992 at 11:57:34, a magnitude 7.6 (6.2 MB, 7.6 MS, 7.3 MW, Depth: 0.7 mi) earthquake occurred 188.3 miles away from Goleta center, causing 3 deaths ( 1 shaking deaths, 2 other deaths) and 400 injuries, causing $100,000,000 total damage and $40,000,000 insured lossesOn 4/18/1906 at 13:12:21, a magnitude 7.9 (7.9 UK) earthquake occurred 303.6 miles away from Goleta center, causing $524,000,000 total damage On 10/16/1999 at 09:46:44, a magnitude 7.4 (6.3 MB, 7.4 MS, 7.2 MW, 7.3 ML) earthquake occurred 192.7 miles away from Goleta center On 1/17/1994 at 12:30:55, a magnitude 6.8 (6.4 MB, 6.8 MS, 6.7 MW, Depth: 11.4 mi, Class: Strong, Intensity: VII - IX) earthquake occurred 73.5 miles away from Goleta center, causing 60 deaths ( 60 shaking deaths) and 7000 injuriesMagnitude types: body-wave magnitude (MB), local magnitude (ML), surface-wave magnitude (MS), moment magnitude (MW) Natural disasters: The number of natural disasters in Santa Barbara County (31) is a lot greater than the US average (15).Major Disasters (Presidential) Declared: 19Emergencies Declared: 3Floods: 17, Fires: 10, Storms: 8, Winter Storms: 8, Mudslides: 7, Landslides: 4, Drought: 1, Earthquake: 1, Freeze: 1, Hurricane: 1, Tornado: 1, Wind: 1, Other: 1 (Note: some incidents may be assigned to more than one category). Main business address for: DECKERS OUTDOOR CORP RUBBER & PLASTICS FOOTWEAR ), COMMUNITY WEST BANCSHARES / STATE COMMERCIAL BANKS ).
Hospitals and medical centers in Goleta: GENESIS DEVELOPMENTAL SERVICES - SALISBURY (264 SALISBURY AVE) Other hospitals and medical centers near Goleta: BUENA VISTA CARE CENTER (Nursing Home, about 1 miles away; SANTA BARBARA, CA)
CARMEL HOME HEALTH SERVICES INC (Home Health Center, about 1 miles away; SANTA BARBARA, CA)
GOLETA VALLEY COTTAGE HOSPITAL (about 1 miles away; SANTA BARBARA, CA)
MILTON HOUSE (Hospital, about 1 miles away; SANTA BARBARA, CA)
SANTA BARBARA CNTY PSYCH HLTH FACILITY (Hospital, about 3 miles away; SANTA BARBARA, CA)
REHABILITATION INSTITUTE AT SB,THE (Nursing Home, about 3 miles away; SANTA BARBARA, CA)
FMC-SANTA BARBARA COMMUNITY DIALYSIS CENTER (Dialysis Facility, about 4 miles away; SANTA BARBARA, CA)
Heliports located in Goleta: Amtrak station: GOLETA (S. LA PATERA LN.)
Colleges/universities with over 2000 students nearest to Goleta:
University of California-Santa Barbara (about 3 miles; Santa Barbara, CA ; Full-time enrollment: 22,806)
Santa Barbara City College (about 7 miles; Santa Barbara, CA ; FT enrollment: 12,568)
Ventura College (about 36 miles; Ventura, CA ; FT enrollment: 8,460)
Oxnard College (about 43 miles; Oxnard, CA ; FT enrollment: 3,879)
California State University-Channel Islands (about 49 miles; Camarillo, CA ; FT enrollment: 4,163)
Allan Hancock College (about 50 miles; Santa Maria, CA ; FT enrollment: 6,639)
Taft College (about 53 miles; Taft, CA ; FT enrollment: 2,121)
Public high schools in Goleta: DOS PUEBLOS SENIOR HIGH Students: 1,721, Location: 7266 ALAMEDA AVE., Grades: 9-12)DOS PUEBLOS CHARGER ACADEMY Location: 7268 ALAMEDA AVE., Grades: 9-12)
Public elementary/middle schools in Goleta: GOLETA VALLEY JUNIOR HIGH Students: 789, Location: 6100 STOW CANYON RD., Grades: 7-8)BRANDON ELEMENTARY Students: 294, Location: 195 BRANDON DR., Grades: KG-6)ELLWOOD ELEMENTARY Students: 287, Location: 7686 HOLLISTER AVE., Grades: KG-6)ISLA VISTA ELEMENTARY Students: 278, Location: 6875 EL COLEGIO RD., Grades: KG-6)KELLOGG ELEMENTARY Students: 278, Location: 475 CAMBRIDGE AVE., Grades: KG-6)LA PATERA ELEMENTARY Students: 276, Location: 555 N. LA PATERA LN., Grades: KG-6)SANTA BARBARA CHARTER Students: 116, Location: 6100 STOW CANYON RD., Grades: KG-8, Charter school )Private elementary/middle schools in Goleta: SANTA BARBARA MONTESSORI SCHOOL Students: 142, Location: 7421 MIRANO DR, Grades: PK-8)WALDORF SCHOOL OF SANTA BARBARA Students: 110, Location: 401 N FAIRVIEW AVE, Grades: PK-8)
COASTLINE CHRISTIAN ACADEMY Students: 89, Location: 5950 CATHEDRAL OAKS RD, Grades: KG-8)
See full list of schools located in Goleta
Notable locations in Goleta: (A) , Santa Barbara Twin Drive-In (B) , La Cumbre Country Club (C) , Cathedral Oaks Tennis Club (D) , Ocean Meadows Golf Course (E) , County of Santa Barbara Honor Farm (F) , Southern Pacific Station (G) , Corona Del Mar Rancho (H) , Ellwood Energy Support Facility (I) , Santa Barbara County Jail (J) , La Morada Girls Home (K) , Hope House (L) , Goleta Valley Chamber of Commerce (M) , Goleta Branch Santa Barbara Public Library (N) , Coastal Resource Information Center (O) , Cathedral Oaks County School Administration Building (P) , San Jose Winery (Q) , Joseph Sexton House (R) , Horace Sexton Museum (S) , Goleta Valley Community Center (T) . Display/hide their locations on the map
Shopping Centers: (1) , University Plaza Shopping Center (2) , Turnpike Shopping Center (3) , Padre Shopping Center (4) , Magnolia Shopping Center (5) . Display/hide their locations on the map
Main business address in Goleta: (A) . Display/hide its location on the map
Churches in Goleta include: (A) , Christ Lutheran Church (B) , Christ the King Episcopal Church (C) , Community Covenant Church (D) , Harvest Christian Fellowship Church (E) , Christ Presbyterian Church (F) , Church of Christ (G) , Church of Religious Science (H) , Congregation B'nai Brith (I) . Display/hide their locations on the map
Cemeteries: (1) , La Patera Catholic Cemetery (2) . Display/hide their locations on the map
Lakes and reservoirs: (A) , Lake Los Carneros (B) , Lauro Reservoir (C) . Display/hide their locations on the map
Creeks: (A) , Cieneguitas Creek (B) , Atascadero Creek (C) , San Jose Creek (D) , San Antonio Creek (E) . Display/hide their locations on the map
Parks in Goleta include: (1) , Federated Sportsmans Field (2) , Bella Vista Park (3) , Berkeley Park (4) , Lake Los Carneros Park (5) , San Antonio Canyon Park (6) , Stow Grove Park (7) , Tuckers Grove County Park (8) . Display/hide their locations on the map
Beach: (A) . Display/hide its location on the map
Tourist attraction: (1) . Display/hide its approximate location on the map
Hotel: (1) . Display/hide its approximate location on the map
Court: (1) . Display/hide its approximate location on the map
Birthplace of: Jay Staggs - Player of and football, Patricia Soltysik - Criminal, Bill Lillard - Baseball player, Donald Willis - Football player, Josh Engle - College football player (New Mexico Lobos), Tarrik Brock - Baseball player.
Santa Barbara County has a predicted average indoor radon screening level greater than 4 pCi/L (pico curies per liter) - Highest Potential Drinking water stations with addresses in Goleta that have no violations reported:
SOUTH COAST INN (Population served: 1,000, Primary Water Source Type: Groundwater)
EL CAPITAN BEACH STATE PARK (Population served: 900, Primary Water Source Type: Groundwater)
REFUGIO STATE BEACH (Population served: 850, Primary Water Source Type: Groundwater)
LAS CRUCES STATE PARK (Population served: 30, Primary Water Source Type: Groundwater under infl of surface water)
Average household size: This place:
2.7 peopleCalifornia:
2.9 people
Percentage of family households: This place:
62.4%Whole state:
68.7%
Percentage of households with unmarried partners: This place:
6.9%Whole state:
7.2%
Likely homosexual households (counted as self-reported same-sex unmarried-partner households)
Lesbian couples: 0.5% of all households Gay men: 0.3% of all households
People in group quarters in Goleta in 2010:
170 people in nursing facilities/skilled-nursing facilities
17 people in group homes intended for adults
8 people in group homes for juveniles (non-correctional)
3 people in workers' group living quarters and job corps centers
3 people in other noninstitutional facilities
People in group quarters in Goleta in 2000:
334 people in other noninstitutional group quarters
167 people in nursing homes
102 people in schools, hospitals, or wards for the intellectually disabled
52 people in other group homes
46 people in wards in general hospitals for patients who have no usual home elsewhere
33 people in orthopedic wards and institutions for the physically handicapped
33 people in short-term care, detention or diagnostic centers for delinquent children
13 people in local jails and other confinement facilities (including police lockups)
13 people in mental (psychiatric) hospitals or wards
12 people in other nonhousehold living situations
9 people in homes or halfway houses for drug/alcohol abuse
8 people in religious group quarters
6 people in training schools for juvenile delinquents
6 people in agriculture workers' dormitories on farms
5 people in job corps and vocational training facilities
4 people in homes for the mentally ill
4 people in homes for the mentally retarded
Banks with branches in Goleta (2011 data):
Santa Barbara Bank & Trust, National Association: Camino Real Branch, Goleta Branch, Maravilla Branch. Info updated 2011/06/09: Bank assets: $5,847.9 mil, Deposits: $4,684.3 mil, headquarters in Santa Barbara, CA, positive income , Commercial Lending Specialization, 48 total offices , Holding Company: Sb Acquisition Company, Llc
Community West Bank, National Association: at 5827 Hollister Avenue, branch established on 1989/08/21; Corporate Branch at 445 Pine Avenue, branch established on 1994/02/24. Info updated 2006/11/03: Bank assets: $633.1 mil, Deposits: $516.7 mil, local headquarters , negative income in the last year , Commercial Lending Specialization, 7 total offices , Holding Company: Community West Bancshares
Montecito Bank & Trust: Goleta Branch at 5658 Calle Real, branch established on 1979/11/01; Hollister Branch at 6900 Hollister Avenue, branch established on 2012/01/23. Info updated 2009/04/07: Bank assets: $1,018.4 mil, Deposits: $875.7 mil, headquarters in Santa Barbara, CA, positive income , Commercial Lending Specialization, 10 total offices , Holding Company: Montecito Bancorp
Pacific Western Bank: Goleta Branch at 197 North Fairview, branch established on 2003/06/30. Info updated 2011/03/14: Bank assets: $5,513.1 mil, Deposits: $4,614.5 mil, headquarters in Los Angeles, CA, positive income , Commercial Lending Specialization, 78 total offices , Holding Company: Capgen Capital Group Ii Lp
Rabobank, National Association: Goleta Valley Branch at 5956 Calle Real, branch established on 1964/10/19. Info updated 2011/01/27: Bank assets: $11,745.0 mil, Deposits: $8,446.0 mil, headquarters in Roseville, CA, positive income , Agricultural Specialization, 124 total offices , Holding Company: Cooperatieve Centrale Raiffeisen-Boerenleenbank B.A., "rabobank Nederland
Bank of America, National Association: Goleta Branch at 5892 Calle Real, branch established on 1936/06/01. Info updated 2009/11/18: Bank assets: $1,451,969.3 mil, Deposits: $1,077,176.8 mil, headquarters in Charlotte, NC, positive income , 5782 total offices , Holding Company: Bank Of America Corporation
Wells Fargo Bank, National Association: Goleta Branch at 195 North Fairview Avenue, branch established on 1965/10/24. Info updated 2011/04/05: Bank assets: $1,161,490.0 mil, Deposits: $905,653.0 mil, headquarters in Sioux Falls, SD, positive income , 6395 total offices , Holding Company: Wells Fargo & Company
For population 15 years and over in Goleta:
Never married: 42.7%Now married: 43.9%Separated: 1.4%Widowed: 3.3%Divorced: 8.7% For population 25 years and over in Goleta:
High school or higher: 87.5%Bachelor's degree or higher: 50.0%Graduate or professional degree: 20.5%Unemployed: 2.9%Mean travel time to work (commute): 14.8 minutes
Education Gini index (Inequality in education) Here:
16.0California average:
15.5
Religion statistics for Goleta, CA (based on Santa Barbara County data)
Religion Adherents Congregations Catholic 146,940 17 Evangelical Protestant 24,775 161 Other 15,951 58 Mainline Protestant 10,610 43 Black Protestant 1,979 13 Orthodox 1,536 7 None 222,104 -
Source: Clifford Grammich, Kirk Hadaway, Richard Houseal, Dale E.Jones, Alexei Krindatch, Richie Stanley and Richard H.Taylor. 2012. 2010 U.S.Religion Census: Religious Congregations & Membership Study. Association of Statisticians of American Religious Bodies. Jones, Dale E., et al. 2002. Congregations and Membership in the United States 2000. Nashville, TN: Glenmary Research Center. Graphs represent county-level data
Food Environment Statistics: Number of grocery stores : 105Here :
2.61 / 10,000 pop.California :
2.14 / 10,000 pop.
Number of supercenters and club stores : 2Santa Barbara County :
0.05 / 10,000 pop.California :
0.04 / 10,000 pop.
Number of convenience stores (no gas) : 30This county :
0.75 / 10,000 pop.State :
0.62 / 10,000 pop.
Number of convenience stores (with gas) : 74Santa Barbara County :
1.84 / 10,000 pop.State :
1.49 / 10,000 pop.
Number of full-service restaurants : 388Santa Barbara County :
9.65 / 10,000 pop.California :
7.42 / 10,000 pop.
Adult diabetes rate : This county :
7.3%California :
7.3%
Adult obesity rate : Santa Barbara County :
22.2%California :
21.3%
Low-income preschool obesity rate : Santa Barbara County :
18.3%State :
17.9%
Health and Nutrition: Healthy diet rate : Goleta:
50.6%California:
49.4%
Average overall health of teeth and gums : This city:
49.1%State:
48.0%
People feeling badly about themselves : Here:
20.4%California:
20.2%
People not drinking alcohol at all : This city:
10.2%California:
11.2%
Average hours sleeping at night : Overweight people : Goleta:
33.3%California:
31.5%
General health condition : This city:
57.0%State:
56.4%
Average condition of hearing : Here:
79.3%California:
80.9%
More about Health and Nutrition of Goleta, CA Residents
Local government employment and payroll (March 2022)
Function
Full-time employees
Monthly full-time payroll
Average yearly full-time wage
Part-time employees
Monthly part-time payroll
Other Government Administration
54 $631,993 $140,443 13 $7,524 Financial Administration
9 $88,027 $117,369 0 $0 Streets and Highways
5 $42,328 $101,587 0 $0 Parks and Recreation
2 $28,848 $173,088 0 $0 Judicial and Legal
2 $25,991 $155,946 0 $0 Solid Waste Management
1 $12,240 $146,880 0 $0
Totals for Government
73 $829,427 $136,344 13 $7,524
Goleta government finances - Expenditure in 2017 (per resident):
Construction - Regular Highways: $8,891,000 ($274.14)
Parks and Recreation: $2,021,000 ($62.31)Housing and Community Development: $1,319,000 ($40.67)Central Staff Services: $523,000 ($16.13)Health - Other: $103,000 ($3.18)Current Operations - Central Staff Services: $9,054,000 ($279.17)
Police Protection: $7,712,000 ($237.79)Regular Highways: $4,357,000 ($134.34)Housing and Community Development: $2,713,000 ($83.65)Protective Inspection and Regulation - Other: $986,000 ($30.40)Parks and Recreation: $979,000 ($30.19)Financial Administration: $531,000 ($16.37)Libraries: $384,000 ($11.84)Health - Other: $282,000 ($8.70)General - Other: $28,000 ($0.86)Transit Utilities: $25,000 ($0.77)General - Interest on Debt: $1,173,000 ($36.17)
Other Capital Outlay - Parks and Recreation: $102,000 ($3.15)
Central Staff Services: $43,000 ($1.33)Libraries: $16,000 ($0.49)Regular Highways: $12,000 ($0.37)Local Fire Protection: $1,000 ($0.03)
Goleta government finances - Revenue in 2017 (per resident):
Charges - Other: $2,558,000 ($78.87)
Solid Waste Management: $605,000 ($18.65)Regular Highways: $286,000 ($8.82)Federal Intergovernmental - Other: $968,000 ($29.85)
Housing and Community Development: $214,000 ($6.60)Local Intergovernmental - Other: $66,000 ($2.04)
Miscellaneous - Special Assessments: $11,878,000 ($366.24)
General Revenue - Other: $828,000 ($25.53)Interest Earnings: $379,000 ($11.69)Donations From Private Sources: $174,000 ($5.37)Fines and Forfeits: $129,000 ($3.98)Rents: $36,000 ($1.11)State Intergovernmental - Highways: $594,000 ($18.32)
Other: $514,000 ($15.85)General Local Government Support: $16,000 ($0.49)Tax - Other Selective Sales: $8,615,000 ($265.63)
General Sales and Gross Receipts: $7,897,000 ($243.49)Property: $6,109,000 ($188.36)Other License: $1,284,000 ($39.59)Public Utilities Sales: $1,202,000 ($37.06)Documentary and Stock Transfer: $160,000 ($4.93)
Goleta government finances - Debt in 2017 (per resident):
Long Term Debt - Beginning Outstanding - Unspecified Public Purpose: $15,075,000 ($464.82)
Outstanding Unspecified Public Purpose: $14,910,000 ($459.73)Retired Unspecified Public Purpose: $165,000 ($5.09)
Goleta government finances - Cash and Securities in 2017 (per resident):
Other Funds - Cash and Securities: $58,275,000 ($1796.84)
Sinking Funds - Cash and Securities: $14,910,000 ($459.73)
4.93% of this county's 2021 resident taxpayers lived in other counties in 2020 ($102,533 average adjusted gross income )
Here:
4.93%California average:
5.19%
0.04% of residents moved from foreign countries ($459 average AGI )Santa Barbara County:
0.04%California average:
0.03%
Top counties from which taxpayers relocated into this county between 2020 and 2021:
6.09% of this county's 2020 resident taxpayers moved to other counties in 2021 ($82,188 average adjusted gross income )
Here:
6.09%California average:
6.14%
0.03% of residents moved to foreign countries ($259 average AGI )Santa Barbara County:
0.03%California average:
0.02%
Top counties to which taxpayers relocated from this county between 2020 and 2021:
Businesses in Goleta, CA
Name Count Name Count
7-Eleven 3 Little Caesars Pizza 1 AT&T 1 MasterBrand Cabinets 7 Albertsons 2 McDonald's 1 Baja Fresh Mexican Grill 1 Motel 6 1 Bed Bath & Beyond 1 Nike 3 Best Western 1 Nissan 1 Blockbuster 1 Outback 1 Budget Car Rental 1 Outback Steakhouse 1 CVS 2 Panda Express 1 Carl\s Jr. 1 Penske 1 Chipotle 1 Quiznos 1 Cold Stone Creamery 1 RadioShack 1 Costco 1 Rite Aid 1 Dennys 1 Sears 2 Domino's Pizza 1 Staples 1 El Pollo Loco 1 Starbucks 3 FedEx 4 Super 8 1 GNC 2 T-Mobile 1 H&R Block 1 Taco Bell 2 Hilton 1 Toyota 1 Home Depot 1 Trader Joe's 1 Honda 1 True Value 1 Jack In The Box 1 UPS 8 Jones New York 1 Vans 3 KFC 1 Vons 2 Kmart 1 Walgreens 1 Kroger 1 Wendy's 1 La-Z-Boy 1
Strongest AM radio stations in Goleta:
KEYT (1250 AM; 2 kW; SANTA BARBARA, CA; Owner: SMITH BROADCASTING OF SANTA BARBARA LIMITED PARTNERSHIP)
KTMS (990 AM; 5 kW; SANTA BARBARA, CA; Owner: CITICASTERS LICENSES, L.P.)
KGDP (660 AM; 50 kW; ORCUTT, CA; Owner: RADIO REPRESENTATIVES, INC.)
KBKO (1490 AM; 1 kW; SANTA BARBARA, CA; Owner: CITICASTERS LICENSES, L.P.)
KSPN (710 AM; 50 kW; LOS ANGELES, CA; Owner: KABC-AM RADIO, INC.)
KTLK (1340 AM; 1 kW; SANTA BARBARA, CA; Owner: CITICASTERS LICENSES, L.P.)
KACD (850 AM; 25 kW; THOUSAND OAKS, CA; Owner: CITICASTERS LICENSES, L.P.)
KLAC (570 AM; 50 kW; LOS ANGELES, CA; Owner: AMFM RADIO LICENSES, L.L.C.)
KZBN (1290 AM; 0 kW; SANTA BARBARA, CA; Owner: ROTIJEFCO, INC.)
KIRN (670 AM; 35 kW; SIMI VALLEY, CA; Owner: LOTUS OXNARD CORP.)
KERI (1180 AM; 50 kW; WASCO-GREENACRES, CA; Owner: KWSO, INC.)
KFI (640 AM; 50 kW; LOS ANGELES, CA; Owner: CAPSTAR TX LIMITED PARTNERSHIP)
KFWB (980 AM; 50 kW; LOS ANGELES, CA; Owner: INFINITY BROADCASTING OPERATIONS, INC.)
Strongest FM radio stations in Goleta:
K295AH (106.9 FM; GOLETA, CA; Owner: THE ASSOC., FOR COMMUNITY EDUC., INC)
WICI-FM (94.7 FM; SUMTER, SC; Owner: MILLER COMMUNICATIONS, INC.)
KIST-FM (107.7 FM; SANTA BARBARA, CA; Owner: CITICASTERS LICENSES, L.P.)
K254AH (98.7 FM; ISLA VISTA, CA; Owner: PACIFICA FOUNDATION, INC.)
KRUZ (103.3 FM; SANTA BARBARA, CA; Owner: CUMULUS LICENSING CORP.)
KRAZ (105.9 FM; SANTA YNEZ, CA; Owner: KNIGHT BROADCASTING, INC.)
KSPE-FM (94.5 FM; ELLWOOD, CA; Owner: CITICASTERS LICENSES, L.P.)
KMGQ (97.5 FM; SANTA BARBARA, CA; Owner: CUMULUS LICENSING CORP.)
KCSB-FM (91.9 FM; SANTA BARBARA, CA; Owner: UNIVERSITY OF CALIFORNIA)
KTYD (99.9 FM; SANTA BARBARA, CA; Owner: CITICASTERS LICENSES, L.P.)
KSBX (89.5 FM; SANTA BARBARA, CA; Owner: KCBX, INC.)
KJEE (92.9 FM; MONTECITO, CA; Owner: MONTECITO, FM, INC)
K218CP (91.5 FM; SANTA BARBARA, CA; Owner: CALVARY CHAPEL OF TWIN FALLS, INC.)
KDB (93.7 FM; SANTA BARBARA, CA; Owner: PACIFIC BROADCASTING COMPANY)
KFAC (88.7 FM; SANTA BARBARA, CA; Owner: UNIVERSITY OF SOUTHERN CALIFORNIA)
KKSB (106.3 FM; GOLETA, CA; Owner: CUMULUS LICENSING CORP.)
KSBL (101.7 FM; CARPINTERIA, CA; Owner: CITICASTERS LICENSES, L.P.)
K293AG (106.5 FM; TAFT, CA; Owner: CENTRO CRISTIANO DE FE, INC.)
KCAQ (104.7 FM; OXNARD, CA; Owner: GOLD COAST BROADCASTING LLC)
KOCP (95.9 FM; CAMARILLO, CA; Owner: GOLD COAST BROADCASTING LLC)
TV broadcast stations around Goleta:
KVMM-CA (Channel 41; SANTA BARBARA, CA; Owner: CABALLERO TELEVISION TEXAS, L.L.C.)
KTRO-LP (Channel 50; LANCASTER, CA; Owner: ROBERT D. ADELMAN)
K23EQ (Channel 23; VENTURA, CA; Owner: EQUITY BROADCASTING CORPORATION)
KEYT-TV (Channel 3; SANTA BARBARA, CA; Owner: SMITH BROADCASTING OF SANTA BARBARA, LP)
KPMR (Channel 38; SANTA BARBARA, CA; Owner: ENTRAVISION HOLDINGS, LLC)
KSBT-LP (Channel 32; SANTA BARBARA, CA; Owner: ARNOLD N. APPLEBAUM)
K49EK (Channel 49; SANTA BARBARA, CA; Owner: COASTLINE COMMUNICATIONS, INC.)
K46GC (Channel 46; SANTA BARBARA, CA; Owner: PENNY DRUCKER)
K08MP (Channel 8; SANTA BARBARA, CA; Owner: MELISSA HARNETT)
KTSB-LP (Channel 43; SANTA BARBARA, CA; Owner: ENTRAVISION HOLDINGS, LLC)
K55AP (Channel 55; SANTA BARBARA, CA; Owner: COMMUNITY TV OF SOUTHERN CALIFORNIA)
KSBB-LP (Channel 17; SANTA BARBARA, CA; Owner: SMITH BROADCASTING OF SANTA BARBARA, LP)
KBAB-LP (Channel 51; SANTA BARBARA, CA; Owner: BILTMORE BROADCASTING CORPORATION)
K59CD (Channel 59; SANTA BARBARA, CA; Owner: NVG-SANTA BARBARA II, LLC)
National Bridge Inventory (NBI) Statistics 70 Number of bridges623ft / 190m Total length $2,960,000 Total costs1,710,568 Total average daily traffic98,318 Total average daily truck traffic
New bridges - historical statistics
1 1920-1929 1 1930-1939 3 1940-1949 2 1950-1959 23 1960-1969 11 1970-1979 2 1980-1989 15 1990-1999 4 2000-2009 8 2010-2019
See full National Bridge Inventory statistics for Goleta, CA
Home Mortgage Disclosure Act Aggregated Statistics For Year 2009(Based on 9 full and 5 partial tracts) A) FHA, FSA/RHS & VA B) Conventional C) Refinancings D) Home Improvement Loans F) Non-occupant Loans on G) Loans On Manufactured Number Average Value Number Average Value Number Average Value Number Average Value Number Average Value Number Average Value
LOANS ORIGINATED 50 $475,718 268 $449,624 1,247 $378,577 69 $366,055 125 $422,899 30 $138,670 APPLICATIONS APPROVED, NOT ACCEPTED 3 $315,737 29 $550,230 124 $425,263 5 $527,308 17 $437,674 2 $289,000 APPLICATIONS DENIED 8 $403,291 35 $472,345 296 $464,563 16 $198,052 35 $344,078 12 $176,024 APPLICATIONS WITHDRAWN 6 $426,847 47 $428,243 209 $407,111 12 $285,702 24 $378,405 6 $181,695 FILES CLOSED FOR INCOMPLETENESS 2 $93,100 8 $507,620 49 $432,868 6 $242,988 8 $314,754 0 $0
Aggregated Statistics For Year 2008(Based on 9 full and 5 partial tracts) A) FHA, FSA/RHS & VA B) Conventional C) Refinancings D) Home Improvement Loans E) Loans on Dwellings For 5+ Families F) Non-occupant Loans on G) Loans On Manufactured Number Average Value Number Average Value Number Average Value Number Average Value Number Average Value Number Average Value Number Average Value
LOANS ORIGINATED 14 $395,210 309 $515,991 436 $422,347 53 $334,431 3 $5,596,240 92 $525,539 78 $159,006 APPLICATIONS APPROVED, NOT ACCEPTED 3 $501,580 60 $569,240 103 $463,204 7 $152,201 0 $0 11 $379,722 7 $120,036 APPLICATIONS DENIED 10 $463,233 105 $570,035 297 $439,661 31 $368,918 0 $0 32 $506,469 34 $155,040 APPLICATIONS WITHDRAWN 4 $428,250 55 $522,991 104 $456,980 11 $354,793 0 $0 23 $658,737 9 $163,050 FILES CLOSED FOR INCOMPLETENESS 2 $284,375 10 $538,446 36 $762,610 4 $200,500 0 $0 5 $450,424 0 $0
Aggregated Statistics For Year 2007(Based on 9 full and 5 partial tracts) A) FHA, FSA/RHS & VA B) Conventional C) Refinancings D) Home Improvement Loans E) Loans on Dwellings For 5+ Families F) Non-occupant Loans on G) Loans On Manufactured Number Average Value Number Average Value Number Average Value Number Average Value Number Average Value Number Average Value Number Average Value
LOANS ORIGINATED 0 $0 396 $601,204 849 $509,554 95 $462,615 5 $4,249,722 166 $547,488 96 $149,526 APPLICATIONS APPROVED, NOT ACCEPTED 0 $0 77 $525,607 189 $521,718 15 $367,983 0 $0 30 $702,078 16 $137,945 APPLICATIONS DENIED 1 $188,510 107 $545,044 368 $592,137 41 $313,446 0 $0 57 $625,576 43 $158,855 APPLICATIONS WITHDRAWN 1 $188,510 53 $595,700 170 $563,487 20 $440,558 1 $580,880 35 $557,071 6 $153,530 FILES CLOSED FOR INCOMPLETENESS 0 $0 12 $527,098 53 $516,584 2 $200,000 0 $0 5 $333,716 4 $145,980
Aggregated Statistics For Year 2006(Based on 9 full and 5 partial tracts) B) Conventional C) Refinancings D) Home Improvement Loans E) Loans on Dwellings For 5+ Families F) Non-occupant Loans on G) Loans On Manufactured Number Average Value Number Average Value Number Average Value Number Average Value Number Average Value Number Average Value
LOANS ORIGINATED 481 $534,838 981 $510,127 160 $375,199 3 $801,880 176 $468,416 75 $161,008 APPLICATIONS APPROVED, NOT ACCEPTED 98 $557,949 195 $489,419 30 $348,719 0 $0 26 $435,047 12 $162,958 APPLICATIONS DENIED 153 $500,308 396 $522,466 56 $380,081 0 $0 40 $505,082 32 $157,706 APPLICATIONS WITHDRAWN 92 $537,734 275 $582,491 25 $518,898 0 $0 32 $476,839 2 $160,510 FILES CLOSED FOR INCOMPLETENESS 16 $377,594 66 $542,547 4 $299,828 0 $0 3 $733,523 5 $304,084
Aggregated Statistics For Year 2005(Based on 9 full and 5 partial tracts) B) Conventional C) Refinancings D) Home Improvement Loans E) Loans on Dwellings For 5+ Families F) Non-occupant Loans on G) Loans On Manufactured Number Average Value Number Average Value Number Average Value Number Average Value Number Average Value Number Average Value
LOANS ORIGINATED 549 $610,101 1,302 $503,911 181 $427,469 6 $778,240 222 $549,491 88 $140,917 APPLICATIONS APPROVED, NOT ACCEPTED 72 $564,853 168 $436,950 23 $360,097 0 $0 28 $373,401 11 $163,047 APPLICATIONS DENIED 161 $548,730 393 $464,160 58 $424,729 0 $0 59 $488,633 39 $151,117 APPLICATIONS WITHDRAWN 112 $530,174 314 $517,123 43 $360,103 1 $794,600 39 $460,495 20 $183,112 FILES CLOSED FOR INCOMPLETENESS 23 $663,644 140 $449,080 9 $877,968 0 $0 13 $777,759 4 $197,595
Aggregated Statistics For Year 2004(Based on 9 full and 5 partial tracts) B) Conventional C) Refinancings D) Home Improvement Loans E) Loans on Dwellings For 5+ Families F) Non-occupant Loans on G) Loans On Manufactured Number Average Value Number Average Value Number Average Value Number Average Value Number Average Value Number Average Value
LOANS ORIGINATED 679 $529,294 1,704 $416,593 134 $309,051 5 $1,193,200 245 $403,676 96 $137,304 APPLICATIONS APPROVED, NOT ACCEPTED 92 $555,900 261 $394,231 13 $200,932 0 $0 36 $483,147 9 $167,083 APPLICATIONS DENIED 135 $504,041 375 $422,310 43 $218,207 0 $0 46 $456,835 45 $127,380 APPLICATIONS WITHDRAWN 105 $465,164 375 $383,585 19 $309,370 0 $0 26 $368,629 24 $133,477 FILES CLOSED FOR INCOMPLETENESS 20 $404,768 73 $389,220 8 $257,419 0 $0 6 $408,263 3 $134,163
Aggregated Statistics For Year 2003(Based on 9 full and 5 partial tracts) A) FHA, FSA/RHS & VA B) Conventional C) Refinancings D) Home Improvement Loans E) Loans on Dwellings For 5+ Families F) Non-occupant Loans on Number Average Value Number Average Value Number Average Value Number Average Value Number Average Value Number Average Value
LOANS ORIGINATED 0 $0 641 $449,187 4,280 $316,537 38 $73,283 8 $1,781,616 441 $305,693 APPLICATIONS APPROVED, NOT ACCEPTED 0 $0 71 $482,783 474 $323,295 10 $69,209 0 $0 38 $333,554 APPLICATIONS DENIED 1 $120,000 101 $399,833 451 $355,890 17 $76,904 0 $0 42 $603,169 APPLICATIONS WITHDRAWN 0 $0 81 $377,799 525 $304,048 8 $139,318 1 $548,000 42 $311,176 FILES CLOSED FOR INCOMPLETENESS 0 $0 14 $454,697 92 $311,653 4 $203,780 0 $0 10 $325,112
Aggregated Statistics For Year 2002(Based on 9 full and 5 partial tracts) A) FHA, FSA/RHS & VA B) Conventional C) Refinancings D) Home Improvement Loans E) Loans on Dwellings For 5+ Families F) Non-occupant Loans on Number Average Value Number Average Value Number Average Value Number Average Value Number Average Value Number Average Value
LOANS ORIGINATED 6 $198,775 692 $362,250 2,897 $321,671 50 $70,875 6 $1,475,910 287 $297,016 APPLICATIONS APPROVED, NOT ACCEPTED 0 $0 93 $399,497 352 $322,335 13 $56,031 0 $0 30 $274,953 APPLICATIONS DENIED 2 $273,970 89 $368,167 352 $324,618 27 $103,672 0 $0 26 $343,148 APPLICATIONS WITHDRAWN 1 $243,420 84 $300,740 329 $309,492 14 $100,036 2 $3,868,285 23 $268,510 FILES CLOSED FOR INCOMPLETENESS 0 $0 23 $447,255 95 $448,804 1 $40,000 1 $1,877,000 4 $228,002
Aggregated Statistics For Year 2001(Based on 9 full and 5 partial tracts) A) FHA, FSA/RHS & VA B) Conventional C) Refinancings D) Home Improvement Loans E) Loans on Dwellings For 5+ Families F) Non-occupant Loans on Number Average Value Number Average Value Number Average Value Number Average Value Number Average Value Number Average Value
LOANS ORIGINATED 9 $150,872 694 $306,357 2,117 $297,807 75 $61,137 10 $1,538,398 217 $280,793 APPLICATIONS APPROVED, NOT ACCEPTED 0 $0 78 $369,541 262 $282,707 22 $146,000 0 $0 26 $206,315 APPLICATIONS DENIED 0 $0 82 $303,573 306 $314,160 38 $42,154 1 $329,000 26 $272,765 APPLICATIONS WITHDRAWN 1 $262,000 79 $304,141 304 $269,635 17 $23,598 2 $611,860 17 $242,370 FILES CLOSED FOR INCOMPLETENESS 1 $184,000 19 $303,584 91 $269,237 4 $73,312 1 $449,360 8 $199,754
Aggregated Statistics For Year 2000(Based on 9 full and 5 partial tracts) A) FHA, FSA/RHS & VA B) Conventional C) Refinancings D) Home Improvement Loans E) Loans on Dwellings For 5+ Families F) Non-occupant Loans on Number Average Value Number Average Value Number Average Value Number Average Value Number Average Value Number Average Value
LOANS ORIGINATED 8 $125,728 728 $279,078 552 $295,999 71 $41,082 3 $2,372,880 108 $250,595 APPLICATIONS APPROVED, NOT ACCEPTED 1 $16,440 95 $287,661 108 $223,594 18 $48,492 1 $1,096,000 12 $202,511 APPLICATIONS DENIED 1 $141,000 128 $324,928 203 $251,462 27 $36,881 0 $0 14 $292,314 APPLICATIONS WITHDRAWN 2 $132,965 81 $322,136 131 $182,620 13 $70,315 0 $0 15 $202,571 FILES CLOSED FOR INCOMPLETENESS 0 $0 28 $225,105 40 $424,435 2 $78,765 0 $0 4 $224,690
Aggregated Statistics For Year 1999(Based on 7 full and 7 partial tracts) A) FHA, FSA/RHS & VA B) Conventional C) Refinancings D) Home Improvement Loans E) Loans on Dwellings For 5+ Families F) Non-occupant Loans on Number Average Value Number Average Value Number Average Value Number Average Value Number Average Value Number Average Value
LOANS ORIGINATED 33 $151,327 831 $247,487 1,269 $240,099 64 $44,054 6 $1,758,782 186 $206,410 APPLICATIONS APPROVED, NOT ACCEPTED 1 $95,770 114 $219,117 206 $227,821 11 $83,242 0 $0 22 $176,822 APPLICATIONS DENIED 5 $131,142 135 $214,075 300 $219,405 31 $38,362 0 $0 27 $222,562 APPLICATIONS WITHDRAWN 9 $154,008 137 $264,451 271 $265,381 9 $72,680 1 $544,120 17 $216,958 FILES CLOSED FOR INCOMPLETENESS 0 $0 25 $229,050 58 $239,652 2 $49,700 2 $348,595 5 $243,318
Detailed mortgage data for all 14 tracts in Goleta, CA
Private Mortgage Insurance Companies Aggregated Statistics For Year 2009(Based on 7 full and 2 partial tracts) A) Conventional B) Refinancings Number Average Value Number Average Value
LOANS ORIGINATED 10 $416,956 1 $490,360 APPLICATIONS APPROVED, NOT ACCEPTED 1 $729,000 2 $495,570 APPLICATIONS DENIED 3 $437,827 0 $0 APPLICATIONS WITHDRAWN 0 $0 0 $0 FILES CLOSED FOR INCOMPLETENESS 1 $168,750 0 $0
Aggregated Statistics For Year 2008(Based on 5 full and 4 partial tracts) A) Conventional B) Refinancings C) Non-occupant Loans on Number Average Value Number Average Value Number Average Value
LOANS ORIGINATED 12 $442,705 2 $262,660 1 $339,000 APPLICATIONS APPROVED, NOT ACCEPTED 4 $373,070 1 $211,420 0 $0 APPLICATIONS DENIED 2 $497,370 1 $211,420 0 $0 APPLICATIONS WITHDRAWN 2 $417,000 0 $0 0 $0 FILES CLOSED FOR INCOMPLETENESS 1 $700,000 0 $0 0 $0
Aggregated Statistics For Year 2007(Based on 4 full and 2 partial tracts) A) Conventional B) Refinancings C) Non-occupant Loans on Number Average Value Number Average Value Number Average Value
LOANS ORIGINATED 9 $378,001 3 $226,213 0 $0 APPLICATIONS APPROVED, NOT ACCEPTED 2 $167,960 0 $0 0 $0 APPLICATIONS DENIED 0 $0 3 $836,910 1 $743,000 APPLICATIONS WITHDRAWN 0 $0 1 $743,000 0 $0 FILES CLOSED FOR INCOMPLETENESS 0 $0 0 $0 0 $0
Aggregated Statistics For Year 2006(Based on 3 full and 1 partial tracts) A) Conventional B) Refinancings Number Average Value Number Average Value
LOANS ORIGINATED 2 $621,580 0 $0 APPLICATIONS APPROVED, NOT ACCEPTED 0 $0 1 $359,000 APPLICATIONS DENIED 0 $0 0 $0 APPLICATIONS WITHDRAWN 0 $0 0 $0 FILES CLOSED FOR INCOMPLETENESS 0 $0 0 $0
Aggregated Statistics For Year 2005(Based on 2 full and 1 partial tracts) A) Conventional B) Refinancings Number Average Value Number Average Value
LOANS ORIGINATED 3 $372,183 1 $359,000 APPLICATIONS APPROVED, NOT ACCEPTED 1 $650,000 0 $0 APPLICATIONS DENIED 0 $0 0 $0 APPLICATIONS WITHDRAWN 0 $0 0 $0 FILES CLOSED FOR INCOMPLETENESS 0 $0 0 $0
Aggregated Statistics For Year 2004(Based on 3 full and 2 partial tracts) A) Conventional B) Refinancings C) Non-occupant Loans on Number Average Value Number Average Value Number Average Value
LOANS ORIGINATED 3 $342,353 1 $163,000 1 $231,800 APPLICATIONS APPROVED, NOT ACCEPTED 3 $489,933 2 $266,015 1 $231,800 APPLICATIONS DENIED 0 $0 0 $0 0 $0 APPLICATIONS WITHDRAWN 0 $0 0 $0 0 $0 FILES CLOSED FOR INCOMPLETENESS 0 $0 0 $0 0 $0
Aggregated Statistics For Year 2003(Based on 6 full and 2 partial tracts) A) Conventional B) Refinancings C) Non-occupant Loans on Number Average Value Number Average Value Number Average Value
LOANS ORIGINATED 9 $359,536 10 $218,320 2 $229,500 APPLICATIONS APPROVED, NOT ACCEPTED 2 $300,525 1 $392,000 0 $0 APPLICATIONS DENIED 0 $0 0 $0 0 $0 APPLICATIONS WITHDRAWN 1 $231,800 0 $0 1 $231,800 FILES CLOSED FOR INCOMPLETENESS 0 $0 0 $0 0 $0
Aggregated Statistics For Year 2002(Based on 8 full and 3 partial tracts) A) Conventional B) Refinancings C) Non-occupant Loans on Number Average Value Number Average Value Number Average Value
LOANS ORIGINATED 28 $297,739 9 $245,898 0 $0 APPLICATIONS APPROVED, NOT ACCEPTED 15 $334,864 6 $166,882 1 $206,000 APPLICATIONS DENIED 2 $191,050 2 $359,795 0 $0 APPLICATIONS WITHDRAWN 0 $0 2 $151,990 0 $0 FILES CLOSED FOR INCOMPLETENESS 0 $0 0 $0 0 $0
Aggregated Statistics For Year 2001(Based on 9 full and 4 partial tracts) A) Conventional B) Refinancings C) Non-occupant Loans on Number Average Value Number Average Value Number Average Value
LOANS ORIGINATED 23 $297,278 12 $261,322 2 $156,275 APPLICATIONS APPROVED, NOT ACCEPTED 9 $302,604 2 $289,830 1 $313,990 APPLICATIONS DENIED 3 $383,000 0 $0 0 $0 APPLICATIONS WITHDRAWN 4 $303,650 1 $350,000 0 $0 FILES CLOSED FOR INCOMPLETENESS 0 $0 0 $0 0 $0
Aggregated Statistics For Year 2000(Based on 9 full and 5 partial tracts) A) Conventional B) Refinancings C) Non-occupant Loans on Number Average Value Number Average Value Number Average Value
LOANS ORIGINATED 48 $238,747 12 $290,455 3 $136,433 APPLICATIONS APPROVED, NOT ACCEPTED 11 $227,768 2 $405,265 1 $93,000 APPLICATIONS DENIED 4 $217,735 0 $0 1 $232,100 APPLICATIONS WITHDRAWN 1 $351,540 0 $0 0 $0 FILES CLOSED FOR INCOMPLETENESS 1 $115,000 0 $0 0 $0
Aggregated Statistics For Year 1999(Based on 7 full and 7 partial tracts) A) Conventional B) Refinancings C) Non-occupant Loans on Number Average Value Number Average Value Number Average Value
LOANS ORIGINATED 81 $236,960 10 $206,928 6 $160,028 APPLICATIONS APPROVED, NOT ACCEPTED 15 $247,315 5 $226,804 2 $266,605 APPLICATIONS DENIED 6 $213,728 1 $168,000 0 $0 APPLICATIONS WITHDRAWN 4 $373,488 0 $0 0 $0 FILES CLOSED FOR INCOMPLETENESS 2 $250,970 0 $0 0 $0
Fire-safe hotels and motels in Goleta, California:
Holiday Inn Santa Barbara Goleta, 5650 Calle Real, Goleta, California 93117 Phone: (805) 964-6241, Fax: (805) 964-8467
Hampton Inn- Goleta, 5665 Hollister Ave, Goleta, California 93117 Phone: (805) 681-9800, Fax: (805) 681-9844
Hilton Garden Inn - Santa Barbara/Goleta, 6878 Hollister Ave, Goleta, California 93117 Phone: (805) 562-5996, Fax: (805) 562-5998
All 3 fire-safe hotels and motels in Goleta, California
Most common first names in Goleta, CA among deceased individuals Name Count Lived (average)
Mary 83 79.6 years Robert 81 72.1 years John 79 78.8 years William 59 76.5 years Dorothy 55 82.3 years Charles 43 76.6 years Ruth 41 86.2 years Margaret 41 78.2 years James 40 74.7 years George 37 80.0 years
Most common last names in Goleta, CA among deceased individuals Last name Count Lived (average)
Smith 32 78.3 years Johnson 30 71.1 years Williams 17 76.4 years Jones 16 80.3 years Brown 16 83.1 years Davis 16 77.7 years Wilson 12 74.8 years Miller 11 73.5 years Wood 11 81.7 years Hall 11 80.5 years
Goleta compared to California state average:
Unemployed percentage significantly below state average. Black race population percentage significantly below state average. Hispanic race population percentage below state average. Median age above state average. Foreign-born population percentage below state average. Length of stay since moving in above state average. Percentage of population with a bachelor's degree or higher above state average.
#9 on the list of "Top 100 cities with declining populations from 2000 to 2014 (pop. 5,000+)"
#28 on the list of "Top 101 cities with the most people taking a bicycle to work (population 5,000+)"
#88 on the list of "Top 101 cities with the most residents born in Other Central America (population 500+)"
#17 on the list of "Top 101 counties with the lowest Sulfur Oxides Annual air pollution readings in 2012 (µg/m3 )"
#32 on the list of "Top 101 counties with the highest Nitrogen Dioxide air pollution readings in 2012 (ppm)"
#38 on the list of "Top 101 counties with the lowest number of infant deaths per 1000 residents 2007-2013 (pop. 50,000+)"
#78 on the list of "Top 101 counties with the highest carbon monoxide air pollution readings in 2012 (ppm)"
#81 on the list of "Top 101 counties with the largest decrease in the number of infant deaths per 1000 residents 2000-2006 to 2007-2013 (pop. 50,000+)"
Top Patent Applicants
Steven P. Denbaars (164)
James S. Speck (108)
Yifeng Wu (81)
Yulun Wang (72)
Theodore R. Hoelter (50)
Primit Parikh (44)
Arpan Chakraborty (38)
Pierre Boulanger (35)
Dennis E. Van Epps (32)
Eric Tarsa (32)
Total of 2070 patent applications in 2008-2024.
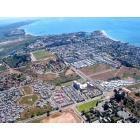
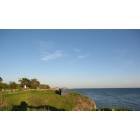
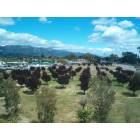
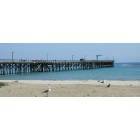
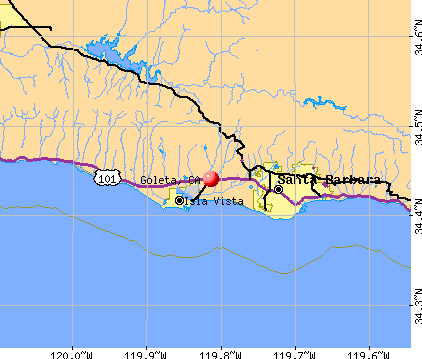


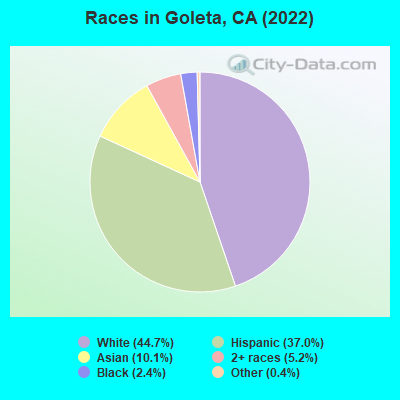
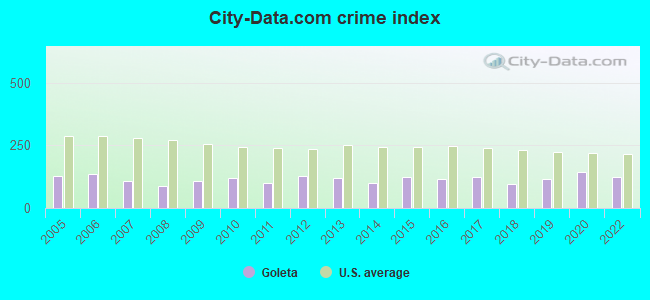
 Recent articles from our blog. Our writers, many of them Ph.D. graduates or candidates, create easy-to-read articles on a wide variety of topics.

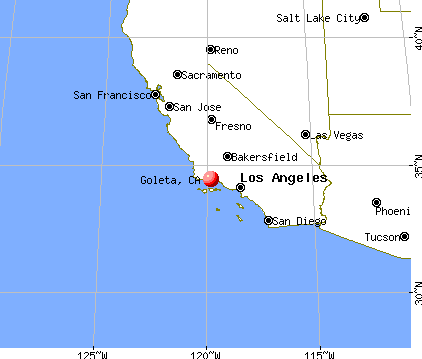
 (77.4 miles
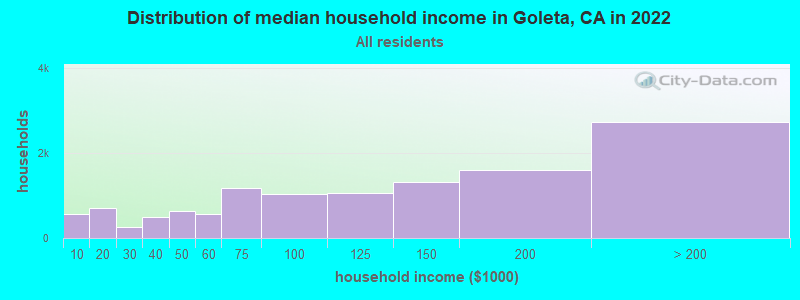
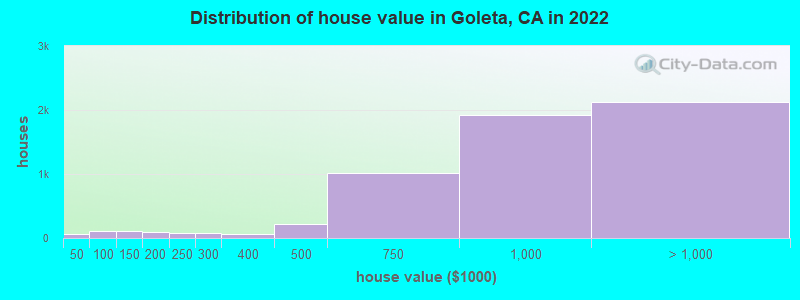
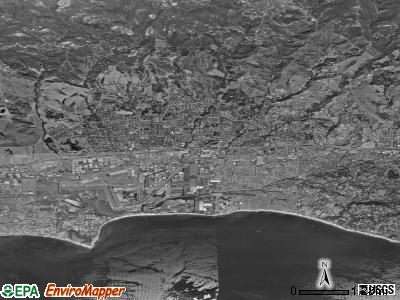
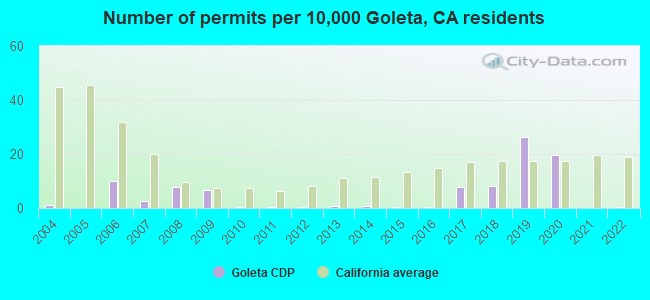
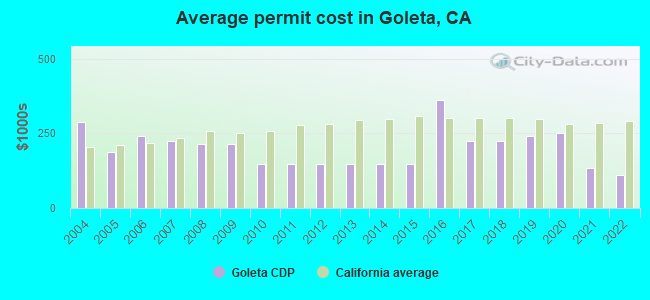
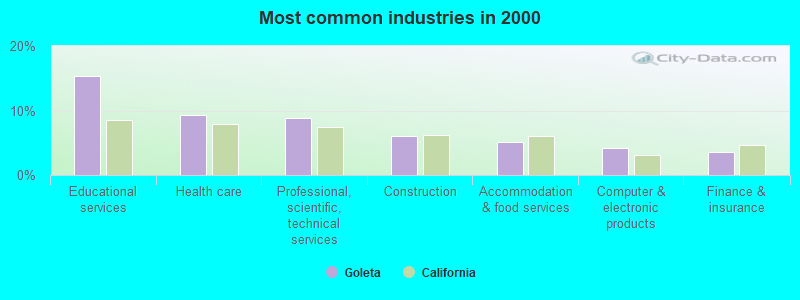
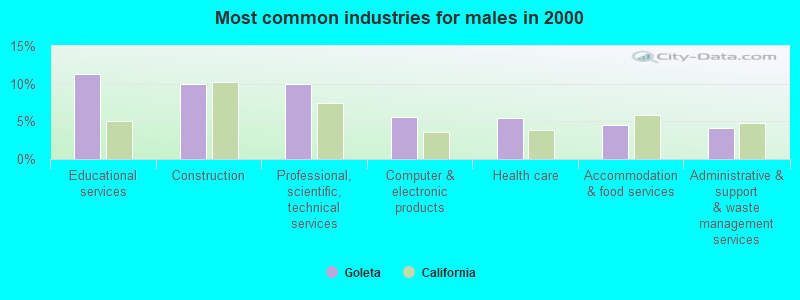
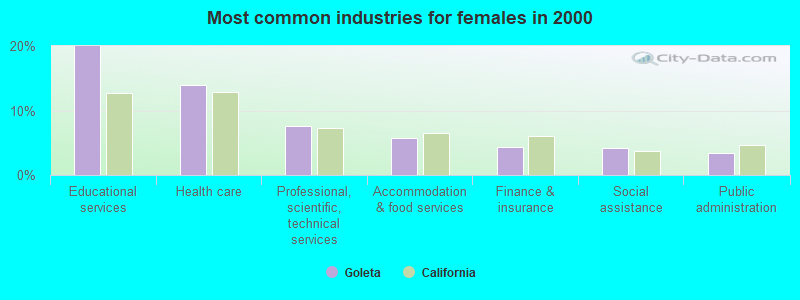
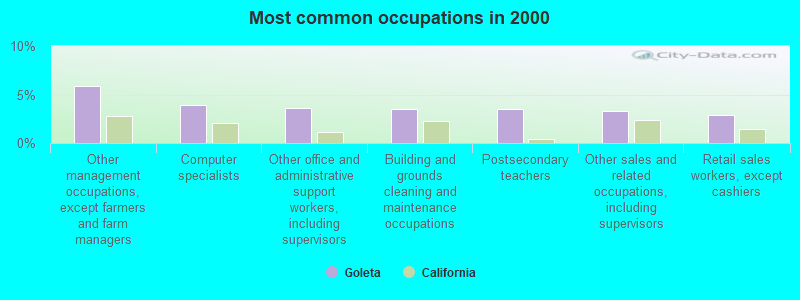
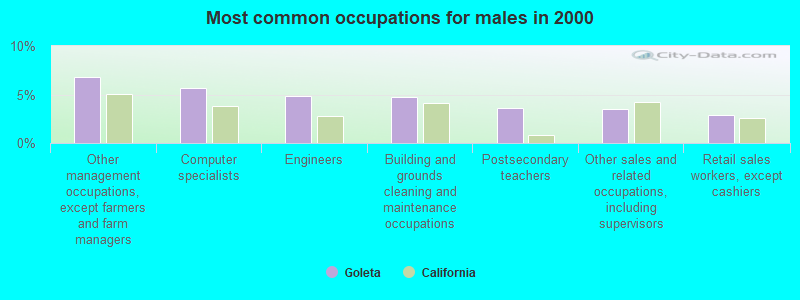
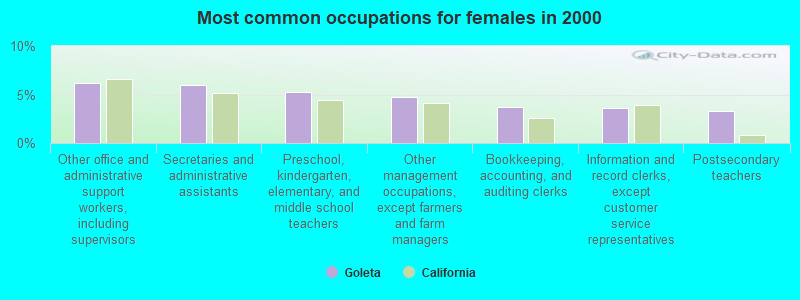
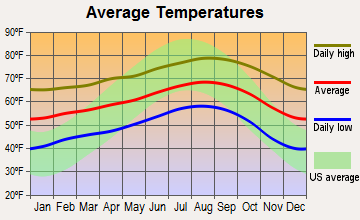
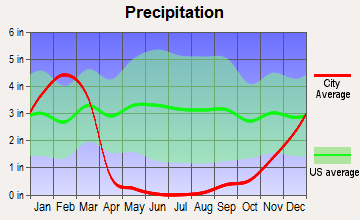
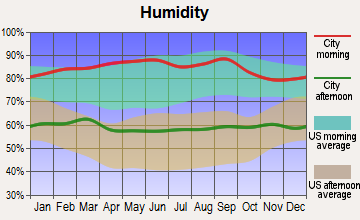
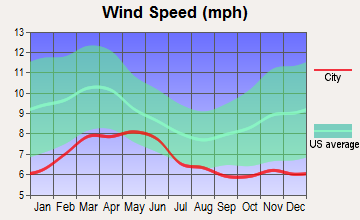
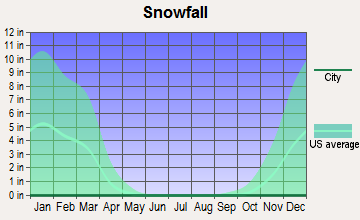
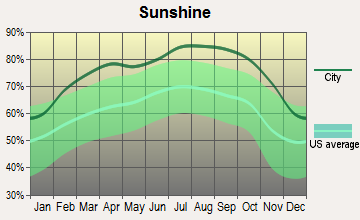
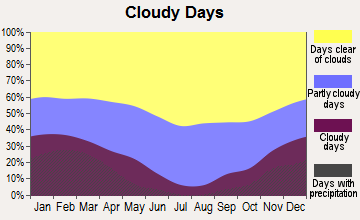
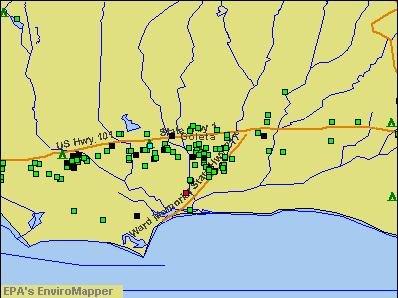

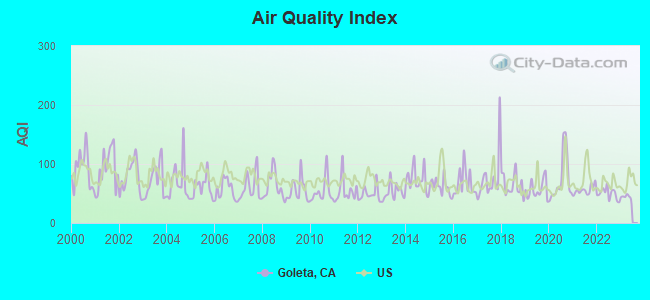
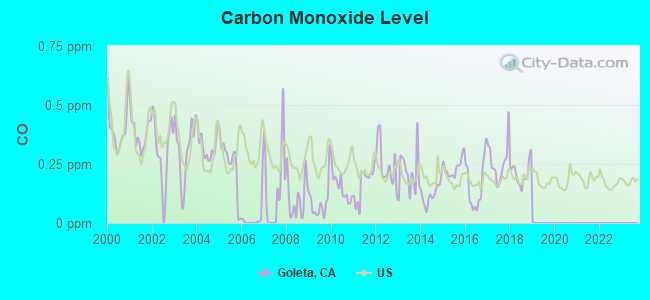
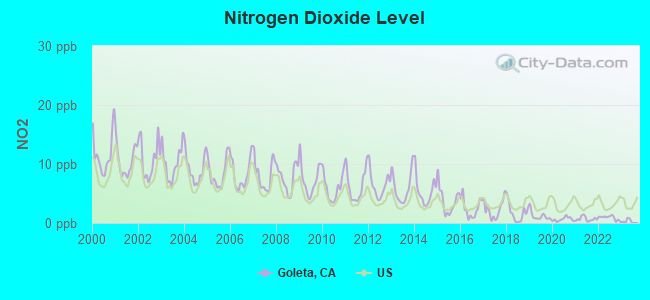
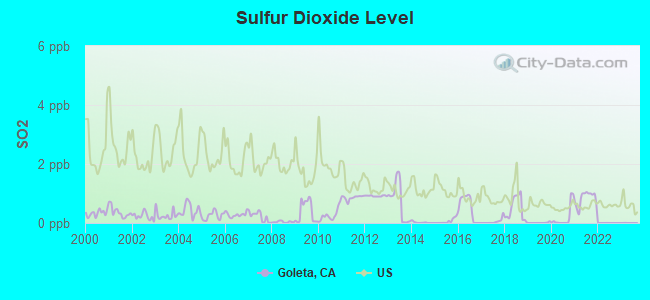
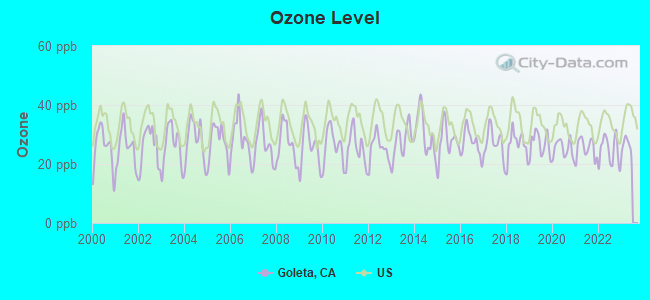
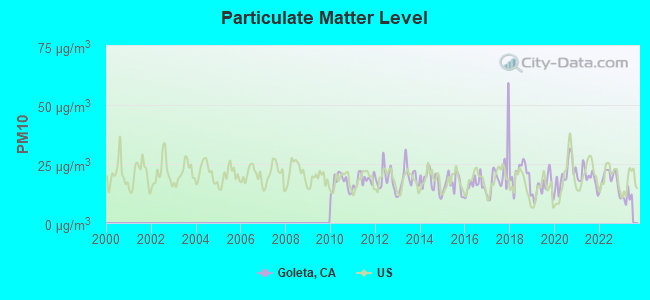
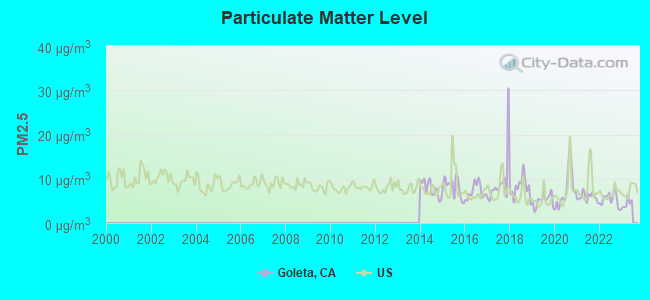
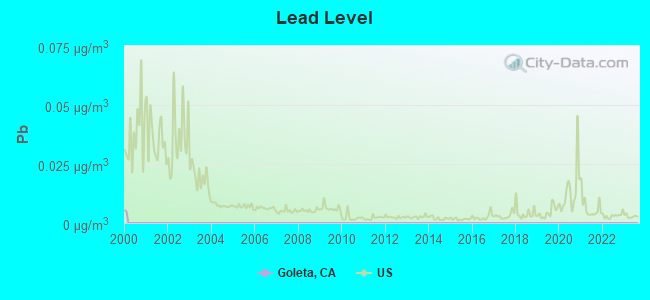
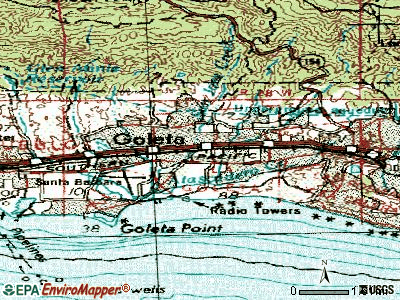
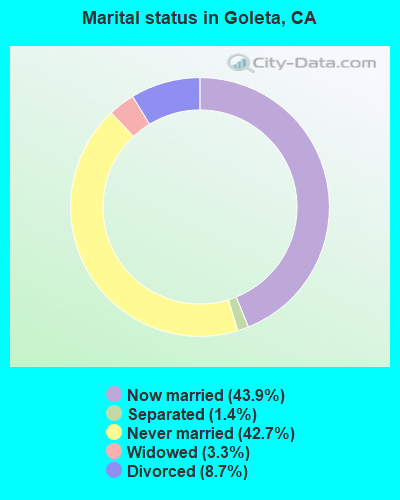
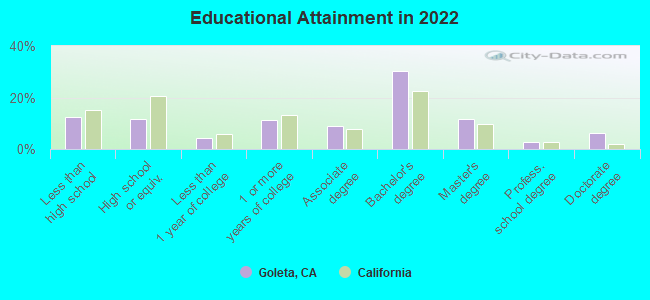
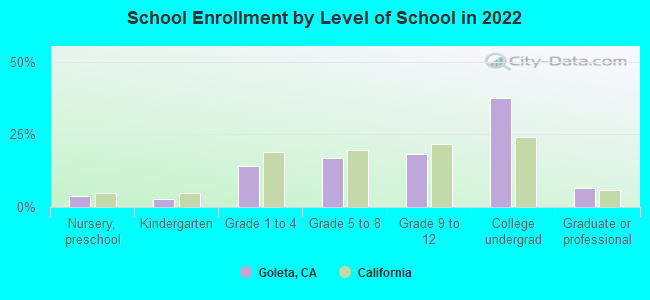
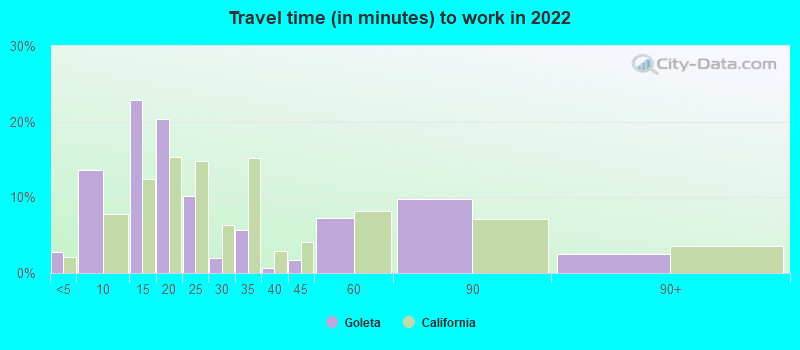
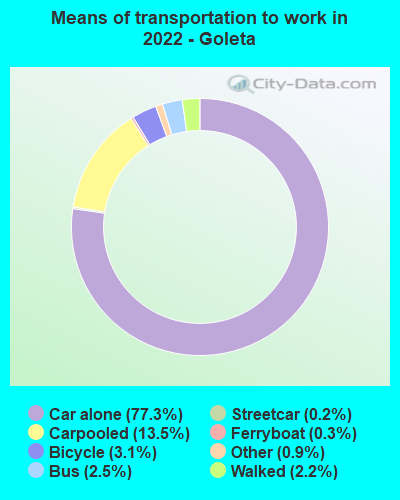
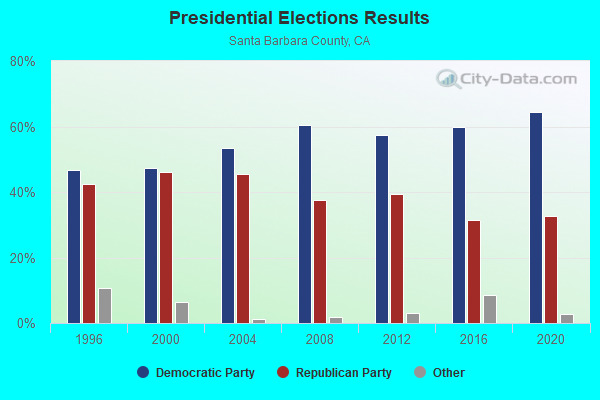
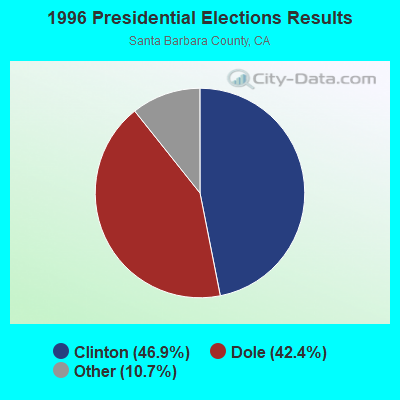
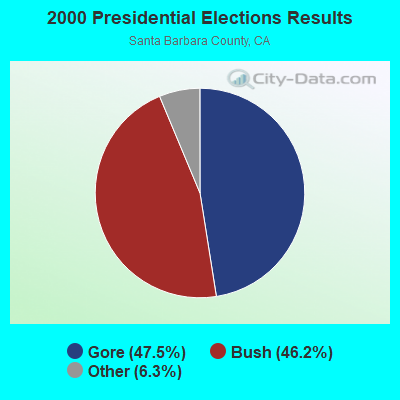
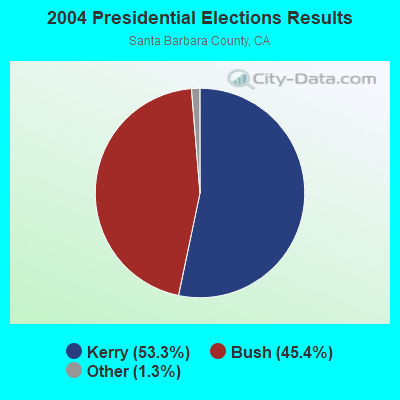
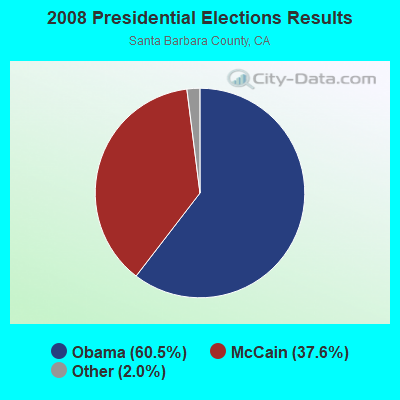
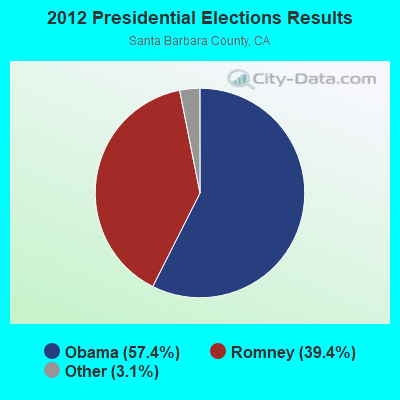
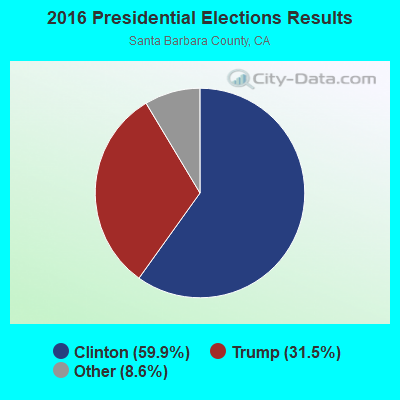
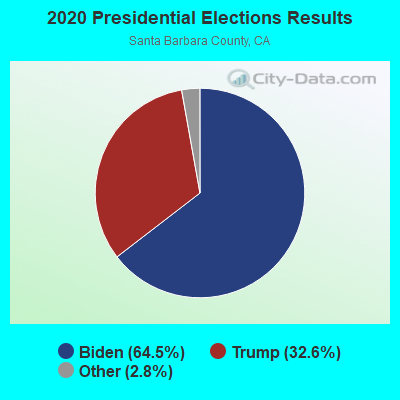
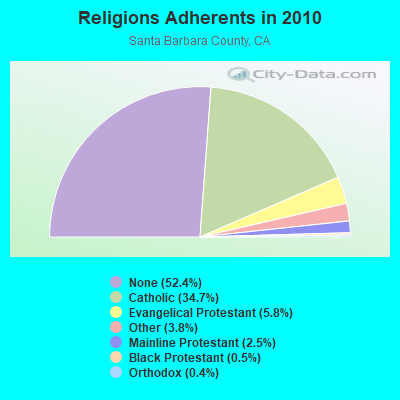
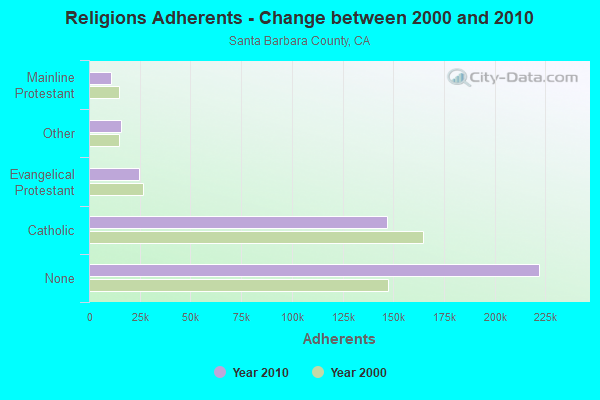
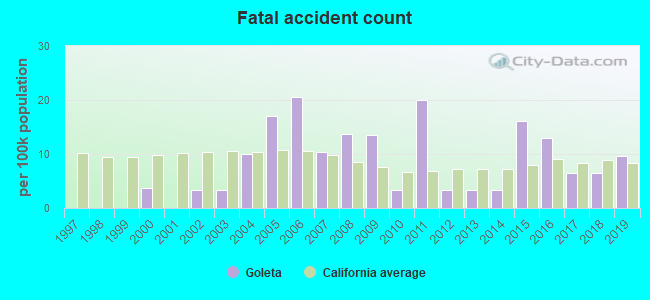
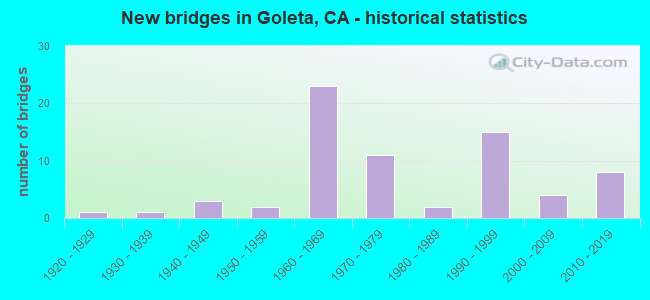
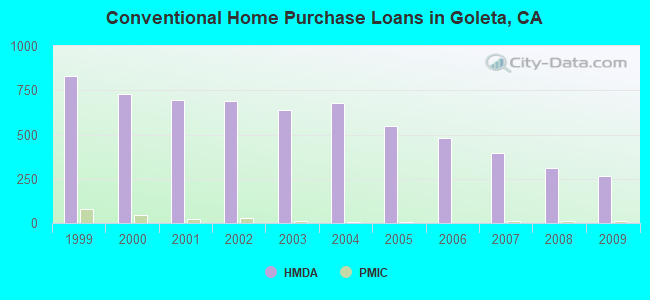
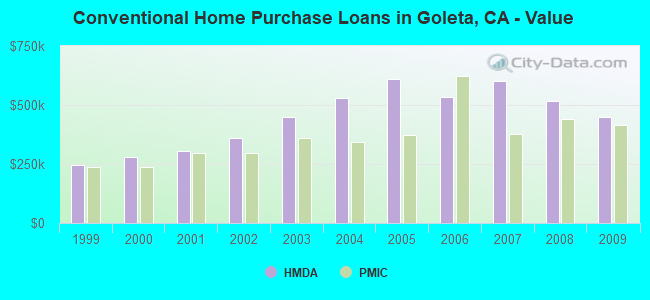
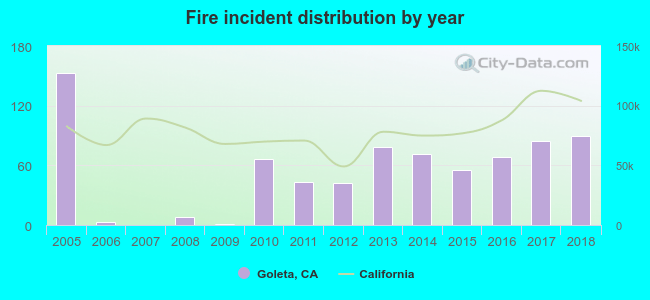 Based on the data from the years 2005 - 2018 the average number of fire incidents per year is 54. The highest number of fire incidents - 153 took place in 2005, and the least - 0 in 2007. The data has a decreasing trend.
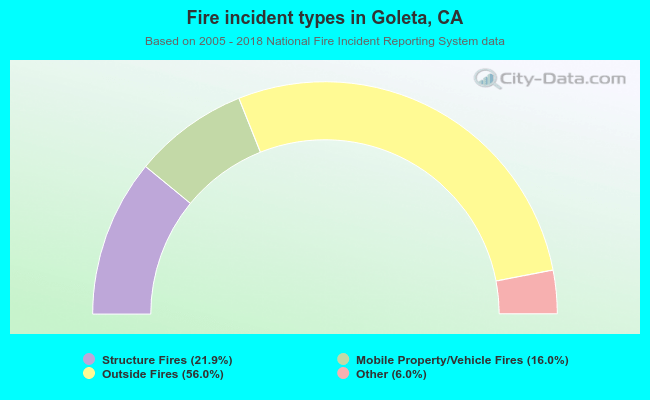 When looking into fire subcategories, the most incidents belonged to: Outside Fires (56.0%), and Structure Fires (21.9%).