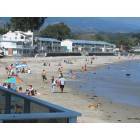
Montecito, California Submit your own pictures of this place and show them to the world
OSM Map
General Map
Google Map
MSN Map
OSM Map
General Map
Google Map
MSN Map
OSM Map
General Map
Google Map
MSN Map
OSM Map
General Map
Google Map
MSN Map
Please wait while loading the map...
Population in 2010: 8,965. Population change since 2000: -10.4%Males: 4,011 Females: 4,954
March 2022 cost of living index in Montecito: 120.7 (high, U.S. average is 100) Percentage of residents living in poverty in 2022: 7.8%for White Non-Hispanic residents , 17.9% for Hispanic or Latino residents , 10.6% for two or more races residents )
Profiles of local businesses
Business Search - 14 Million verified businesses
Data:
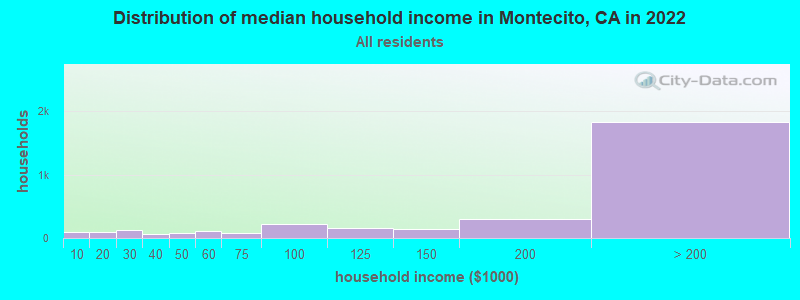
Median household income ($)
Median household income (% change since 2000)
Household income diversity
Ratio of average income to average house value (%)
Ratio of average income to average rent
Median household income ($) - White
Median household income ($) - Black or African American
Median household income ($) - Asian
Median household income ($) - Hispanic or Latino
Median household income ($) - American Indian and Alaska Native
Median household income ($) - Multirace
Median household income ($) - Other Race
Median household income for houses/condos with a mortgage ($)
Median household income for apartments without a mortgage ($)
Races - White alone (%)
Races - White alone (% change since 2000)
Races - Black alone (%)
Races - Black alone (% change since 2000)
Races - American Indian alone (%)
Races - American Indian alone (% change since 2000)
Races - Asian alone (%)
Races - Asian alone (% change since 2000)
Races - Hispanic (%)
Races - Hispanic (% change since 2000)
Races - Native Hawaiian and Other Pacific Islander alone (%)
Races - Native Hawaiian and Other Pacific Islander alone (% change since 2000)
Races - Two or more races (%)
Races - Two or more races (% change since 2000)
Races - Other race alone (%)
Races - Other race alone (% change since 2000)
Racial diversity
Unemployment (%)
Unemployment (% change since 2000)
Unemployment (%) - White
Unemployment (%) - Black or African American
Unemployment (%) - Asian
Unemployment (%) - Hispanic or Latino
Unemployment (%) - American Indian and Alaska Native
Unemployment (%) - Multirace
Unemployment (%) - Other Race
Population density (people per square mile)
Population - Males (%)
Population - Females (%)
Population - Males (%) - White
Population - Males (%) - Black or African American
Population - Males (%) - Asian
Population - Males (%) - Hispanic or Latino
Population - Males (%) - American Indian and Alaska Native
Population - Males (%) - Multirace
Population - Males (%) - Other Race
Population - Females (%) - White
Population - Females (%) - Black or African American
Population - Females (%) - Asian
Population - Females (%) - Hispanic or Latino
Population - Females (%) - American Indian and Alaska Native
Population - Females (%) - Multirace
Population - Females (%) - Other Race
Coronavirus confirmed cases (Apr 27, 2024)
Deaths caused by coronavirus (Apr 27, 2024)
Coronavirus confirmed cases (per 100k population) (Apr 27, 2024)
Deaths caused by coronavirus (per 100k population) (Apr 27, 2024)
Daily increase in number of cases (Apr 27, 2024)
Weekly increase in number of cases (Apr 27, 2024)
Cases doubled (in days) (Apr 27, 2024)
Hospitalized patients (Apr 18, 2022)
Negative test results (Apr 18, 2022)
Total test results (Apr 18, 2022)
COVID Vaccine doses distributed (per 100k population) (Sep 19, 2023)
COVID Vaccine doses administered (per 100k population) (Sep 19, 2023)
COVID Vaccine doses distributed (Sep 19, 2023)
COVID Vaccine doses administered (Sep 19, 2023)
Likely homosexual households (%)
Likely homosexual households (% change since 2000)
Likely homosexual households - Lesbian couples (%)
Likely homosexual households - Lesbian couples (% change since 2000)
Likely homosexual households - Gay men (%)
Likely homosexual households - Gay men (% change since 2000)
Cost of living index
Median gross rent ($)
Median contract rent ($)
Median monthly housing costs ($)
Median house or condo value ($)
Median house or condo value ($ change since 2000)
Mean house or condo value by units in structure - 1, detached ($)
Mean house or condo value by units in structure - 1, attached ($)
Mean house or condo value by units in structure - 2 ($)
Mean house or condo value by units in structure by units in structure - 3 or 4 ($)
Mean house or condo value by units in structure - 5 or more ($)
Mean house or condo value by units in structure - Boat, RV, van, etc. ($)
Mean house or condo value by units in structure - Mobile home ($)
Median house or condo value ($) - White
Median house or condo value ($) - Black or African American
Median house or condo value ($) - Asian
Median house or condo value ($) - Hispanic or Latino
Median house or condo value ($) - American Indian and Alaska Native
Median house or condo value ($) - Multirace
Median house or condo value ($) - Other Race
Median resident age
Resident age diversity
Median resident age - Males
Median resident age - Females
Median resident age - White
Median resident age - Black or African American
Median resident age - Asian
Median resident age - Hispanic or Latino
Median resident age - American Indian and Alaska Native
Median resident age - Multirace
Median resident age - Other Race
Median resident age - Males - White
Median resident age - Males - Black or African American
Median resident age - Males - Asian
Median resident age - Males - Hispanic or Latino
Median resident age - Males - American Indian and Alaska Native
Median resident age - Males - Multirace
Median resident age - Males - Other Race
Median resident age - Females - White
Median resident age - Females - Black or African American
Median resident age - Females - Asian
Median resident age - Females - Hispanic or Latino
Median resident age - Females - American Indian and Alaska Native
Median resident age - Females - Multirace
Median resident age - Females - Other Race
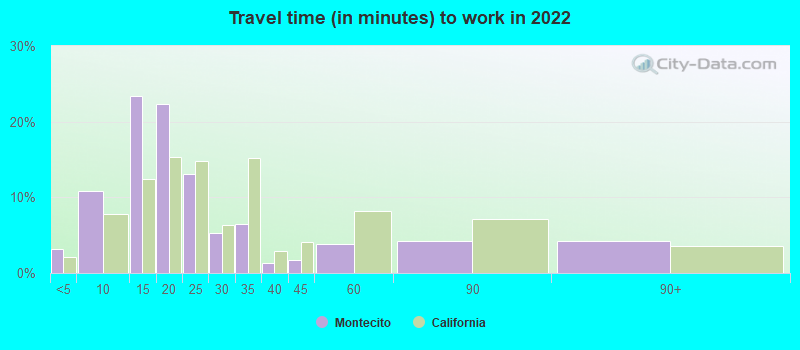
Commute - mean travel time to work (minutes)
Travel time to work - Less than 5 minutes (%)
Travel time to work - Less than 5 minutes (% change since 2000)
Travel time to work - 5 to 9 minutes (%)
Travel time to work - 5 to 9 minutes (% change since 2000)
Travel time to work - 10 to 19 minutes (%)
Travel time to work - 10 to 19 minutes (% change since 2000)
Travel time to work - 20 to 29 minutes (%)
Travel time to work - 20 to 29 minutes (% change since 2000)
Travel time to work - 30 to 39 minutes (%)
Travel time to work - 30 to 39 minutes (% change since 2000)
Travel time to work - 40 to 59 minutes (%)
Travel time to work - 40 to 59 minutes (% change since 2000)
Travel time to work - 60 to 89 minutes (%)
Travel time to work - 60 to 89 minutes (% change since 2000)
Travel time to work - 90 or more minutes (%)
Travel time to work - 90 or more minutes (% change since 2000)
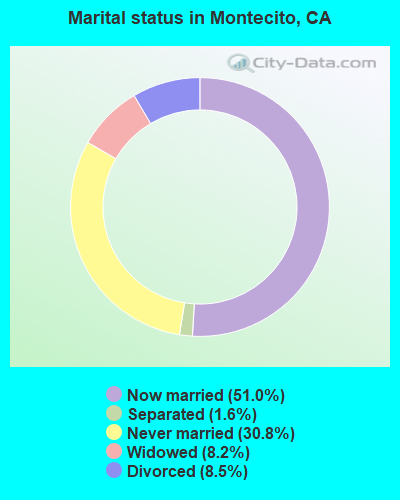
Marital status - Never married (%)
Marital status - Now married (%)
Marital status - Separated (%)
Marital status - Widowed (%)
Marital status - Divorced (%)
Median family income ($)
Median family income (% change since 2000)
Median non-family income ($)
Median non-family income (% change since 2000)
Median per capita income ($)
Median per capita income (% change since 2000)
Median family income ($) - White
Median family income ($) - Black or African American
Median family income ($) - Asian
Median family income ($) - Hispanic or Latino
Median family income ($) - American Indian and Alaska Native
Median family income ($) - Multirace
Median family income ($) - Other Race
Median year house/condo built
Median year apartment built
Year house built - Built 2005 or later (%)
Year house built - Built 2000 to 2004 (%)
Year house built - Built 1990 to 1999 (%)
Year house built - Built 1980 to 1989 (%)
Year house built - Built 1970 to 1979 (%)
Year house built - Built 1960 to 1969 (%)
Year house built - Built 1950 to 1959 (%)
Year house built - Built 1940 to 1949 (%)
Year house built - Built 1939 or earlier (%)
Average household size
Household density (households per square mile)
Average household size - White
Average household size - Black or African American
Average household size - Asian
Average household size - Hispanic or Latino
Average household size - American Indian and Alaska Native
Average household size - Multirace
Average household size - Other Race
Occupied housing units (%)
Vacant housing units (%)
Owner occupied housing units (%)
Renter occupied housing units (%)
Vacancy status - For rent (%)
Vacancy status - For sale only (%)
Vacancy status - Rented or sold, not occupied (%)
Vacancy status - For seasonal, recreational, or occasional use (%)
Vacancy status - For migrant workers (%)
Vacancy status - Other vacant (%)
Residents with income below the poverty level (%)
Residents with income below 50% of the poverty level (%)
Children below poverty level (%)
Poor families by family type - Married-couple family (%)
Poor families by family type - Male, no wife present (%)
Poor families by family type - Female, no husband present (%)
Poverty status for native-born residents (%)
Poverty status for foreign-born residents (%)
Poverty among high school graduates not in families (%)
Poverty among people who did not graduate high school not in families (%)
Residents with income below the poverty level (%) - White
Residents with income below the poverty level (%) - Black or African American
Residents with income below the poverty level (%) - Asian
Residents with income below the poverty level (%) - Hispanic or Latino
Residents with income below the poverty level (%) - American Indian and Alaska Native
Residents with income below the poverty level (%) - Multirace
Residents with income below the poverty level (%) - Other Race
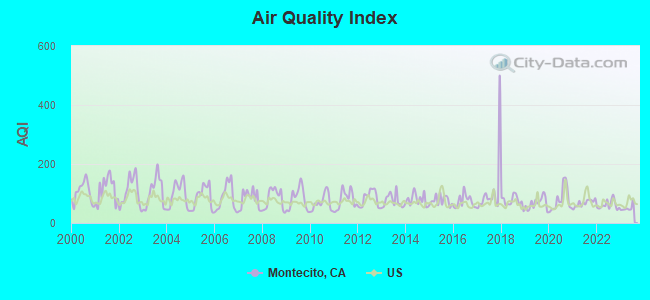
Air pollution - Air Quality Index (AQI)
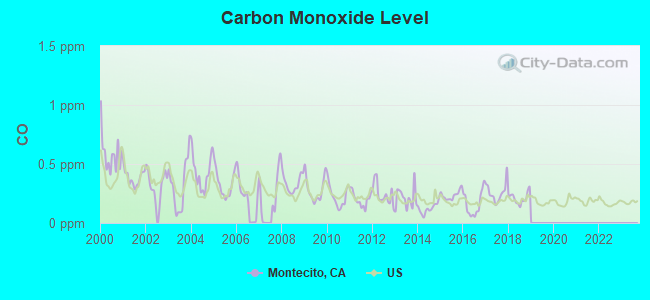
Air pollution - CO
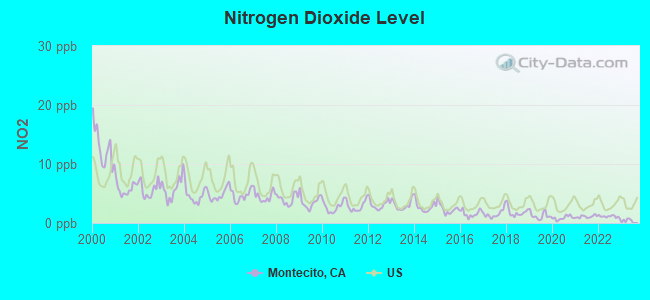
Air pollution - NO2
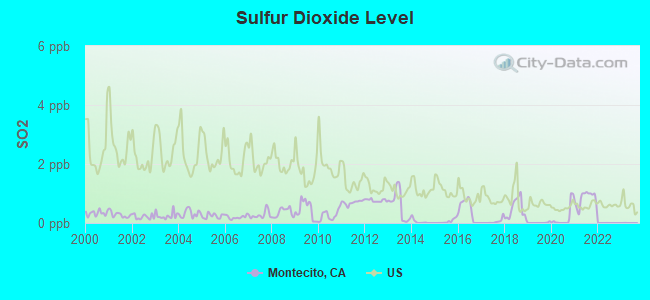
Air pollution - SO2
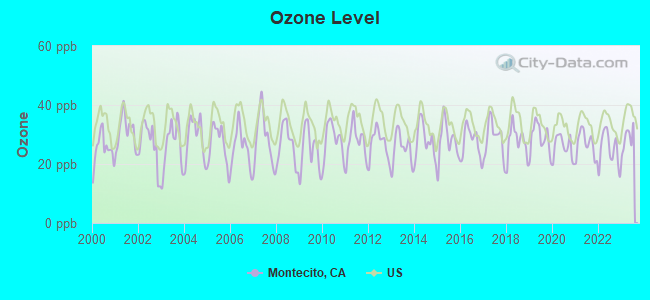
Air pollution - Ozone
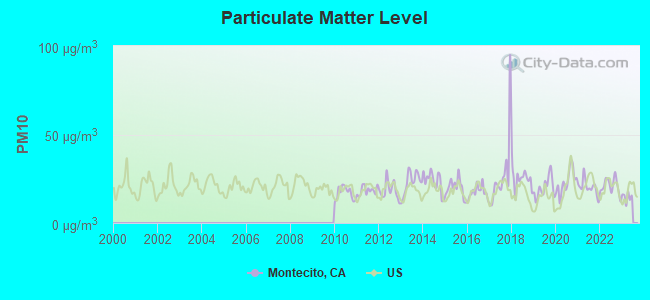
Air pollution - PM10
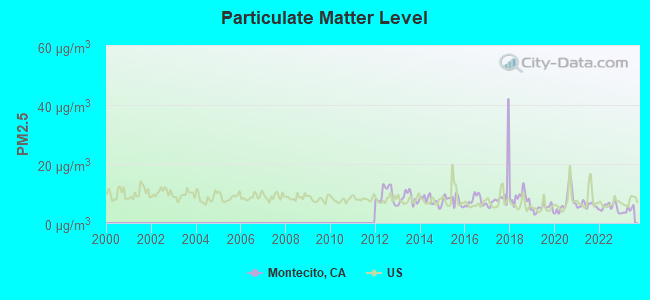
Air pollution - PM25
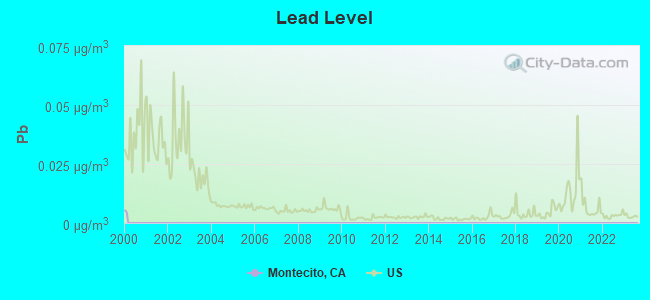
Air pollution - Pb
Crime - Murders per 100,000 population
Crime - Rapes per 100,000 population
Crime - Robberies per 100,000 population
Crime - Assaults per 100,000 population
Crime - Burglaries per 100,000 population
Crime - Thefts per 100,000 population
Crime - Auto thefts per 100,000 population
Crime - Arson per 100,000 population
Crime - City-data.com crime index
Crime - Violent crime index
Crime - Property crime index
Crime - Murders per 100,000 population (5 year average)
Crime - Rapes per 100,000 population (5 year average)
Crime - Robberies per 100,000 population (5 year average)
Crime - Assaults per 100,000 population (5 year average)
Crime - Burglaries per 100,000 population (5 year average)
Crime - Thefts per 100,000 population (5 year average)
Crime - Auto thefts per 100,000 population (5 year average)
Crime - Arson per 100,000 population (5 year average)
Crime - City-data.com crime index (5 year average)
Crime - Violent crime index (5 year average)
Crime - Property crime index (5 year average)
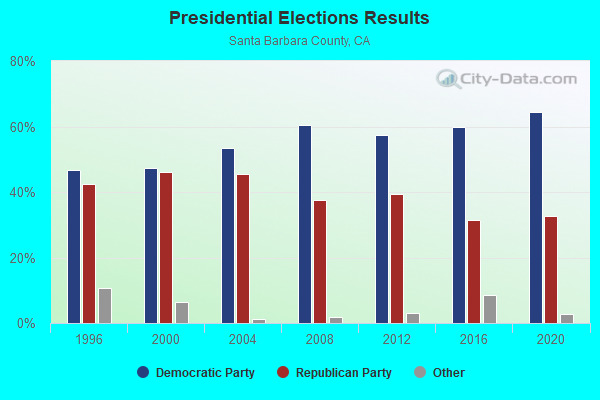
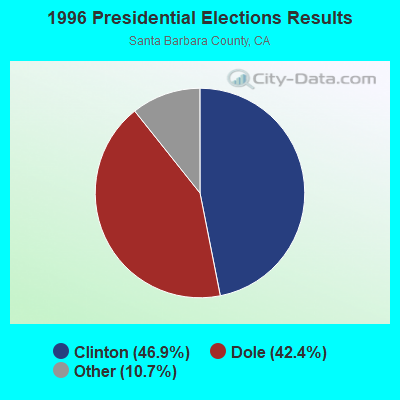
1996 Presidential Elections Results (%) - Democratic Party (Clinton)
1996 Presidential Elections Results (%) - Republican Party (Dole)
1996 Presidential Elections Results (%) - Other
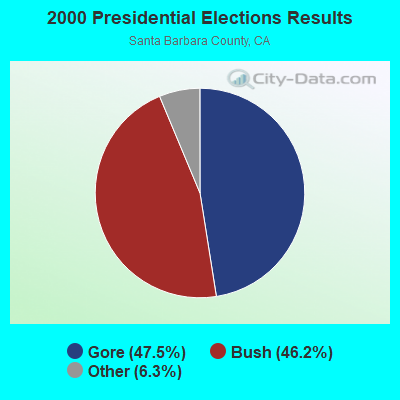
2000 Presidential Elections Results (%) - Democratic Party (Gore)
2000 Presidential Elections Results (%) - Republican Party (Bush)
2000 Presidential Elections Results (%) - Other
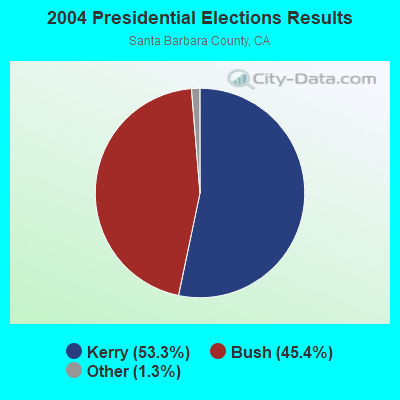
2004 Presidential Elections Results (%) - Democratic Party (Kerry)
2004 Presidential Elections Results (%) - Republican Party (Bush)
2004 Presidential Elections Results (%) - Other
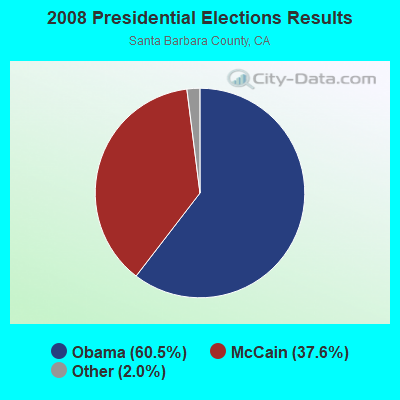
2008 Presidential Elections Results (%) - Democratic Party (Obama)
2008 Presidential Elections Results (%) - Republican Party (McCain)
2008 Presidential Elections Results (%) - Other
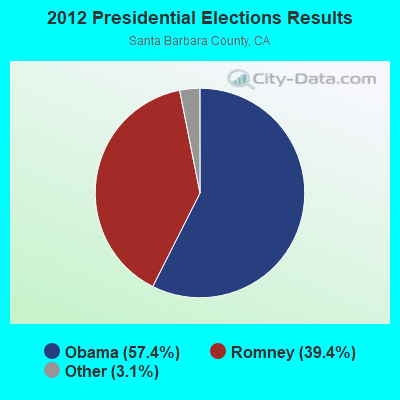
2012 Presidential Elections Results (%) - Democratic Party (Obama)
2012 Presidential Elections Results (%) - Republican Party (Romney)
2012 Presidential Elections Results (%) - Other
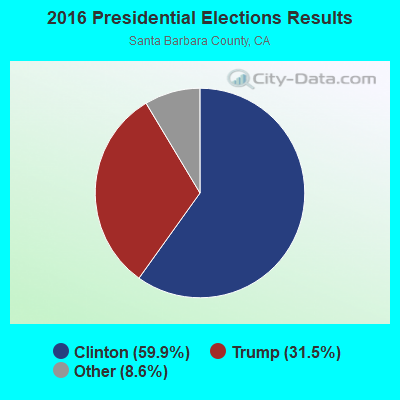
2016 Presidential Elections Results (%) - Democratic Party (Clinton)
2016 Presidential Elections Results (%) - Republican Party (Trump)
2016 Presidential Elections Results (%) - Other
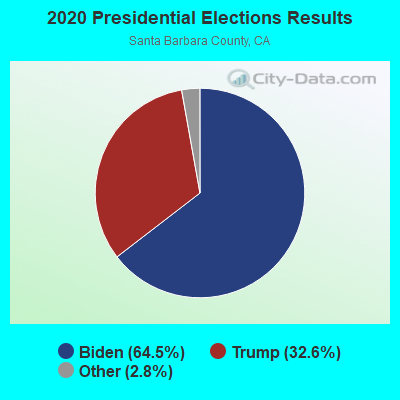
2020 Presidential Elections Results (%) - Democratic Party (Biden)
2020 Presidential Elections Results (%) - Republican Party (Trump)
2020 Presidential Elections Results (%) - Other
Ancestries Reported - Arab (%)
Ancestries Reported - Czech (%)
Ancestries Reported - Danish (%)
Ancestries Reported - Dutch (%)
Ancestries Reported - English (%)
Ancestries Reported - French (%)
Ancestries Reported - French Canadian (%)
Ancestries Reported - German (%)
Ancestries Reported - Greek (%)
Ancestries Reported - Hungarian (%)
Ancestries Reported - Irish (%)
Ancestries Reported - Italian (%)
Ancestries Reported - Lithuanian (%)
Ancestries Reported - Norwegian (%)
Ancestries Reported - Polish (%)
Ancestries Reported - Portuguese (%)
Ancestries Reported - Russian (%)
Ancestries Reported - Scotch-Irish (%)
Ancestries Reported - Scottish (%)
Ancestries Reported - Slovak (%)
Ancestries Reported - Subsaharan African (%)
Ancestries Reported - Swedish (%)
Ancestries Reported - Swiss (%)
Ancestries Reported - Ukrainian (%)
Ancestries Reported - United States (%)
Ancestries Reported - Welsh (%)
Ancestries Reported - West Indian (%)
Ancestries Reported - Other (%)
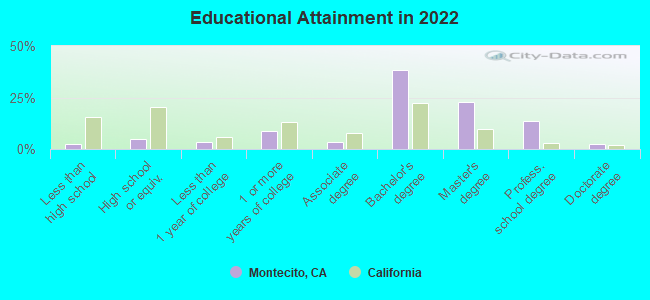
Educational Attainment - No schooling completed (%)
Educational Attainment - Less than high school (%)
Educational Attainment - High school or equivalent (%)
Educational Attainment - Less than 1 year of college (%)
Educational Attainment - 1 or more years of college (%)
Educational Attainment - Associate degree (%)
Educational Attainment - Bachelor's degree (%)
Educational Attainment - Master's degree (%)
Educational Attainment - Professional school degree (%)
Educational Attainment - Doctorate degree (%)
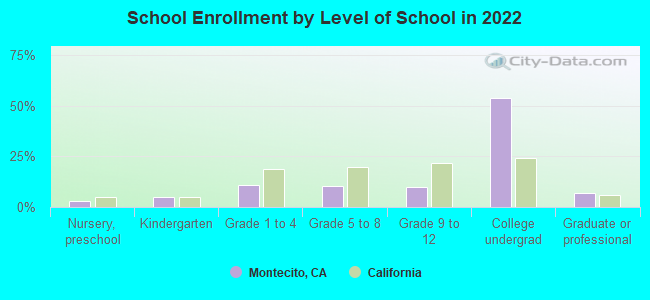
School Enrollment - Nursery, preschool (%)
School Enrollment - Kindergarten (%)
School Enrollment - Grade 1 to 4 (%)
School Enrollment - Grade 5 to 8 (%)
School Enrollment - Grade 9 to 12 (%)
School Enrollment - College undergrad (%)
School Enrollment - Graduate or professional (%)
School Enrollment - Not enrolled in school (%)
School enrollment - Public schools (%)
School enrollment - Private schools (%)
School enrollment - Not enrolled (%)
Median number of rooms in houses and condos
Median number of rooms in apartments
Housing units lacking complete plumbing facilities (%)
Housing units lacking complete kitchen facilities (%)
Density of houses
Urban houses (%)
Rural houses (%)
Households with people 60 years and over (%)
Households with people 65 years and over (%)
Households with people 75 years and over (%)
Households with one or more nonrelatives (%)
Households with no nonrelatives (%)
Population in households (%)
Family households (%)
Nonfamily households (%)
Population in families (%)
Family households with own children (%)
Median number of bedrooms in owner occupied houses
Mean number of bedrooms in owner occupied houses
Median number of bedrooms in renter occupied houses
Mean number of bedrooms in renter occupied houses
Median number of vehichles in owner occupied houses
Mean number of vehichles in owner occupied houses
Median number of vehichles in renter occupied houses
Mean number of vehichles in renter occupied houses
Mortgage status - with mortgage (%)
Mortgage status - with second mortgage (%)
Mortgage status - with home equity loan (%)
Mortgage status - with both second mortgage and home equity loan (%)
Mortgage status - without a mortgage (%)
Average family size
Average family size - White
Average family size - Black or African American
Average family size - Asian
Average family size - Hispanic or Latino
Average family size - American Indian and Alaska Native
Average family size - Multirace
Average family size - Other Race
Geographical mobility - Same house 1 year ago (%)
Geographical mobility - Moved within same county (%)
Geographical mobility - Moved from different county within same state (%)
Geographical mobility - Moved from different state (%)
Geographical mobility - Moved from abroad (%)
Place of birth - Born in state of residence (%)
Place of birth - Born in other state (%)
Place of birth - Native, outside of US (%)
Place of birth - Foreign born (%)
Housing units in structures - 1, detached (%)
Housing units in structures - 1, attached (%)
Housing units in structures - 2 (%)
Housing units in structures - 3 or 4 (%)
Housing units in structures - 5 to 9 (%)
Housing units in structures - 10 to 19 (%)
Housing units in structures - 20 to 49 (%)
Housing units in structures - 50 or more (%)
Housing units in structures - Mobile home (%)
Housing units in structures - Boat, RV, van, etc. (%)
House/condo owner moved in on average (years ago)
Renter moved in on average (years ago)
Year householder moved into unit - Moved in 1999 to March 2000 (%)
Year householder moved into unit - Moved in 1995 to 1998 (%)
Year householder moved into unit - Moved in 1990 to 1994 (%)
Year householder moved into unit - Moved in 1980 to 1989 (%)
Year householder moved into unit - Moved in 1970 to 1979 (%)
Year householder moved into unit - Moved in 1969 or earlier (%)
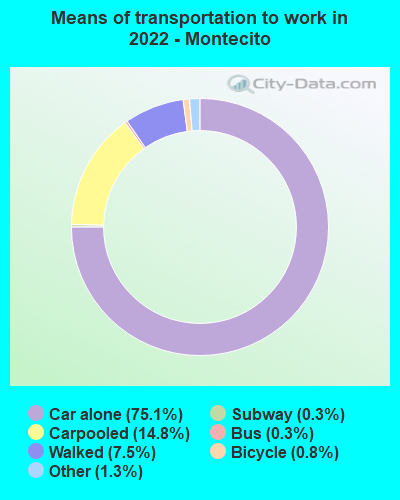
Means of transportation to work - Drove car alone (%)
Means of transportation to work - Carpooled (%)
Means of transportation to work - Public transportation (%)
Means of transportation to work - Bus or trolley bus (%)
Means of transportation to work - Streetcar or trolley car (%)
Means of transportation to work - Subway or elevated (%)
Means of transportation to work - Railroad (%)
Means of transportation to work - Ferryboat (%)
Means of transportation to work - Taxicab (%)
Means of transportation to work - Motorcycle (%)
Means of transportation to work - Bicycle (%)
Means of transportation to work - Walked (%)
Means of transportation to work - Other means (%)
Working at home (%)
Industry diversity
Most Common Industries - Agriculture, forestry, fishing and hunting, and mining (%)
Most Common Industries - Agriculture, forestry, fishing and hunting (%)
Most Common Industries - Mining, quarrying, and oil and gas extraction (%)
Most Common Industries - Construction (%)
Most Common Industries - Manufacturing (%)
Most Common Industries - Wholesale trade (%)
Most Common Industries - Retail trade (%)
Most Common Industries - Transportation and warehousing, and utilities (%)
Most Common Industries - Transportation and warehousing (%)
Most Common Industries - Utilities (%)
Most Common Industries - Information (%)
Most Common Industries - Finance and insurance, and real estate and rental and leasing (%)
Most Common Industries - Finance and insurance (%)
Most Common Industries - Real estate and rental and leasing (%)
Most Common Industries - Professional, scientific, and management, and administrative and waste management services (%)
Most Common Industries - Professional, scientific, and technical services (%)
Most Common Industries - Management of companies and enterprises (%)
Most Common Industries - Administrative and support and waste management services (%)
Most Common Industries - Educational services, and health care and social assistance (%)
Most Common Industries - Educational services (%)
Most Common Industries - Health care and social assistance (%)
Most Common Industries - Arts, entertainment, and recreation, and accommodation and food services (%)
Most Common Industries - Arts, entertainment, and recreation (%)
Most Common Industries - Accommodation and food services (%)
Most Common Industries - Other services, except public administration (%)
Most Common Industries - Public administration (%)
Occupation diversity
Most Common Occupations - Management, business, science, and arts occupations (%)
Most Common Occupations - Management, business, and financial occupations (%)
Most Common Occupations - Management occupations (%)
Most Common Occupations - Business and financial operations occupations (%)
Most Common Occupations - Computer, engineering, and science occupations (%)
Most Common Occupations - Computer and mathematical occupations (%)
Most Common Occupations - Architecture and engineering occupations (%)
Most Common Occupations - Life, physical, and social science occupations (%)
Most Common Occupations - Education, legal, community service, arts, and media occupations (%)
Most Common Occupations - Community and social service occupations (%)
Most Common Occupations - Legal occupations (%)
Most Common Occupations - Education, training, and library occupations (%)
Most Common Occupations - Arts, design, entertainment, sports, and media occupations (%)
Most Common Occupations - Healthcare practitioners and technical occupations (%)
Most Common Occupations - Health diagnosing and treating practitioners and other technical occupations (%)
Most Common Occupations - Health technologists and technicians (%)
Most Common Occupations - Service occupations (%)
Most Common Occupations - Healthcare support occupations (%)
Most Common Occupations - Protective service occupations (%)
Most Common Occupations - Fire fighting and prevention, and other protective service workers including supervisors (%)
Most Common Occupations - Law enforcement workers including supervisors (%)
Most Common Occupations - Food preparation and serving related occupations (%)
Most Common Occupations - Building and grounds cleaning and maintenance occupations (%)
Most Common Occupations - Personal care and service occupations (%)
Most Common Occupations - Sales and office occupations (%)
Most Common Occupations - Sales and related occupations (%)
Most Common Occupations - Office and administrative support occupations (%)
Most Common Occupations - Natural resources, construction, and maintenance occupations (%)
Most Common Occupations - Farming, fishing, and forestry occupations (%)
Most Common Occupations - Construction and extraction occupations (%)
Most Common Occupations - Installation, maintenance, and repair occupations (%)
Most Common Occupations - Production, transportation, and material moving occupations (%)
Most Common Occupations - Production occupations (%)
Most Common Occupations - Transportation occupations (%)
Most Common Occupations - Material moving occupations (%)
People in Group quarters - Institutionalized population (%)
People in Group quarters - Correctional institutions (%)
People in Group quarters - Federal prisons and detention centers (%)
People in Group quarters - Halfway houses (%)
People in Group quarters - Local jails and other confinement facilities (including police lockups) (%)
People in Group quarters - Military disciplinary barracks (%)
People in Group quarters - State prisons (%)
People in Group quarters - Other types of correctional institutions (%)
People in Group quarters - Nursing homes (%)
People in Group quarters - Hospitals/wards, hospices, and schools for the handicapped (%)
People in Group quarters - Hospitals/wards and hospices for chronically ill (%)
People in Group quarters - Hospices or homes for chronically ill (%)
People in Group quarters - Military hospitals or wards for chronically ill (%)
People in Group quarters - Other hospitals or wards for chronically ill (%)
People in Group quarters - Hospitals or wards for drug/alcohol abuse (%)
People in Group quarters - Mental (Psychiatric) hospitals or wards (%)
People in Group quarters - Schools, hospitals, or wards for the mentally retarded (%)
People in Group quarters - Schools, hospitals, or wards for the physically handicapped (%)
People in Group quarters - Institutions for the deaf (%)
People in Group quarters - Institutions for the blind (%)
People in Group quarters - Orthopedic wards and institutions for the physically handicapped (%)
People in Group quarters - Wards in general hospitals for patients who have no usual home elsewhere (%)
People in Group quarters - Wards in military hospitals for patients who have no usual home elsewhere (%)
People in Group quarters - Juvenile institutions (%)
People in Group quarters - Long-term care (%)
People in Group quarters - Homes for abused, dependent, and neglected children (%)
People in Group quarters - Residential treatment centers for emotionally disturbed children (%)
People in Group quarters - Training schools for juvenile delinquents (%)
People in Group quarters - Short-term care, detention or diagnostic centers for delinquent children (%)
People in Group quarters - Type of juvenile institution unknown (%)
People in Group quarters - Noninstitutionalized population (%)
People in Group quarters - College dormitories (includes college quarters off campus) (%)
People in Group quarters - Military quarters (%)
People in Group quarters - On base (%)
People in Group quarters - Barracks, unaccompanied personnel housing (UPH), (Enlisted/Officer), ;and similar group living quarters for military personnel (%)
People in Group quarters - Transient quarters for temporary residents (%)
People in Group quarters - Military ships (%)
People in Group quarters - Group homes (%)
People in Group quarters - Homes or halfway houses for drug/alcohol abuse (%)
People in Group quarters - Homes for the mentally ill (%)
People in Group quarters - Homes for the mentally retarded (%)
People in Group quarters - Homes for the physically handicapped (%)
People in Group quarters - Other group homes (%)
People in Group quarters - Religious group quarters (%)
People in Group quarters - Dormitories (%)
People in Group quarters - Agriculture workers' dormitories on farms (%)
People in Group quarters - Job Corps and vocational training facilities (%)
People in Group quarters - Other workers' dormitories (%)
People in Group quarters - Crews of maritime vessels (%)
People in Group quarters - Other nonhousehold living situations (%)
People in Group quarters - Other noninstitutional group quarters (%)
Residents speaking English at home (%)
Residents speaking English at home - Born in the United States (%)
Residents speaking English at home - Native, born elsewhere (%)
Residents speaking English at home - Foreign born (%)
Residents speaking Spanish at home (%)
Residents speaking Spanish at home - Born in the United States (%)
Residents speaking Spanish at home - Native, born elsewhere (%)
Residents speaking Spanish at home - Foreign born (%)
Residents speaking other language at home (%)
Residents speaking other language at home - Born in the United States (%)
Residents speaking other language at home - Native, born elsewhere (%)
Residents speaking other language at home - Foreign born (%)
Class of Workers - Employee of private company (%)
Class of Workers - Self-employed in own incorporated business (%)
Class of Workers - Private not-for-profit wage and salary workers (%)
Class of Workers - Local government workers (%)
Class of Workers - State government workers (%)
Class of Workers - Federal government workers (%)
Class of Workers - Self-employed workers in own not incorporated business and Unpaid family workers (%)
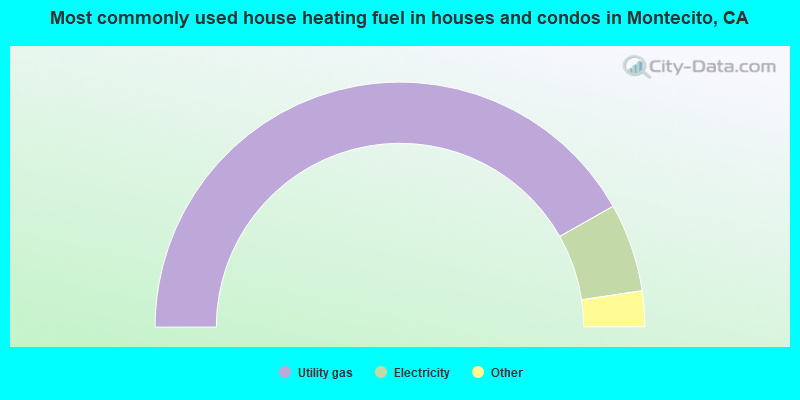
House heating fuel used in houses and condos - Utility gas (%)
House heating fuel used in houses and condos - Bottled, tank, or LP gas (%)
House heating fuel used in houses and condos - Electricity (%)
House heating fuel used in houses and condos - Fuel oil, kerosene, etc. (%)
House heating fuel used in houses and condos - Coal or coke (%)
House heating fuel used in houses and condos - Wood (%)
House heating fuel used in houses and condos - Solar energy (%)
House heating fuel used in houses and condos - Other fuel (%)
House heating fuel used in houses and condos - No fuel used (%)
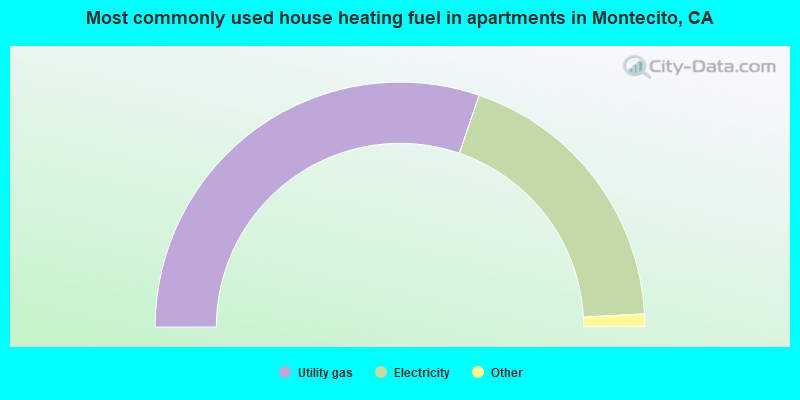
House heating fuel used in apartments - Utility gas (%)
House heating fuel used in apartments - Bottled, tank, or LP gas (%)
House heating fuel used in apartments - Electricity (%)
House heating fuel used in apartments - Fuel oil, kerosene, etc. (%)
House heating fuel used in apartments - Coal or coke (%)
House heating fuel used in apartments - Wood (%)
House heating fuel used in apartments - Solar energy (%)
House heating fuel used in apartments - Other fuel (%)
House heating fuel used in apartments - No fuel used (%)
Armed forces status - In Armed Forces (%)
Armed forces status - Civilian (%)
Armed forces status - Civilian - Veteran (%)
Armed forces status - Civilian - Nonveteran (%)
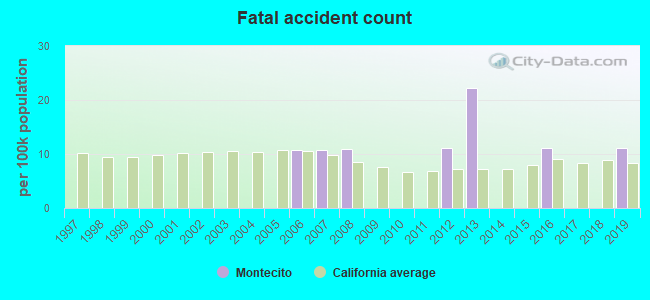
Fatal accidents locations in years 2005-2021
Fatal accidents locations in 2005
Fatal accidents locations in 2006
Fatal accidents locations in 2007
Fatal accidents locations in 2008
Fatal accidents locations in 2009
Fatal accidents locations in 2010
Fatal accidents locations in 2011
Fatal accidents locations in 2012
Fatal accidents locations in 2013
Fatal accidents locations in 2014
Fatal accidents locations in 2015
Fatal accidents locations in 2016
Fatal accidents locations in 2017
Fatal accidents locations in 2018
Fatal accidents locations in 2019
Fatal accidents locations in 2020
Fatal accidents locations in 2021
Alcohol use - People drinking some alcohol every month (%)
Alcohol use - People not drinking at all (%)
Alcohol use - Average days/month drinking alcohol
Alcohol use - Average drinks/week
Alcohol use - Average days/year people drink much
Audiometry - Average condition of hearing (%)
Audiometry - People that can hear a whisper from across a quiet room (%)
Audiometry - People that can hear normal voice from across a quiet room (%)
Audiometry - Ears ringing, roaring, buzzing (%)
Audiometry - Had a job exposure to loud noise (%)
Audiometry - Had off-work exposure to loud noise (%)
Blood Pressure & Cholesterol - Has high blood pressure (%)
Blood Pressure & Cholesterol - Checking blood pressure at home (%)
Blood Pressure & Cholesterol - Frequently checking blood cholesterol (%)
Blood Pressure & Cholesterol - Has high cholesterol level (%)
Consumer Behavior - Money monthly spent on food at supermarket/grocery store
Consumer Behavior - Money monthly spent on food at other stores
Consumer Behavior - Money monthly spent on eating out
Consumer Behavior - Money monthly spent on carryout/delivered foods
Consumer Behavior - Income spent on food at supermarket/grocery store (%)
Consumer Behavior - Income spent on food at other stores (%)
Consumer Behavior - Income spent on eating out (%)
Consumer Behavior - Income spent on carryout/delivered foods (%)
Current Health Status - General health condition (%)
Current Health Status - Blood donors (%)
Current Health Status - Has blood ever tested for HIV virus (%)
Current Health Status - Left-handed people (%)
Dermatology - People using sunscreen (%)
Diabetes - Diabetics (%)
Diabetes - Had a blood test for high blood sugar (%)
Diabetes - People taking insulin (%)
Diet Behavior & Nutrition - Diet health (%)
Diet Behavior & Nutrition - Milk product consumption (# of products/month)
Diet Behavior & Nutrition - Meals not home prepared (#/week)
Diet Behavior & Nutrition - Meals from fast food or pizza place (#/week)
Diet Behavior & Nutrition - Ready-to-eat foods (#/month)
Diet Behavior & Nutrition - Frozen meals/pizza (#/month)
Drug Use - People that ever used marijuana or hashish (%)
Drug Use - Ever used hard drugs (%)
Drug Use - Ever used any form of cocaine (%)
Drug Use - Ever used heroin (%)
Drug Use - Ever used methamphetamine (%)
Health Insurance - People covered by health insurance (%)
Kidney Conditions-Urology - Avg. # of times urinating at night
Medical Conditions - People with asthma (%)
Medical Conditions - People with anemia (%)
Medical Conditions - People with psoriasis (%)
Medical Conditions - People with overweight (%)
Medical Conditions - Elderly people having difficulties in thinking or remembering (%)
Medical Conditions - People who ever received blood transfusion (%)
Medical Conditions - People having trouble seeing even with glass/contacts (%)
Medical Conditions - People with arthritis (%)
Medical Conditions - People with gout (%)
Medical Conditions - People with congestive heart failure (%)
Medical Conditions - People with coronary heart disease (%)
Medical Conditions - People with angina pectoris (%)
Medical Conditions - People who ever had heart attack (%)
Medical Conditions - People who ever had stroke (%)
Medical Conditions - People with emphysema (%)
Medical Conditions - People with thyroid problem (%)
Medical Conditions - People with chronic bronchitis (%)
Medical Conditions - People with any liver condition (%)
Medical Conditions - People who ever had cancer or malignancy (%)
Mental Health - People who have little interest in doing things (%)
Mental Health - People feeling down, depressed, or hopeless (%)
Mental Health - People who have trouble sleeping or sleeping too much (%)
Mental Health - People feeling tired or having little energy (%)
Mental Health - People with poor appetite or overeating (%)
Mental Health - People feeling bad about themself (%)
Mental Health - People who have trouble concentrating on things (%)
Mental Health - People moving or speaking slowly or too fast (%)
Mental Health - People having thoughts they would be better off dead (%)
Oral Health - Average years since last visit a dentist
Oral Health - People embarrassed because of mouth (%)
Oral Health - People with gum disease (%)
Oral Health - General health of teeth and gums (%)
Oral Health - Average days a week using dental floss/device
Oral Health - Average days a week using mouthwash for dental problem
Oral Health - Average number of teeth
Pesticide Use - Households using pesticides to control insects (%)
Pesticide Use - Households using pesticides to kill weeds (%)
Physical Activity - People doing vigorous-intensity work activities (%)
Physical Activity - People doing moderate-intensity work activities (%)
Physical Activity - People walking or bicycling (%)
Physical Activity - People doing vigorous-intensity recreational activities (%)
Physical Activity - People doing moderate-intensity recreational activities (%)
Physical Activity - Average hours a day doing sedentary activities
Physical Activity - Average hours a day watching TV or videos
Physical Activity - Average hours a day using computer
Physical Functioning - People having limitations keeping them from working (%)
Physical Functioning - People limited in amount of work they can do (%)
Physical Functioning - People that need special equipment to walk (%)
Physical Functioning - People experiencing confusion/memory problems (%)
Physical Functioning - People requiring special healthcare equipment (%)
Prescription Medications - Average number of prescription medicines taking
Preventive Aspirin Use - Adults 40+ taking low-dose aspirin (%)
Reproductive Health - Vaginal deliveries (%)
Reproductive Health - Cesarean deliveries (%)
Reproductive Health - Deliveries resulted in a live birth (%)
Reproductive Health - Pregnancies resulted in a delivery (%)
Reproductive Health - Women breastfeeding newborns (%)
Reproductive Health - Women that had a hysterectomy (%)
Reproductive Health - Women that had both ovaries removed (%)
Reproductive Health - Women that have ever taken birth control pills (%)
Reproductive Health - Women taking birth control pills (%)
Reproductive Health - Women that have ever used Depo-Provera or injectables (%)
Reproductive Health - Women that have ever used female hormones (%)
Sexual Behavior - People 18+ that ever had sex (vaginal, anal, or oral) (%)
Sexual Behavior - Males 18+ that ever had vaginal sex with a woman (%)
Sexual Behavior - Males 18+ that ever performed oral sex on a woman (%)
Sexual Behavior - Males 18+ that ever had anal sex with a woman (%)
Sexual Behavior - Males 18+ that ever had any sex with a man (%)
Sexual Behavior - Females 18+ that ever had vaginal sex with a man (%)
Sexual Behavior - Females 18+ that ever performed oral sex on a man (%)
Sexual Behavior - Females 18+ that ever had anal sex with a man (%)
Sexual Behavior - Females 18+ that ever had any kind of sex with a woman (%)
Sexual Behavior - Average age people first had sex
Sexual Behavior - Average number of female sex partners in lifetime (males 18+)
Sexual Behavior - Average number of female vaginal sex partners in lifetime (males 18+)
Sexual Behavior - Average age people first performed oral sex on a woman (18+)
Sexual Behavior - Average number of woman performed oral sex on in lifetime (18+)
Sexual Behavior - Average number of male sex partners in lifetime (males 18+)
Sexual Behavior - Average number of male anal sex partners in lifetime (males 18+)
Sexual Behavior - Average age people first performed oral sex on a man (18+)
Sexual Behavior - Average number of male oral sex partners in lifetime (18+)
Sexual Behavior - People using protection when performing oral sex (%)
Sexual Behavior - Average number of times people have vaginal or anal sex a year
Sexual Behavior - People having sex without condom (%)
Sexual Behavior - Average number of male sex partners in lifetime (females 18+)
Sexual Behavior - Average number of male vaginal sex partners in lifetime (females 18+)
Sexual Behavior - Average number of female sex partners in lifetime (females 18+)
Sexual Behavior - Circumcised males 18+ (%)
Sleep Disorders - Average hours sleeping at night
Sleep Disorders - People that has trouble sleeping (%)
Smoking-Cigarette Use - People smoking cigarettes (%)
Taste & Smell - People 40+ having problems with smell (%)
Taste & Smell - People 40+ having problems with taste (%)
Taste & Smell - People 40+ that ever had wisdom teeth removed (%)
Taste & Smell - People 40+ that ever had tonsils teeth removed (%)
Taste & Smell - People 40+ that ever had a loss of consciousness because of a head injury (%)
Taste & Smell - People 40+ that ever had a broken nose or other serious injury to face or skull (%)
Taste & Smell - People 40+ that ever had two or more sinus infections (%)
Weight - Average height (inches)
Weight - Average weight (pounds)
Weight - Average BMI
Weight - People that are obese (%)
Weight - People that ever were obese (%)
Weight - People trying to lose weight (%)
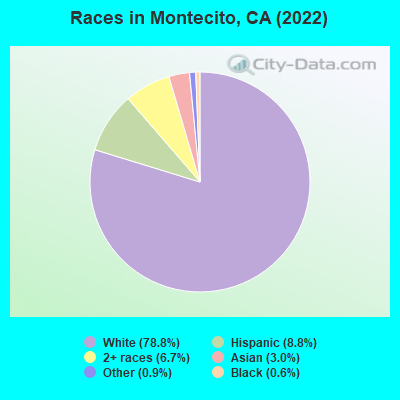
6,696 78.8% White alone 749 8.8% Hispanic 573 6.7% Two or more races 257 3.0% Asian alone 76 0.9% Other race alone 48 0.6% Black alone
Latest news from Montecito, CA collected exclusively by city-data.com from local newspapers, TV, and radio stations
Ancestries: American (15.5%), English (12.4%), German (7.0%), European (6.7%), British (4.4%), Irish (4.4%).
Current Local Time:
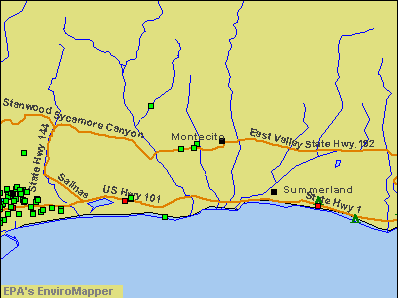
Land area: 9.33 square miles.
Population density: 961 people per square mile (low).
916 residents are foreign born (3.4% Europe , 3.1% Latin America , 2.4% Asia ).
This place:
10.8%California:
26.5%
Median real estate property taxes paid for housing units with mortgages in 2022: $9,527 (0.5%)Median real estate property taxes paid for housing units with no mortgage in 2022: $10,059 (0.5%)
Nearest city with pop. 50,000+: Santa Barbara, CA
Nearest city with pop. 200,000+: Bakersfield, CA
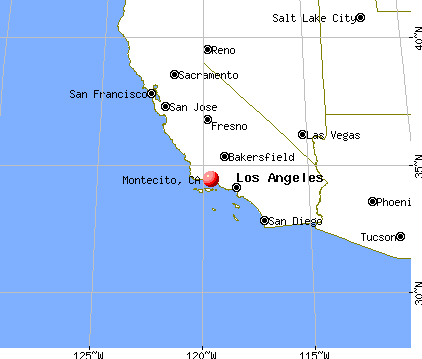
Nearest city with pop. 1,000,000+: Los Angeles, CA
Nearest cities:
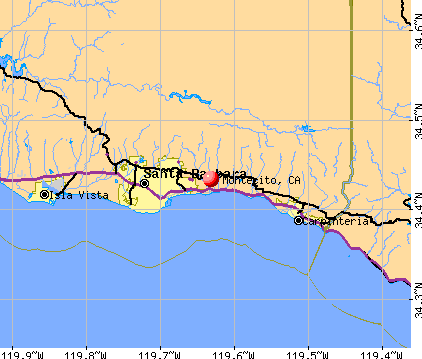
Latitude: 34.43 N, Longitude: 119.63 W
Daytime population change due to commuting: +2,060 (+24.2%)Workers who live and work in this place: 1,445 (48.0%)
Area code commonly used in this area: 805
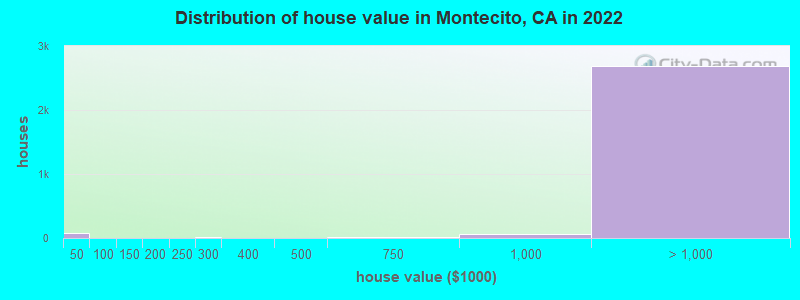
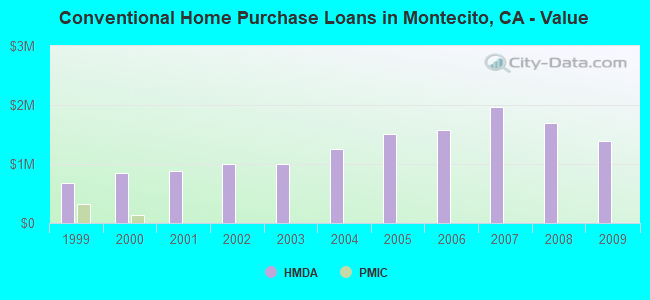
Property values in Montecito, CA
Unemployment in December 2023:
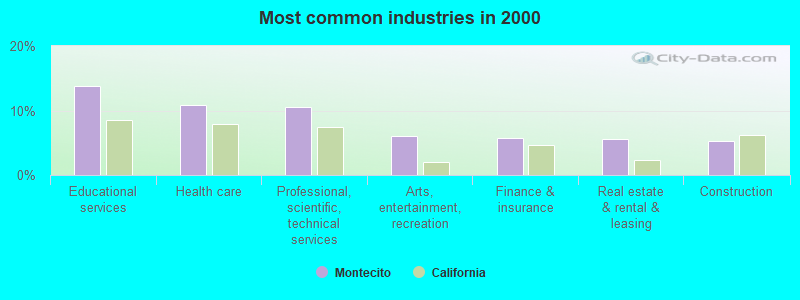
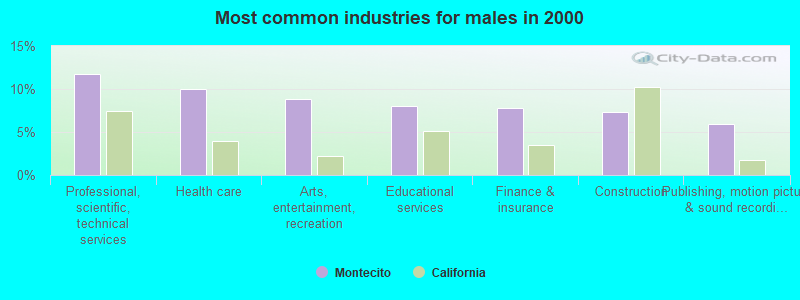
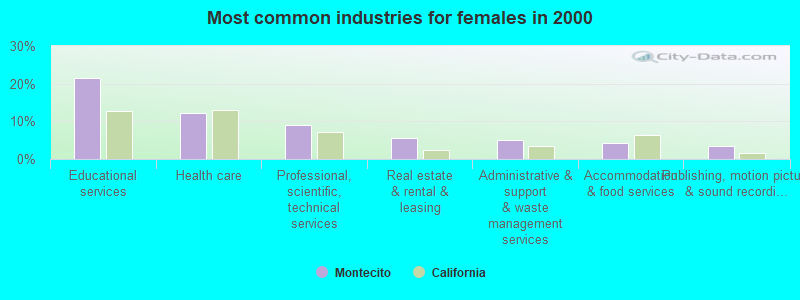
Most common industries in Montecito, CA (%)
Both Males Females
Educational services (13.8%)
Health care (10.9%)
Professional, scientific, technical services (10.6%)
Arts, entertainment, recreation (6.0%)
Finance & insurance (5.7%)
Real estate & rental & leasing (5.5%)
Construction (5.2%)
Professional, scientific, technical services (11.8%)
Health care (10.0%)
Arts, entertainment, recreation (8.8%)
Educational services (8.0%)
Finance & insurance (7.8%)
Construction (7.3%)
Publishing, motion picture & sound recording industries (6.0%)
Educational services (21.4%)
Health care (12.2%)
Professional, scientific, technical services (9.0%)
Real estate & rental & leasing (5.6%)
Administrative & support & waste management services (4.9%)
Accommodation & food services (4.3%)
Publishing, motion picture & sound recording industries (3.5%)
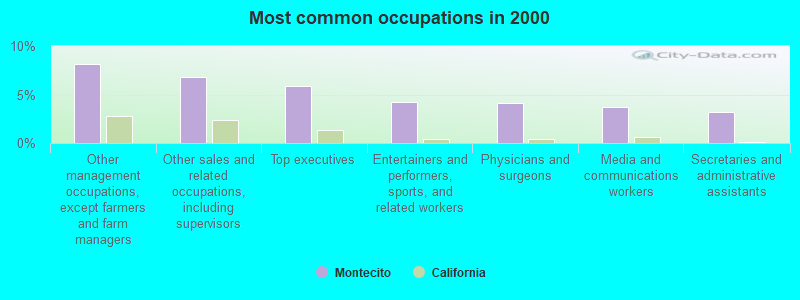
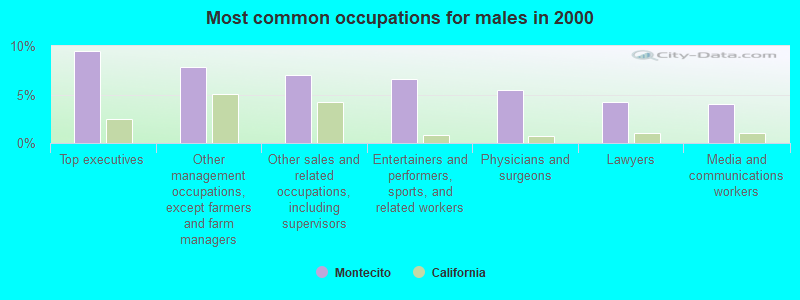
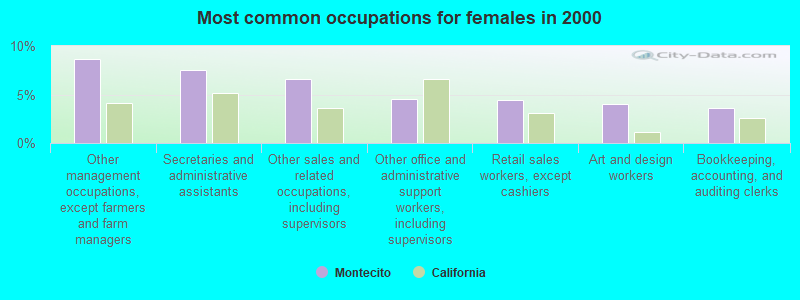
Most common occupations in Montecito, CA (%)
Both Males Females
Other management occupations, except farmers and farm managers (8.2%)
Other sales and related occupations, including supervisors (6.8%)
Top executives (5.9%)
Entertainers and performers, sports, and related workers (4.2%)
Physicians and surgeons (4.1%)
Media and communications workers (3.7%)
Secretaries and administrative assistants (3.2%)
Top executives (9.5%)
Other management occupations, except farmers and farm managers (7.8%)
Other sales and related occupations, including supervisors (7.0%)
Entertainers and performers, sports, and related workers (6.6%)
Physicians and surgeons (5.5%)
Lawyers (4.3%)
Media and communications workers (4.1%)
Other management occupations, except farmers and farm managers (8.6%)
Secretaries and administrative assistants (7.5%)
Other sales and related occupations, including supervisors (6.6%)
Other office and administrative support workers, including supervisors (4.5%)
Retail sales workers, except cashiers (4.5%)
Art and design workers (4.0%)
Bookkeeping, accounting, and auditing clerks (3.6%)
Earthquake activity:
Montecito-area historical earthquake activity is significantly above California state average. It is 6596% greater than the overall U.S. average. On 7/21/1952 at 11:52:14, a magnitude 7.7 (7.7 UK, Class: Major, Intensity: VIII - XII) earthquake occurred 53.1 miles away from the city center, causing $50,000,000 total damage On 11/4/1927 at 13:51:53, a magnitude 7.5 (7.5 UK) earthquake occurred 86.3 miles away from the city center On 6/28/1992 at 11:57:34, a magnitude 7.6 (6.2 MB, 7.6 MS, 7.3 MW, Depth: 0.7 mi) earthquake occurred 177.9 miles away from Montecito center, causing 3 deaths ( 1 shaking deaths, 2 other deaths) and 400 injuries, causing $100,000,000 total damage and $40,000,000 insured lossesOn 10/16/1999 at 09:46:44, a magnitude 7.4 (6.3 MB, 7.4 MS, 7.2 MW, 7.3 ML) earthquake occurred 182.4 miles away from Montecito center On 4/18/1906 at 13:12:21, a magnitude 7.9 (7.9 UK) earthquake occurred 310.1 miles away from the city center, causing $524,000,000 total damage On 1/17/1994 at 12:30:55, a magnitude 6.8 (6.4 MB, 6.8 MS, 6.7 MW, Depth: 11.4 mi, Class: Strong, Intensity: VII - IX) earthquake occurred 63.4 miles away from the city center, causing 60 deaths ( 60 shaking deaths) and 7000 injuriesMagnitude types: body-wave magnitude (MB), local magnitude (ML), surface-wave magnitude (MS), moment magnitude (MW) Natural disasters: The number of natural disasters in Santa Barbara County (31) is a lot greater than the US average (15).Major Disasters (Presidential) Declared: 19Emergencies Declared: 3Floods: 17, Fires: 10, Storms: 8, Winter Storms: 8, Mudslides: 7, Landslides: 4, Drought: 1, Earthquake: 1, Freeze: 1, Hurricane: 1, Tornado: 1, Wind: 1, Other: 1 (Note: some incidents may be assigned to more than one category). Hospitals and medical centers near Montecito: CASA DORINDA (Nursing Home, about 1 miles away; SANTA BARBARA, CA)
VISITING NURSE AND HOSPICE CARE OF SANTA BARBARA (Home Health Center, about 4 miles away; SANTA BARBARA, CA)
ASSISTED HEALTHCARE SERVICES (Home Health Center, about 5 miles away; SANTA BARBARA, CA)
SANTA BARBARA ARTIFICIAL KIDNEY CENTER, LLC (Dialysis Facility, about 5 miles away; SANTA BARBARA, CA)
FOREMOST HOME CARE OF CALIFORNIA, INC (Home Health Center, about 5 miles away; SANTA BARBARA, CA)
SANTA BARBARA CONVALESCENT HOSPITAL (Nursing Home, about 6 miles away; SANTA BARBARA, CA)
SANTA BARBARA COTTAGE CARE CENTER (Nursing Home, about 6 miles away; SANTA BARBARA, CA)
Amtrak stations near Montecito: 4 miles: SANTA BARBARA (209 STATE ST.) Services: ticket office, fully wheelchair accessible, enclosed waiting area, public restrooms, public payphones, full-service food facilities, free short-term parking, call for car rental service, call for taxi service, public transit connection.
7 miles: CARPINTERIA (5TH ST. & LINDEN AVE.) Services: fully wheelchair accessible, public payphones, full-service food facilities, free short-term parking, free long-term parking, call for taxi service.
12 miles: GOLETA (S. LA PATERA LN.) Colleges/universities with over 2000 students nearest to Montecito:
Santa Barbara City College (about 5 miles; Santa Barbara, CA ; Full-time enrollment: 12,568)
University of California-Santa Barbara (about 13 miles; Santa Barbara, CA ; FT enrollment: 22,806)
Ventura College (about 26 miles; Ventura, CA ; FT enrollment: 8,460)
Oxnard College (about 33 miles; Oxnard, CA ; FT enrollment: 3,879)
California State University-Channel Islands (about 39 miles; Camarillo, CA ; FT enrollment: 4,163)
California Lutheran University (about 46 miles; Thousand Oaks, CA ; FT enrollment: 4,103)
Moorpark College (about 47 miles; Moorpark, CA ; FT enrollment: 9,338)
Notable locations in Montecito: (A) , Valley Club (B) , La Casa de Maria Conference and Retreat Center (C) , Montecito Branch Santa Barbara Public Library (D) , Montecito Fire Protection District Station 2 (E) , Montecito Fire Protection District Station 1 (F) . Display/hide their locations on the map
Shopping Centers: (1) , Montecito Village Shopping Center (2) , Coast Village Shopping Center (3) . Display/hide their locations on the map
Churches in Montecito include: (A) , All Saints by the Sea Episcopal Church (B) , El Montecito Presbyterian Church (C) , Our Lady of Mount Carmel Church (D) . Display/hide their locations on the map
Cemetery: (1) . Display/hide its location on the map
Reservoirs: (A) , Romero Reservoir (B) . Display/hide their locations on the map
Creeks: (A) , Hot Springs Creek (B) , Montecito Creek (C) , Picay Creek (D) . Display/hide their locations on the map
Parks in Montecito include: (1) , Manning Park (2) . Display/hide their locations on the map
Santa Barbara County has a predicted average indoor radon screening level greater than 4 pCi/L (pico curies per liter) - Highest Potential Average household size: This place:
2.3 peopleCalifornia:
2.9 people
Percentage of family households: This place:
65.9%Whole state:
68.7%
Percentage of households with unmarried partners: This place:
4.3%Whole state:
7.2%
Likely homosexual households (counted as self-reported same-sex unmarried-partner households)
Lesbian couples: 0.3% of all households Gay men: 0.7% of all households
People in group quarters in Montecito in 2010:
909 people in college/university student housing
11 people in residential treatment centers for adults
8 people in other noninstitutional facilities
4 people in workers' group living quarters and job corps centers
People in group quarters in Montecito in 2000:
1,052 people in college dormitories (includes college quarters off campus)
45 people in nursing homes
12 people in religious group quarters
5 people in other noninstitutional group quarters
Banks with branches in Montecito (2011 data):
The Northern Trust Company: Montecito Branch at 1485 East Valley Road, branch established on 1997/01/15. Info updated 2011/10/07: Bank assets: $99,831.2 mil, Deposits: $84,041.7 mil, headquarters in Chicago, IL, positive income , International Specialization, 91 total offices , Holding Company: Northern Trust Corporation
Montecito Bank & Trust: Montecito Branch at 1106-A Coast Village Road, branch established on 1978/01/27. Info updated 2009/04/07: Bank assets: $1,018.4 mil, Deposits: $875.7 mil, headquarters in Santa Barbara, CA, positive income , Commercial Lending Specialization, 10 total offices , Holding Company: Montecito Bancorp
Wells Fargo Bank, National Association: Montecito Branch at 1482 East Valley Road, branch established on 1958/06/16. Info updated 2011/04/05: Bank assets: $1,161,490.0 mil, Deposits: $905,653.0 mil, headquarters in Sioux Falls, SD, positive income , 6395 total offices , Holding Company: Wells Fargo & Company
For population 15 years and over in Montecito:
Never married: 30.8%Now married: 51.0%Separated: 1.6%Widowed: 8.2%Divorced: 8.5% For population 25 years and over in Montecito:
High school or higher: 97.7%Bachelor's degree or higher: 76.0%Graduate or professional degree: 37.6%Unemployed: 17.2%Mean travel time to work (commute): 12.4 minutes
Education Gini index (Inequality in education) Here:
8.0California average:
15.5
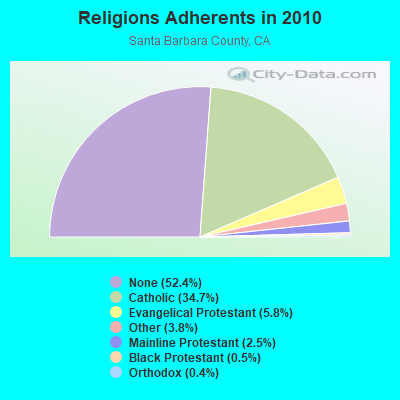
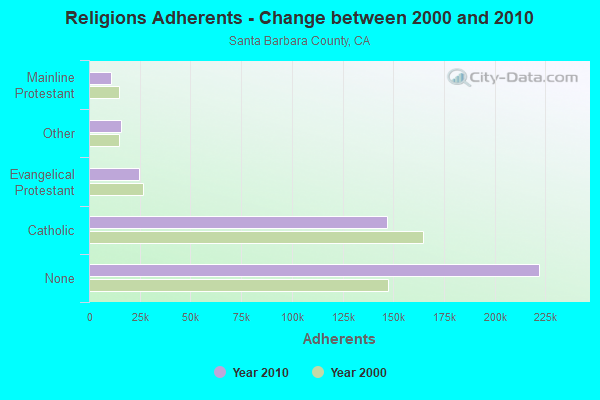
Religion statistics for Montecito, CA (based on Santa Barbara County data)
Religion Adherents Congregations Catholic 146,940 17 Evangelical Protestant 24,775 161 Other 15,951 58 Mainline Protestant 10,610 43 Black Protestant 1,979 13 Orthodox 1,536 7 None 222,104 -
Source: Clifford Grammich, Kirk Hadaway, Richard Houseal, Dale E.Jones, Alexei Krindatch, Richie Stanley and Richard H.Taylor. 2012. 2010 U.S.Religion Census: Religious Congregations & Membership Study. Association of Statisticians of American Religious Bodies. Jones, Dale E., et al. 2002. Congregations and Membership in the United States 2000. Nashville, TN: Glenmary Research Center. Graphs represent county-level data
Food Environment Statistics: Number of grocery stores : 105Here :
2.61 / 10,000 pop.State :
2.14 / 10,000 pop.
Number of supercenters and club stores : 2This county :
0.05 / 10,000 pop.State :
0.04 / 10,000 pop.
Number of convenience stores (no gas) : 30This county :
0.75 / 10,000 pop.California :
0.62 / 10,000 pop.
Number of convenience stores (with gas) : 74Santa Barbara County :
1.84 / 10,000 pop.California :
1.49 / 10,000 pop.
Number of full-service restaurants : 388This county :
9.65 / 10,000 pop.California :
7.42 / 10,000 pop.
Adult diabetes rate : This county :
7.3%California :
7.3%
Adult obesity rate : Santa Barbara County :
22.2%California :
21.3%
Low-income preschool obesity rate : Santa Barbara County :
18.3%California :
17.9%
Health and Nutrition: Healthy diet rate : Montecito:
54.0%California:
49.4%
Average overall health of teeth and gums : Montecito:
52.9%California:
48.0%
Average BMI : This city:
28.1California:
28.1
People feeling badly about themselves : This city:
19.2%State:
20.2%
People not drinking alcohol at all : Montecito:
8.5%State:
11.2%
Average hours sleeping at night : Overweight people : This city:
35.1%California:
31.5%
General health condition : Montecito:
58.7%California:
56.4%
Average condition of hearing : Montecito:
77.5%California:
80.9%
More about Health and Nutrition of Montecito, CA Residents
4.93% of this county's 2021 resident taxpayers lived in other counties in 2020 ($102,533 average adjusted gross income )
Here:
4.93%California average:
5.19%
0.04% of residents moved from foreign countries ($459 average AGI )Santa Barbara County:
0.04%California average:
0.03%
Top counties from which taxpayers relocated into this county between 2020 and 2021:
6.09% of this county's 2020 resident taxpayers moved to other counties in 2021 ($82,188 average adjusted gross income )
Here:
6.09%California average:
6.14%
0.03% of residents moved to foreign countries ($259 average AGI )Santa Barbara County:
0.03%California average:
0.02%
Top counties to which taxpayers relocated from this county between 2020 and 2021: Businesses in Montecito, CA
Strongest AM radio stations in Montecito:
KTMS (990 AM; 5 kW; SANTA BARBARA, CA; Owner: CITICASTERS LICENSES, L.P.)
KBKO (1490 AM; 1 kW; SANTA BARBARA, CA; Owner: CITICASTERS LICENSES, L.P.)
KTLK (1340 AM; 1 kW; SANTA BARBARA, CA; Owner: CITICASTERS LICENSES, L.P.)
KZBN (1290 AM; 0 kW; SANTA BARBARA, CA; Owner: ROTIJEFCO, INC.)
KGDP (660 AM; 50 kW; ORCUTT, CA; Owner: RADIO REPRESENTATIVES, INC.)
KEYT (1250 AM; 2 kW; SANTA BARBARA, CA; Owner: SMITH BROADCASTING OF SANTA BARBARA LIMITED PARTNERSHIP)
KSPN (710 AM; 50 kW; LOS ANGELES, CA; Owner: KABC-AM RADIO, INC.)
KACD (850 AM; 25 kW; THOUSAND OAKS, CA; Owner: CITICASTERS LICENSES, L.P.)
KLAC (570 AM; 50 kW; LOS ANGELES, CA; Owner: AMFM RADIO LICENSES, L.L.C.)
KIRN (670 AM; 35 kW; SIMI VALLEY, CA; Owner: LOTUS OXNARD CORP.)
KFI (640 AM; 50 kW; LOS ANGELES, CA; Owner: CAPSTAR TX LIMITED PARTNERSHIP)
KFWB (980 AM; 50 kW; LOS ANGELES, CA; Owner: INFINITY BROADCASTING OPERATIONS, INC.)
KNX (1070 AM; 50 kW; LOS ANGELES, CA; Owner: INFINITY BROADCASTING OPERATIONS, INC.)
Strongest FM radio stations in Montecito:
K254AH (98.7 FM; ISLA VISTA, CA; Owner: PACIFICA FOUNDATION, INC.)
KTYD (99.9 FM; SANTA BARBARA, CA; Owner: CITICASTERS LICENSES, L.P.)
KSBX (89.5 FM; SANTA BARBARA, CA; Owner: KCBX, INC.)
KJEE (92.9 FM; MONTECITO, CA; Owner: MONTECITO, FM, INC)
K218CP (91.5 FM; SANTA BARBARA, CA; Owner: CALVARY CHAPEL OF TWIN FALLS, INC.)
KFAC (88.7 FM; SANTA BARBARA, CA; Owner: UNIVERSITY OF SOUTHERN CALIFORNIA)
KDB (93.7 FM; SANTA BARBARA, CA; Owner: PACIFIC BROADCASTING COMPANY)
KKSB (106.3 FM; GOLETA, CA; Owner: CUMULUS LICENSING CORP.)
KSBL (101.7 FM; CARPINTERIA, CA; Owner: CITICASTERS LICENSES, L.P.)
K295AH (106.9 FM; GOLETA, CA; Owner: THE ASSOC., FOR COMMUNITY EDUC., INC)
KRAZ (105.9 FM; SANTA YNEZ, CA; Owner: KNIGHT BROADCASTING, INC.)
KRUZ (103.3 FM; SANTA BARBARA, CA; Owner: CUMULUS LICENSING CORP.)
KIST-FM (107.7 FM; SANTA BARBARA, CA; Owner: CITICASTERS LICENSES, L.P.)
KSPE-FM (94.5 FM; ELLWOOD, CA; Owner: CITICASTERS LICENSES, L.P.)
KMGQ (97.5 FM; SANTA BARBARA, CA; Owner: CUMULUS LICENSING CORP.)
KCSB-FM (91.9 FM; SANTA BARBARA, CA; Owner: UNIVERSITY OF CALIFORNIA)
K210CH (89.9 FM; OAK VIEW, CA; Owner: LIFE ON THE WAY COMMUNICATIONS, INC.)
KCAQ (104.7 FM; OXNARD, CA; Owner: GOLD COAST BROADCASTING LLC)
KOCP (95.9 FM; CAMARILLO, CA; Owner: GOLD COAST BROADCASTING LLC)
KFYV (105.5 FM; OJAI, CA; Owner: GOLD COAST BROADCASTING LLC)
TV broadcast stations around Montecito:
KVMM-CA (Channel 41; SANTA BARBARA, CA; Owner: CABALLERO TELEVISION TEXAS, L.L.C.)
KSBT-LP (Channel 32; SANTA BARBARA, CA; Owner: ARNOLD N. APPLEBAUM)
KTRO-LP (Channel 50; LANCASTER, CA; Owner: ROBERT D. ADELMAN)
K49EK (Channel 49; SANTA BARBARA, CA; Owner: COASTLINE COMMUNICATIONS, INC.)
K46GC (Channel 46; SANTA BARBARA, CA; Owner: PENNY DRUCKER)
K08MP (Channel 8; SANTA BARBARA, CA; Owner: MELISSA HARNETT)
KTSB-LP (Channel 43; SANTA BARBARA, CA; Owner: ENTRAVISION HOLDINGS, LLC)
KJLA (Channel 57; VENTURA, CA; Owner: KJLA, LLC)
KBAB-LP (Channel 51; SANTA BARBARA, CA; Owner: BILTMORE BROADCASTING CORPORATION)
K59CD (Channel 59; SANTA BARBARA, CA; Owner: NVG-SANTA BARBARA II, LLC)
K23EQ (Channel 23; VENTURA, CA; Owner: EQUITY BROADCASTING CORPORATION)
KSBB-LP (Channel 17; SANTA BARBARA, CA; Owner: SMITH BROADCASTING OF SANTA BARBARA, LP)
K15DB (Channel 15; SANTA BARBARA, CA; Owner: TRINITY BROADCASTING NETWORK)
K26FT (Channel 26; SANTA BARBARA, CA; Owner: COMMUNITY TV OF SOUTHERN CALIFORNIA)
KWHY-LP (Channel 22; SANTA BARBARA, CA; Owner: TELEMUNDO OF LOS ANGELES LICENSE CORPORATION)
National Bridge Inventory (NBI) Statistics 27 Number of bridges121ft / 36.9m Total length $745,000 Total costs474,977 Total average daily traffic26,689 Total average daily truck traffic
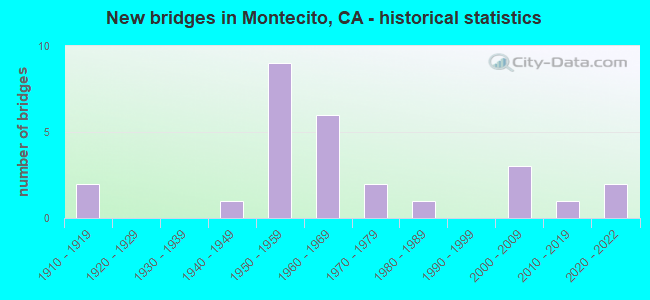
New bridges - historical statistics
2 1910-1919 1 1940-1949 9 1950-1959 6 1960-1969 2 1970-1979 1 1980-1989 3 2000-2009 1 2010-2019 2 2020-2022
See full National Bridge Inventory statistics for Montecito, CA
FCC Registered Antenna Towers: 2
2111 Ortega Hill Rd (Lat: 35.421944 Lon: -119.609167), Type: 18.5, Overall height: 15.2 m, Registrant: Gte Mobilnet Of Santa Barbara Limited Partnership, Jrobbins@mobilnet.Gte.Com, , Atlan-ta, Phone: (770) 391-1732 2111 Ortega Hill Rd (Lat: 34.421944 Lon: -119.609167), Type: 18.5, Overall height: 15.2 m, Registrant: Gte Mobilnet Of Santa Barbara Limited Partnership, Jrobbins@mobilnet.Gte.Com, , Atlan-ta, Phone: (770) 391-1732 FCC Registered Broadcast Land Mobile Towers: 8 (
See the full list of FCC Registered Broadcast Land Mobile Towers in Montecito, CA )
FCC Registered Microwave Towers: 1
MTO, CA, 595 San Ysidro Road (Lat: 34.440111 Lon: -119.632639), Type: Pipe, Structure height: 9.4 m, Overall height: 15.5 m, Call Sign: WRCU277, Assigned Frequencies: 17900.0 MHz, Grant Date: 01/31/2019, Expiration Date: 01/31/2029, Certifier: Jackie Jackins, Registrant: Consolidated Spectrum Services, 231 Sagamore Road, Gilford, NH 03249, Phone: (603) 293-0002, Email:
FCC Registered Maritime Coast & Aviation Ground Towers: 2
Platform Henry 6 Mi S (Lat: 34.338889 Lon: -119.561500), Type: Building, Overall height: 63 m, Call Sign: WHX712, Assigned Frequencies: 156.450 MHz, 156.500 MHz, 156.800 MHz, Grant Date: 01/17/2013, Expiration Date: 02/02/2023, Cancellation Date: 04/08/2023, Certifier: Todd Brigham Mr., Registrant: Dos Cuadras Offshore Resources, 290 Maple Court, Suite 290, Ventura, CA 93003, Phone: (805) 535-2034, Fax: (805) 535-2100, Email:
Platform Hillhouse 6 Mi S (Lat: 34.330833 Lon: -119.604306), Type: Building, Overall height: 67 m, Call Sign: WRV337, Assigned Frequencies: 156.450 MHz, 156.500 MHz, 156.800 MHz, Grant Date: 01/24/2013, Expiration Date: 02/02/2023, Cancellation Date: 04/08/2023, Certifier: Todd Brigham Mr., Registrant: Dos Cuadras Offshore Resources, 290 Maple Court, Suite 290, Ventura, CA 93003, Phone: (805) 535-2034, Fax: (805) 535-2100, Email:
FCC Registered Amateur Radio Licenses: 10 (
See the full list of FCC Registered Amateur Radio Licenses in Montecito )
FAA Registered Aircraft: 4
Aircraft: CIRRUS DESIGN CORP SR22 (Category: Land, Seats: 4, Weight: Up to 12,499 Pounds), Engine: CONT MOTOR IO-550-N (310 HP) (Reciprocating)N-Number: 122RS, N122RS, N-122RS, Serial Number: 3241, Year manufactured: 2008, Airworthiness Date: 08/28/2008, Certificate Issue Date: 04/06/2015Registrant (LLC): Abo Air LLC, 770 Via Manana, Montecito, CA 93108Aircraft: BEECH A45 (Category: Land, Seats: 2, Weight: Up to 12,499 Pounds, Speed: 141 mph), Engine: CONT MOTOR O-470 SERIES (230 HP) (Reciprocating)N-Number: 18255, N18255, N-18255, Serial Number: G-739, Airworthiness Date: 07/27/1990, Certificate Issue Date: 08/04/1998Registrant (Corporation): Viper Aviation Inc, 1436 Irvine Ln, Montecito, CA 93108Aircraft: HUGHES 369HS (Category: Land, Seats: 4, Weight: Up to 12,499 Pounds, Speed: 112 mph), Engine: ALLISON 250 SER 317HP (317 HP) (Turbo-shaft)N-Number: 5QZ, N5QZ, N-5QZ, Serial Number: 109-0114S, Year manufactured: 1969, Airworthiness Date: 07/27/1973, Certificate Issue Date: 02/08/2019Registrant (Individual): Bruce Stratton, 1200 Hot Springs Rd, Montecito, CA 93108Aircraft: HUGHES 369A (Category: Land, Seats: 4, Weight: Up to 12,499 Pounds), Engine: ROLLS-ROYC 250-C20B (420 HP) (Turbo-shaft)N-Number: 5QZ, N5QZ, N-5QZ, Serial Number: 380362, Year manufactured: 1968, Airworthiness Date: 03/27/2015, Certificate Issue Date: 08/29/2012Registrant (Individual): Bruce A Stratton, 1200 Hot Springs Rd, Montecito, CA 93108
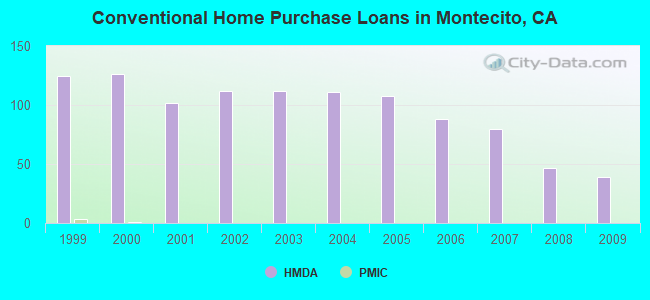
Home Mortgage Disclosure Act Aggregated Statistics For Year 2009(Based on 3 partial tracts) B) Conventional C) Refinancings D) Home Improvement Loans E) Loans on Dwellings For 5+ Families F) Non-occupant Loans on Number Average Value Number Average Value Number Average Value Number Average Value Number Average Value
LOANS ORIGINATED 39 $1,388,658 201 $817,373 10 $671,530 0 $0 44 $974,332 APPLICATIONS APPROVED, NOT ACCEPTED 6 $800,885 17 $914,256 1 $244,550 0 $0 7 $874,394 APPLICATIONS DENIED 11 $825,892 58 $927,721 3 $424,207 0 $0 12 $716,179 APPLICATIONS WITHDRAWN 7 $1,871,884 39 $920,223 0 $0 1 $4,138,390 8 $1,628,305 FILES CLOSED FOR INCOMPLETENESS 0 $0 11 $1,108,555 1 $706,650 0 $0 4 $932,012
Aggregated Statistics For Year 2008(Based on 3 partial tracts) B) Conventional C) Refinancings D) Home Improvement Loans F) Non-occupant Loans on Number Average Value Number Average Value Number Average Value Number Average Value
LOANS ORIGINATED 47 $1,687,675 98 $1,419,688 10 $1,349,051 46 $1,693,670 APPLICATIONS APPROVED, NOT ACCEPTED 11 $1,501,287 26 $819,462 0 $0 6 $1,001,735 APPLICATIONS DENIED 18 $1,512,570 46 $1,766,639 7 $1,362,361 9 $1,253,827 APPLICATIONS WITHDRAWN 16 $1,830,638 15 $1,081,069 1 $319,320 6 $784,337 FILES CLOSED FOR INCOMPLETENESS 4 $1,335,190 12 $1,250,924 1 $849,050 3 $1,142,613
Aggregated Statistics For Year 2007(Based on 3 partial tracts) B) Conventional C) Refinancings D) Home Improvement Loans E) Loans on Dwellings For 5+ Families F) Non-occupant Loans on G) Loans On Manufactured Number Average Value Number Average Value Number Average Value Number Average Value Number Average Value Number Average Value
LOANS ORIGINATED 80 $1,973,483 152 $1,269,198 19 $1,013,208 1 $1,055,090 55 $1,662,008 0 $0 APPLICATIONS APPROVED, NOT ACCEPTED 21 $1,680,279 31 $1,173,666 6 $648,918 0 $0 9 $1,248,782 0 $0 APPLICATIONS DENIED 27 $1,720,733 59 $1,245,874 6 $740,075 0 $0 21 $1,205,810 1 $28,290 APPLICATIONS WITHDRAWN 17 $1,595,169 22 $1,332,520 4 $2,640,508 1 $2,828,700 6 $2,697,397 0 $0 FILES CLOSED FOR INCOMPLETENESS 2 $1,323,345 8 $766,085 0 $0 0 $0 2 $761,865 0 $0
Aggregated Statistics For Year 2006(Based on 3 partial tracts) B) Conventional C) Refinancings D) Home Improvement Loans E) Loans on Dwellings For 5+ Families F) Non-occupant Loans on Number Average Value Number Average Value Number Average Value Number Average Value Number Average Value
LOANS ORIGINATED 88 $1,567,908 168 $1,327,385 28 $1,029,689 1 $2,668,500 73 $1,320,199 APPLICATIONS APPROVED, NOT ACCEPTED 19 $1,661,621 33 $1,177,882 5 $765,062 0 $0 11 $1,221,098 APPLICATIONS DENIED 29 $1,035,167 57 $1,195,051 7 $1,059,337 0 $0 21 $1,159,206 APPLICATIONS WITHDRAWN 28 $1,603,652 36 $1,204,910 7 $1,408,696 0 $0 15 $1,285,848 FILES CLOSED FOR INCOMPLETENESS 4 $909,698 8 $766,000 0 $0 0 $0 2 $1,267,435
Aggregated Statistics For Year 2005(Based on 3 partial tracts) B) Conventional C) Refinancings D) Home Improvement Loans E) Loans on Dwellings For 5+ Families F) Non-occupant Loans on G) Loans On Manufactured Number Average Value Number Average Value Number Average Value Number Average Value Number Average Value Number Average Value
LOANS ORIGINATED 108 $1,500,864 219 $1,123,917 30 $915,003 1 $4,148,760 72 $1,053,283 0 $0 APPLICATIONS APPROVED, NOT ACCEPTED 15 $1,244,013 25 $1,076,312 1 $571,580 0 $0 5 $1,410,474 0 $0 APPLICATIONS DENIED 23 $1,665,127 48 $1,418,428 9 $1,047,914 0 $0 11 $1,587,492 1 $117,860 APPLICATIONS WITHDRAWN 30 $1,550,343 43 $1,062,231 7 $1,114,479 2 $2,998,420 10 $1,490,603 0 $0 FILES CLOSED FOR INCOMPLETENESS 5 $942,400 12 $929,555 1 $64,930 0 $0 1 $2,206,390 0 $0
Aggregated Statistics For Year 2004(Based on 3 partial tracts) B) Conventional C) Refinancings D) Home Improvement Loans F) Non-occupant Loans on Number Average Value Number Average Value Number Average Value Number Average Value
LOANS ORIGINATED 111 $1,255,976 340 $912,729 20 $650,630 75 $920,064 APPLICATIONS APPROVED, NOT ACCEPTED 17 $1,311,814 33 $919,536 2 $753,005 9 $864,779 APPLICATIONS DENIED 14 $1,285,575 56 $1,221,166 9 $733,486 9 $959,669 APPLICATIONS WITHDRAWN 18 $1,444,528 57 $939,153 5 $1,401,244 16 $957,379 FILES CLOSED FOR INCOMPLETENESS 1 $1,040,830 11 $1,326,476 1 $5,720,570 1 $1,810,370
Aggregated Statistics For Year 2003(Based on 3 partial tracts) B) Conventional C) Refinancings D) Home Improvement Loans E) Loans on Dwellings For 5+ Families F) Non-occupant Loans on Number Average Value Number Average Value Number Average Value Number Average Value Number Average Value
LOANS ORIGINATED 112 $1,004,137 697 $712,370 10 $171,272 2 $1,241,285 107 $681,361 APPLICATIONS APPROVED, NOT ACCEPTED 21 $649,855 77 $680,088 2 $191,105 0 $0 18 $523,357 APPLICATIONS DENIED 16 $1,246,585 94 $834,404 1 $323,310 0 $0 13 $767,890 APPLICATIONS WITHDRAWN 21 $794,223 99 $702,897 1 $387,180 0 $0 13 $547,454 FILES CLOSED FOR INCOMPLETENESS 1 $1,010,570 11 $1,371,205 0 $0 0 $0 1 $689,000
Aggregated Statistics For Year 2002(Based on 3 partial tracts) B) Conventional C) Refinancings D) Home Improvement Loans F) Non-occupant Loans on Number Average Value Number Average Value Number Average Value Number Average Value
LOANS ORIGINATED 112 $993,188 563 $739,187 4 $384,075 95 $783,640 APPLICATIONS APPROVED, NOT ACCEPTED 14 $887,154 67 $735,395 0 $0 9 $584,547 APPLICATIONS DENIED 19 $1,770,074 53 $911,015 2 $383,685 8 $1,650,074 APPLICATIONS WITHDRAWN 19 $1,099,138 53 $743,486 0 $0 13 $860,259 FILES CLOSED FOR INCOMPLETENESS 1 $582,560 16 $701,128 0 $0 1 $175,630
Aggregated Statistics For Year 2001(Based on 3 partial tracts) B) Conventional C) Refinancings D) Home Improvement Loans F) Non-occupant Loans on Number Average Value Number Average Value Number Average Value Number Average Value
LOANS ORIGINATED 102 $877,694 381 $705,159 8 $212,388 62 $760,500 APPLICATIONS APPROVED, NOT ACCEPTED 18 $920,353 36 $688,676 1 $175,340 6 $718,360 APPLICATIONS DENIED 18 $926,531 59 $799,403 4 $373,565 7 $737,050 APPLICATIONS WITHDRAWN 16 $976,969 43 $697,190 2 $83,355 8 $708,344 FILES CLOSED FOR INCOMPLETENESS 3 $725,813 21 $509,293 0 $0 2 $302,495
Aggregated Statistics For Year 2000(Based on 3 partial tracts) B) Conventional C) Refinancings D) Home Improvement Loans E) Loans on Dwellings For 5+ Families F) Non-occupant Loans on Number Average Value Number Average Value Number Average Value Number Average Value Number Average Value
LOANS ORIGINATED 126 $843,131 95 $775,275 14 $93,074 1 $409,790 33 $801,937 APPLICATIONS APPROVED, NOT ACCEPTED 26 $741,912 17 $878,331 4 $59,045 0 $0 4 $733,840 APPLICATIONS DENIED 15 $1,035,035 43 $748,572 7 $219,849 0 $0 3 $588,713 APPLICATIONS WITHDRAWN 14 $847,699 23 $422,454 1 $27,450 0 $0 2 $1,269,505 FILES CLOSED FOR INCOMPLETENESS 5 $981,626 9 $711,906 1 $151,270 0 $0 2 $1,970,870
Aggregated Statistics For Year 1999(Based on 3 partial tracts) A) FHA, FSA/RHS & VA B) Conventional C) Refinancings D) Home Improvement Loans E) Loans on Dwellings For 5+ Families F) Non-occupant Loans on Number Average Value Number Average Value Number Average Value Number Average Value Number Average Value Number Average Value
LOANS ORIGINATED 1 $68,420 125 $683,628 225 $589,932 9 $121,830 2 $817,055 45 $547,681 APPLICATIONS APPROVED, NOT ACCEPTED 0 $0 19 $705,309 31 $642,553 3 $90,847 0 $0 5 $374,768 APPLICATIONS DENIED 0 $0 22 $561,842 46 $705,198 8 $89,101 0 $0 6 $544,888 APPLICATIONS WITHDRAWN 0 $0 27 $794,361 39 $607,060 1 $172,880 0 $0 3 $412,167 FILES CLOSED FOR INCOMPLETENESS 0 $0 3 $970,873 10 $952,480 0 $0 2 $1,637,630 0 $0
Detailed HMDA statistics for the following Tracts:
0007.00
, 0014.00 , 0015.00
Private Mortgage Insurance Companies Aggregated Statistics For Year 2000(Based on 3 partial tracts) A) Conventional Number Average Value
LOANS ORIGINATED 1 $127,860 APPLICATIONS APPROVED, NOT ACCEPTED 1 $288,530 APPLICATIONS DENIED 0 $0 APPLICATIONS WITHDRAWN 0 $0 FILES CLOSED FOR INCOMPLETENESS 0 $0
Aggregated Statistics For Year 1999(Based on 2 partial tracts) A) Conventional Number Average Value
LOANS ORIGINATED 3 $326,477 APPLICATIONS APPROVED, NOT ACCEPTED 0 $0 APPLICATIONS DENIED 0 $0 APPLICATIONS WITHDRAWN 0 $0 FILES CLOSED FOR INCOMPLETENESS 0 $0
Detailed PMIC statistics for the following Tracts:
0007.00
, 0014.00 , 0015.00 Montecito compared to California state average:
Median household income above state average. Median house value significantly above state average. Black race population percentage significantly below state average. Hispanic race population percentage significantly below state average. Median age significantly above state average. Foreign-born population percentage significantly below state average. Renting percentage below state average. Length of stay since moving in above state average. Number of rooms per house above state average. Number of college students above state average. Percentage of population with a bachelor's degree or higher significantly above state average.
#7 on the list of "Top 101 cities with the highest percentage of workers working at home, population 5,000+"
#34 on the list of "Top 101 cities with largest percentage of females in occupations: arts, design, entertainment, sports, and media occupations (population 5,000+)"
#61 on the list of "Top 100 cities with highest median house value (pop. 5,000+)"
#79 on the list of "Top 101 cities with largest percentage of males in occupations: management occupations (population 5,000+)"
#84 on the list of "Top 101 cities with largest percentage of males in industries: real estate and rental and leasing (population 5,000+)"
#33 (93108) on the list of "Top 101 zip codes with the smallest percentage of returns reporting salary or wage in 2012 (pop 5,000+)"
#42 (93108) on the list of "Top 101 zip codes with the highest 2012 average taxable interest for individuals (pop 5,000+)"
#48 (93108) on the list of "Top 101 zip codes with the largest percentage of taxpayers reporting net capital gain/loss in 2012 (pop 5,000+)"
#67 (93108) on the list of "Top 101 zip codes with the largest percentage of taxpayers reporting taxable interest in 2012 (pop 5,000+)"
#17 on the list of "Top 101 counties with the lowest Sulfur Oxides Annual air pollution readings in 2012 (µg/m3 )"
#32 on the list of "Top 101 counties with the highest Nitrogen Dioxide air pollution readings in 2012 (ppm)"
#38 on the list of "Top 101 counties with the lowest number of infant deaths per 1000 residents 2007-2013 (pop. 50,000+)"
#78 on the list of "Top 101 counties with the highest carbon monoxide air pollution readings in 2012 (ppm)"
#81 on the list of "Top 101 counties with the largest decrease in the number of infant deaths per 1000 residents 2000-2006 to 2007-2013 (pop. 50,000+)"
Top Patent Applicants
Umesh Mishra (61)
Umesh K. Mishra (43)
Roy J. Mankovitz (18)
Daniel C. Wiggins (8)
James G.p. Dehlsen (7)
William R. Peitzke (6)
James G. P. Dehlsen (5)
Dan Wiggins (5)
Paul Wren (4)
Janet C. Cheetham (4)
Total of 204 patent applications in 2008-2024.


 Recent articles from our blog. Our writers, many of them Ph.D. graduates or candidates, create easy-to-read articles on a wide variety of topics.

 (4.7 miles