Estimated zip code population in 2022: 11,115 Zip code population in 2010: 11,112 Zip code population in 2000: 12,737
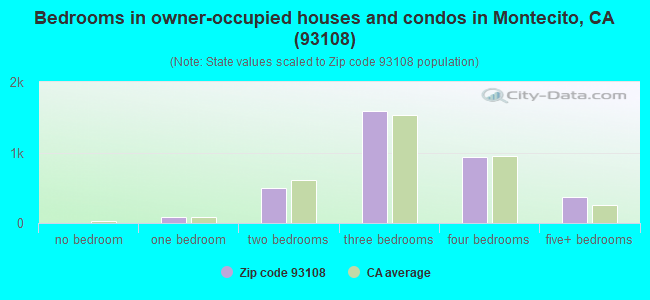
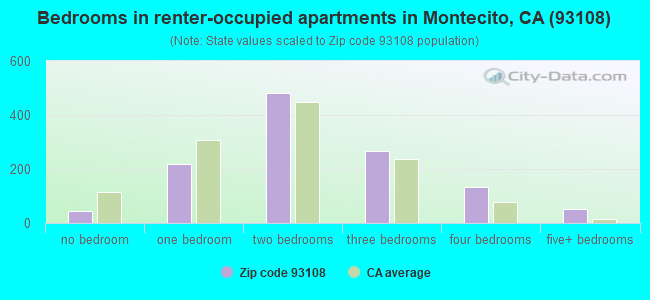
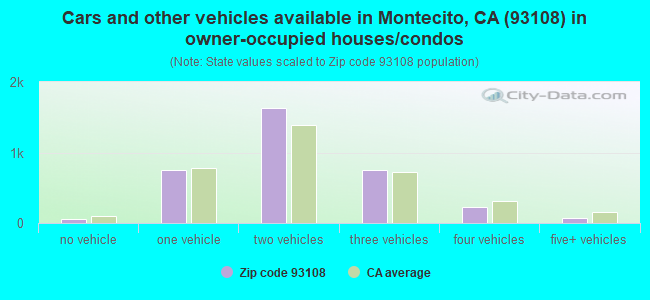
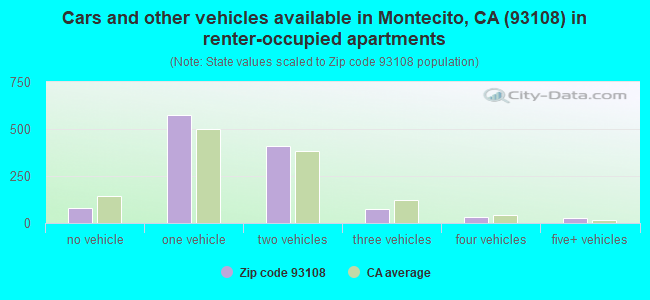
Houses and condos: 5,674 Renter-occupied apartments: 1,196
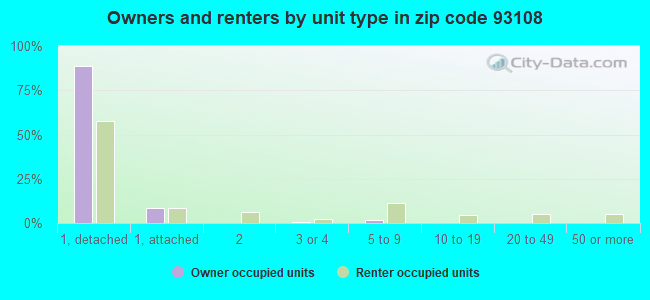
% of renters here:
26%
State:
44%
March 2022 cost of living index in zip code 93108: 118.4 (more than average, U.S. average is 100)
Land area: 21.2 sq. mi. Water area: 0.1 sq. mi.
Population density: 524 people per square mile
(low).
OSM Map
General Map
Google Map
MSN Map
OSM Map
General Map
Google Map
MSN Map
OSM Map
General Map
Google Map
MSN Map
OSM Map
General Map
Google Map
MSN Map
Please wait while loading the map...
Real estate property taxes paid for housing units in 2022:
This zip code:
0.5% ($10,292)
California:
0.7% ($4,831)
Median real estate property taxes paid for housing units with mortgages in 2022: $10,330 (0.5%) Median real estate property taxes paid for housing units with no mortgage in 2022: $10,572 (0.5%)
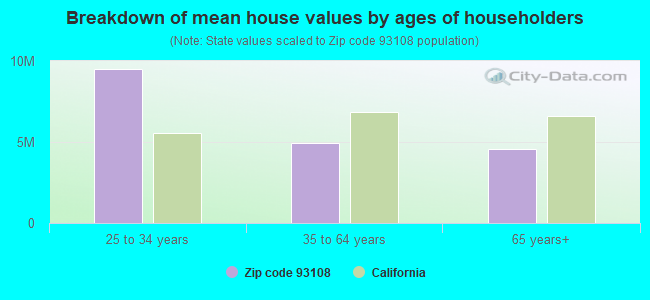
Estimated median house/condo value in 2022: $2,171,698
93108:
$2,171,698
California:
$715,900
According to our research of California and other state lists, there was 1 registered sex offender living in 93108 zip code as of April 27, 2024. The ratio of all residents to sex offenders in zip code 93108 is 11,507 to 1. The ratio of registered sex offenders to all residents in this zip code is much lower than the state average.
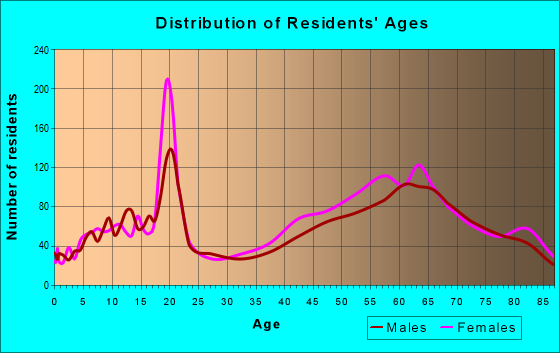
Median resident age:
This zip code:
55.4 years
California median age:
37.9 years
Average household size:
This zip code:
2.1 people
California:
2.8 people
Averages for the 2020 tax year for zip code 93108, filed in 2021:
Average Adjusted Gross Income (AGI) in 2020: $931,392 (Individual Income Tax Returns)
Here:
$931,392
State:
$95,910
Salary/wage: $185,093 (reported on 54.9% of returns)
Here:
$185,093
State:
$77,331
(% of AGI for various income ranges: 1130.8% for AGIs below $25k, 3790.0% for AGIs $25k-50k, 7538.8% for AGIs $50k-75k, 9819.3% for AGIs $75k-100k, 18542.8% for AGIs $100k-200k, 182917.1% for AGIs over 200k)
Taxable interest for individuals: $20,341 (reported on 66.1% of returns)
This zip code:
$20,341
California:
$2,294
(% of AGI for various income ranges: 129.8% for AGIs below $25k, 250.9% for AGIs $25k-50k, 596.9% for AGIs $50k-75k, 496.7% for AGIs $75k-100k, 1624.4% for AGIs $100k-200k, 26386.2% for AGIs over 200k)
Ordinary dividends: $75,880 (reported on 60.5% of returns)
Here:
$75,880
State:
$10,949
(% of AGI for various income ranges: 305.8% for AGIs below $25k, 768.6% for AGIs $25k-50k, 1750.0% for AGIs $50k-75k, 1493.3% for AGIs $75k-100k, 6056.8% for AGIs $100k-200k, 90175.7% for AGIs over 200k)
Net capital gain/loss in AGI: +$656,830 (reported on 60.3% of returns)
Here:
+$656,830
State:
+$49,306
(% of AGI for various income ranges: 217.8% for AGIs below $25k, 465.9% for AGIs $25k-50k, 1010.0% for AGIs $50k-75k, 1451.3% for AGIs $75k-100k, 4475.6% for AGIs $100k-200k, 864608.1% for AGIs over 200k)
Profit/loss from business: +$48,862 (reported on 29.4% of returns)
Here:
+$48,862
State:
+$15,671
(% of AGI for various income ranges: 428.0% for AGIs below $25k, 930.9% for AGIs $25k-50k, 1636.2% for AGIs $50k-75k, 1516.0% for AGIs $75k-100k, 3335.6% for AGIs $100k-200k, 23552.9% for AGIs over 200k)
Taxable individual retirement arrangement distribution: $61,135 (reported on 17.5% of returns)
93108:
$61,135
California:
$23,505
(% of AGI for various income ranges: 78.5% for AGIs below $25k, 371.4% for AGIs $25k-50k, 822.5% for AGIs $50k-75k, 1025.3% for AGIs $75k-100k, 3968.4% for AGIs $100k-200k, 16958.6% for AGIs over 200k)
Self-employed (Keogh) retirement plans: $33,767 (reported on 4.5% of returns)
93108:
$33,767
California:
$30,163
(% of AGI for various income ranges: 102.3% for AGIs $25k-50k, 274.4% for AGIs $100k-200k, 2942.9% for AGIs over 200k)
Total itemized deductions: $102,383 (reported on 40.8% of returns)
Here:
$102,383
State:
$39,517
(% of AGI for various income ranges: 509.8% for AGIs below $25k, 1110.0% for AGIs $25k-50k, 2748.1% for AGIs $50k-75k, 3488.7% for AGIs $75k-100k, 7995.2% for AGIs $100k-200k, 75907.1% for AGIs over 200k)
Charity contributions: $63,467 (reported on 35.4% of returns)
Here:
$63,467
State:
$12,598
(% of AGI for various income ranges: 23.2% for AGIs below $25k, 82.3% for AGIs $25k-50k, 385.6% for AGIs $50k-75k, 440.0% for AGIs $75k-100k, 1425.6% for AGIs $100k-200k, 47129.0% for AGIs over 200k)
Taxes paid: $9,122 (reported on 40.8% of returns)
93108:
$9,122
State:
$8,807
(% of AGI for various income ranges: 108.5% for AGIs below $25k, 227.3% for AGIs $25k-50k, 523.8% for AGIs $50k-75k, 659.3% for AGIs $75k-100k, 1482.8% for AGIs $100k-200k, 5130.0% for AGIs over 200k)
Earned income credit: $1,161 (reported on 3.9% of returns)
Here:
$1,161
State:
$2,074
(% of AGI for various income ranges: 32.2% for AGIs below $25k, 36.4% for AGIs $25k-50k)
Percentage of individuals using paid preparers for their 2020 taxes: 93.3%
Here:
93%
State:
92%
(% for various income ranges: 91.5% for AGIs below $25k, 91.8% for AGIs $25k-50k, 93.0% for AGIs $50k-75k, 94.4% for AGIs $75k-100k, 93.2% for AGIs $100k-200k, 94.8% for AGIs over 200k)
Averages for the 2012 tax year for zip code 93108, filed in 2013:
Average Adjusted Gross Income (AGI) in 2012: $297,281 (Individual Income Tax Returns)
Here:
$297,281
State:
$72,726
Salary/wage: $142,039 (reported on 55.1% of returns)
Here:
$142,039
State:
$59,079
(% of AGI for various income ranges: 51.1% for AGIs below $25k, 55.2% for AGIs $25k-50k, 43.2% for AGIs $50k-75k, 40.9% for AGIs $75k-100k, 34.7% for AGIs $100k-200k, 23.9% for AGIs over 200k)
Taxable interest for individuals: $21,019 (reported on 67.7% of returns)
This zip code:
$21,019
California:
$2,146
(% of AGI for various income ranges: 6.4% for AGIs below $25k, 3.4% for AGIs $25k-50k, 3.5% for AGIs $50k-75k, 3.2% for AGIs $75k-100k, 4.6% for AGIs $100k-200k, 4.9% for AGIs over 200k)
Ordinary dividends: $65,465 (reported on 58.6% of returns)
Here:
$65,465
State:
$9,308
(% of AGI for various income ranges: 16.6% for AGIs below $25k, 9.0% for AGIs $25k-50k, 9.6% for AGIs $50k-75k, 10.7% for AGIs $75k-100k, 12.4% for AGIs $100k-200k, 13.1% for AGIs over 200k)
Net capital gain/loss in AGI: +$127,807 (reported on 57.2% of returns)
Here:
+$127,807
State:
+$30,460
(% of AGI for various income ranges: 2.0% for AGIs below $25k, 2.9% for AGIs $25k-50k, 3.9% for AGIs $50k-75k, 4.9% for AGIs $75k-100k, 10.3% for AGIs $100k-200k, 27.7% for AGIs over 200k)
Profit/loss from business: +$48,503 (reported on 27.6% of returns)
Here:
+$48,503
State:
+$17,064
(% of AGI for various income ranges: 17.3% for AGIs below $25k, 11.7% for AGIs $25k-50k, 9.4% for AGIs $50k-75k, 6.4% for AGIs $75k-100k, 7.4% for AGIs $100k-200k, 3.8% for AGIs over 200k)
Taxable individual retirement arrangement distribution: $62,676 (reported on 21.1% of returns)
93108:
$62,676
California:
$19,557
(% of AGI for various income ranges: 3.1% for AGIs below $25k, 5.6% for AGIs $25k-50k, 7.6% for AGIs $50k-75k, 7.2% for AGIs $75k-100k, 7.9% for AGIs $100k-200k, 3.9% for AGIs over 200k)
Self-employment retirement plans: $28,100 (reported on 4.4% of returns)
93108:
$28,100
California:
$24,530
(% of AGI for various income ranges: 1.6% for AGIs $50k-75k, 0.6% for AGIs $100k-200k, 0.4% for AGIs over 200k)
Total itemized deductions: $104,898 (23% of AGI, reported on 63.1% of returns)
Here:
$104,898
State:
$34,004
Here:
23.3% of AGI
State:
22.7% of AGI
(% of AGI for various income ranges: 45.3% for AGIs below $25k, 26.9% for AGIs $25k-50k, 28.9% for AGIs $50k-75k, 30.9% for AGIs $75k-100k, 30.9% for AGIs $100k-200k, 20.7% for AGIs over 200k)
Charity contributions: $24,603 (reported on 55.5% of returns)
Here:
$24,603
State:
$4,659
(% of AGI for various income ranges: 1.9% for AGIs below $25k, 1.9% for AGIs $25k-50k, 2.4% for AGIs $50k-75k, 3.5% for AGIs $75k-100k, 3.7% for AGIs $100k-200k, 4.8% for AGIs over 200k)
Taxes paid: $50,344 (reported on 62.9% of returns)
93108:
$50,344
State:
$14,448
(% of AGI for various income ranges: 13.8% for AGIs below $25k, 6.6% for AGIs $25k-50k, 10.2% for AGIs $50k-75k, 10.3% for AGIs $75k-100k, 11.8% for AGIs $100k-200k, 10.6% for AGIs over 200k)
Earned income credit: $1,186 (reported on 4.4% of returns)
Here:
$1,186
State:
$2,286
(% of AGI for various income ranges: 1.5% for AGIs below $25k, 0.3% for AGIs $25k-50k)
Percentage of individuals using paid preparers for their 2012 taxes: 77.8%
Here:
78%
State:
64%
(% for various income ranges: 65.8% for AGIs below $25k, 68.7% for AGIs $25k-50k, 72.7% for AGIs $50k-75k, 77.1% for AGIs $75k-100k, 83.1% for AGIs $100k-200k, 92.2% for AGIs over 200k)
Averages for the 2004 tax year for zip code 93108, filed in 2005:
Average Adjusted Gross Income (AGI) in 2004: $252,627 (Individual Income Tax Returns)
Here:
$252,627
State:
$58,600
Salary/wage: $112,101 (reported on 53.7% of returns)
Here:
$112,101
State:
$49,455
(% of AGI for various income ranges: 47.0% for AGIs $10k-25k, 53.6% for AGIs $25k-50k, 45.4% for AGIs $50k-75k, 37.6% for AGIs $75k-100k, 20.9% for AGIs over 100k)
Taxable interest for individuals: $21,048 (reported on 71.2% of returns)
This zip code:
$21,048
California:
$2,365
(% of AGI for various income ranges: 7.9% for AGIs $10k-25k, 6.2% for AGIs $25k-50k, 6.8% for AGIs $50k-75k, 6.5% for AGIs $75k-100k, 5.5% for AGIs over 100k)
Taxable dividends: $38,808 (reported on 62.3% of returns)
Here:
$38,808
State:
$4,746
(% of AGI for various income ranges: 11.0% for AGIs $10k-25k, 8.5% for AGIs $25k-50k, 9.7% for AGIs $50k-75k, 11.3% for AGIs $75k-100k, 8.9% for AGIs over 100k)
Net capital gain/loss: +$168,595 (reported on 58.9% of returns)
Here:
+$168,595
State:
+$23,418
(% of AGI for various income ranges: 2.1% for AGIs $10k-25k, 3.7% for AGIs $25k-50k, 4.7% for AGIs $50k-75k, 7.7% for AGIs $75k-100k, 40.4% for AGIs over 100k)
Profit/loss from business: +$44,830 (reported on 28.3% of returns)
Here:
+$44,830
State:
+$16,826
(% of AGI for various income ranges: 16.8% for AGIs $10k-25k, 11.6% for AGIs $25k-50k, 8.9% for AGIs $50k-75k, 10.4% for AGIs $75k-100k, 4.3% for AGIs over 100k)
IRA payment deduction: $3,891 (reported on 3.9% of returns)
93108:
$3,891
California:
$3,192
(% of AGI for various income ranges: 0.5% for AGIs $10k-25k, 0.4% for AGIs $25k-50k, 0.4% for AGIs $50k-75k, 0.3% for AGIs $75k-100k, 0.0% for AGIs over 100k)
Self-employed pension: $29,551 (reported on 4.7% of returns)
Here:
$29,551
California:
$17,688
(% of AGI for various income ranges: 0.3% for AGIs $25k-50k, 0.5% for AGIs $50k-75k, 0.5% for AGIs $75k-100k, 0.5% for AGIs over 100k)
Total itemized deductions: $93,264 (22% of AGI, reported on 59.1% of returns)
Here:
$93,264
State:
$28,113
Here:
22.0% of AGI
State:
25.3% of AGI
(% of AGI for various income ranges: 38.5% for AGIs $10k-25k, 33.8% for AGIs $25k-50k, 32.6% for AGIs $50k-75k, 34.7% for AGIs $75k-100k, 19.9% for AGIs over 100k)
Charity contributions deductions: $21,426 (5% of AGI, reported on 54.1% of returns)
Here:
$21,426
State:
$3,923
Here:
5.0% of AGI
State:
3.3% of AGI
(% of AGI for various income ranges: 2.3% for AGIs $10k-25k, 3.0% for AGIs $25k-50k, 3.2% for AGIs $50k-75k, 3.8% for AGIs $75k-100k, 4.5% for AGIs over 100k)
Total tax: $59,178 (reported on 80.6% of returns)
93108:
$59,178
State:
$10,761
(% of AGI for various income ranges: 6.7% for AGIs $10k-25k, 8.7% for AGIs $25k-50k, 9.4% for AGIs $50k-75k, 10.6% for AGIs $75k-100k, 19.0% for AGIs over 100k)
Earned income credit: $830 (reported on 4.4% of returns)
Here:
$830
State:
$1,763
Percentage of individuals using paid preparers for their 2004 taxes: 77.4%
Here:
77%
State:
66%
(% for various income ranges: 68.9% for AGIs below $10k, 67.8% for AGIs $10k-25k, 68.1% for AGIs $25k-50k, 76.2% for AGIs $50k-75k, 78.9% for AGIs $75k-100k, 89.4% for AGIs over 100k)
Likely homosexual households (counted as self-reported same-sex unmarried-partner households)
Lesbian couples: 0.2% of all households
Gay men: 0.4% of all households
Household received Food Stamps/SNAP in the past 12 months: 44 Household did not receive Food Stamps/SNAP in the past 12 months: 4,500
Women who had a birth in the past 12 months: 101 (87 now married, 14 unmarried) Women who did not have a birth in the past 12 months: 1,885 (599 now married, 1,291 unmarried)
Housing units in zip code 93108 with a mortgage: 1,771 (242 second mortgage, 13 home equity loan, 239 both second mortgage and home equity loan) Houses without a mortgage: 92
Median monthly owner costs for units with a mortgage: $3,876 Median monthly owner costs for units without a mortgage: $1,556
Residents with income below the poverty level in 2022:
This zip code:
6.7%
Whole state:
12.2%
Residents with income below 50% of the poverty level in 2022:
This zip code:
3.0%
Whole state:
6.2%
Median number of rooms in houses and condos:
Here:
7.1
State:
6.0
Median number of rooms in apartments:
Here:
4.8
State:
3.9
Notable locations in this zip code not listed on our city pages
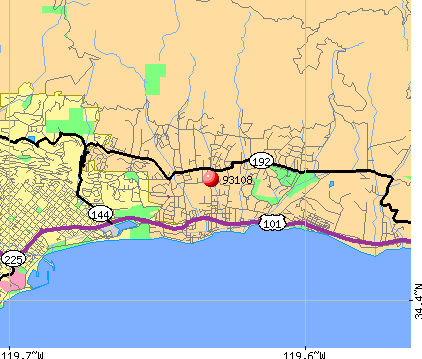
Notable locations in zip code 93108: Hot Springs Club (A), Birnam Wood Golf Club (B), Valley Club (C), La Casa de Maria Conference and Retreat Center (D), Montecito Branch Santa Barbara Public Library (E), Montecito Fire Protection District Station 2 (F), Montecito Fire Protection District Station 1 (G). Display/hide their locations on the map
Shopping Centers: Plaza del Sol Shopping Center (1), Montecito Village Shopping Center (2), Coast Village Shopping Center (3). Display/hide their locations on the map
Churches in zip code 93108 include: Montecito Covenant Church (A), All Saints by the Sea Episcopal Church (B), El Montecito Presbyterian Church (C), Our Lady of Mount Carmel Church (D). Display/hide their locations on the map
Creeks: San Ysidro Creek (A), Oak Creek (B), Garrapata Creek (C), Romero Creek (D), Hot Springs Creek (E), Montecito Creek (F), Picay Creek (G). Display/hide their locations on the map
1,055 married couples with children.
188 single-parent households (45 men, 143 women).
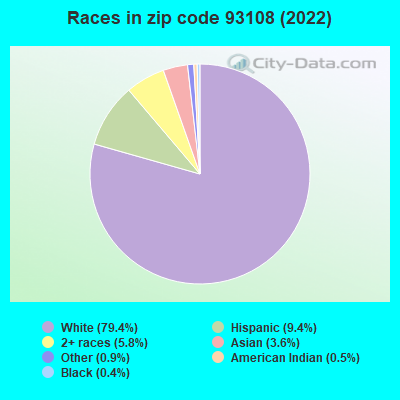
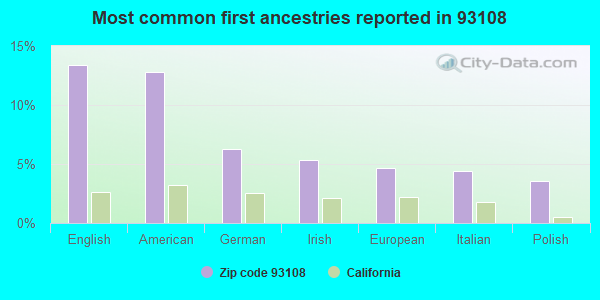
87.7% of residents of 93108 zip code speak English at home.
4.4% of residents speak Spanish at home (69% very well, 12% well, 10% not well, 8% not at all).
7.0% of residents speak other Indo-European language at home (86% very well, 14% well).
1.7% of residents speak Asian or Pacific Island language at home (82% very well, 18% well).
0.1% of residents speak other language at home (100% very well).
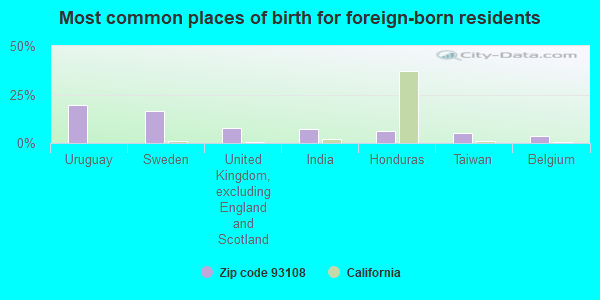
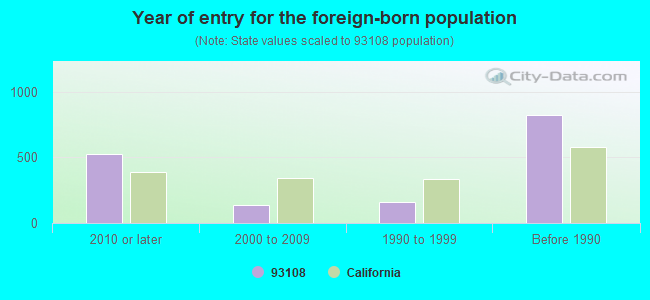
Foreign born population: 1,317 (11.9%) (76.7% of them are naturalized citizens)
Facilities with environmental interests located in this zip code:
EQUILON ENTERPRISES (1000 COAST VILLAGE in MONTECITO, CA) . Federal Facility
STATE MASTER (California - Hazardous Waste Tracking) - HAZARDOU WASTE PROGRAM Large Quantity Generators, more that 1000 kg of hazardous waste/month (Resource Conservation and Recovery Act (tracking hazardous waste)) Organizations: SHELL OIL PRODUCTS US (CONTACT/OPERATOR)
, EQUILON ENTERPRISES LLC DBA SHELL OIL PR (CONTACT/OWNER)
Alternative names: SHELL OIL CO
CHEVRON STATION NO 91789 (1476 E VALLEY RD in SANTA BARBARA, CA)
Large Quantity Generators, more that 1000 kg of hazardous waste/month (Resource Conservation and Recovery Act (tracking hazardous waste)) STATE MASTER (California - Used Oil Recycling System ) - USED OIL RECYCLING Organizations: CHEVRON PRODUCTS CO. (CONTACT/OPERATOR)
Alternative names: R J JENSEN, R J JENSEN CHEVRON SERVICE
CHEVRON STATION 91572 (1085 COAST VILLAGE RD in SANTA BARBARA, CA)
STATE MASTER (California - Hazardous Waste Tracking) - HAZARDOU WASTE PROGRAM Small Quantity Generators, between 100 kg and 1000 kg of hazardous waste/month (Resource Conservation and Recovery Act (tracking hazardous waste)) - notification Organizations: CHEVRON PRODUCTS CO (CONTACT/OWNER)
CASA DEL HERRARO FOUNDATION (1387 E VALLEY RD in MONTECITO, CA)
STATE MASTER (California - Hazardous Waste Tracking) - HAZARDOU WASTE PROGRAM Small Quantity Generators, between 100 kg and 1000 kg of hazardous waste/month (Resource Conservation and Recovery Act (tracking hazardous waste)) - notification
MONTECITO ELEMENTARY (385 SAN YSIDRO ROAD in SANTA BARBARA, CA)
(National Center for Education Statistics) - STATE ID-6045728 Organizations: MONTECITO UNION ELEMENTARY (SCHOOL DISTRICT)
JOSTENS INC (2111 ORTEGA HILL RD in SANTA BARBARA, CA)
CRITERIA AND HAZARDOUS AIR POLLUTANT INVENTORY (Inventory of air pollution sources) Large Quantity Generators, more that 1000 kg of hazardous waste/month (Resource Conservation and Recovery Act (tracking hazardous waste)) TRI REPORTER (Tracking of toxic chemicals releasing facilities) Business SIC classification: JEWELRY, PRECIOUS METAL Business NAICS classification: JEWELRY (EXCEPT COSTUME) MANUFACTURING.
BAGDASARIAN PRODUCTS (1192 E MOUNTAIN DR in MONTECITO, CA)
(Resource Conservation and Recovery Act (tracking hazardous waste)) Organizations: ROSS BAGDASARIAN (CONTACT/OWNER)
GREKA ENERGY-CAT CANYON-UCB LEASE (CAT CANYON FIELD LOCATIONS 5 MILES SE OF in MONTECITO, CA)
AIR MAJOR (AIRS/AFS) CRITERIA AND HAZARDOUS AIR POLLUTANT INVENTORY (Inventory of air pollution sources) Business SIC classification: CRUDE PETROLEUM AND NATURAL GAS Alternative names: UCB LEASE GREKA ENERGY
MONTECITO WWTP (910 CHANNEL DR in SANTA BARBARA, CA)
National Pollutant Discharge Elimination System MAJOR (Tracking pollutant discharge elimination systems) - permit Business SIC classification: SEWERAGE SYSTEMS Organizations: MONTECITO SANITARY DISTRICT (CONTACT/OWNER)
Alternative names: MONTECITO SANITARY DISTRICT
MONTECITO VALLEY RANCH LF (124 SHEFFIELD DR in MONTECITO, CA)
CRITERIA AND HAZARDOUS AIR POLLUTANT INVENTORY (Inventory of air pollution sources) Business SIC classification: REFUSE SYSTEMS Business NAICS classification: SOLID WASTE LANDFILL.
Housing units lacking complete plumbing facilities: 1.8% Housing units lacking complete kitchen facilities: 2.0%
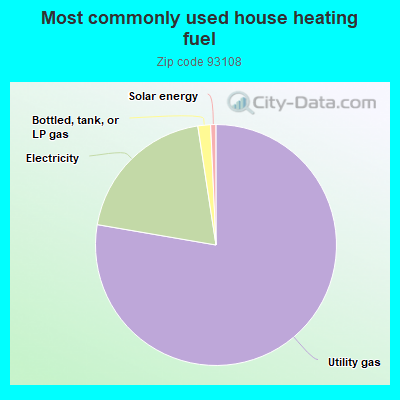
77.4%Utility gas
19.8%Electricity
1.7%Bottled, tank, or LP gas
0.7%Solar energy
Population in 1990: 12,923.
Place of birth for U.S.-born residents:
This state: 5,155
Northeast: 1,506
Midwest: 1,215
South: 746
West: 770
53% of the 93108 zip code residents lived in the same house 5 years ago. Out of people who lived in different houses, 48% lived in this county. Out of people who lived in different counties, 50% lived in California.
87% of the 93108 zip code residents lived in the same house 1 year ago. Out of people who lived in different houses, 46% moved from this county. Out of people who lived in different houses, 26% moved from different county within same state. Out of people who lived in different houses, 27% moved from different state. Out of people who lived in different houses, 0% moved from abroad.
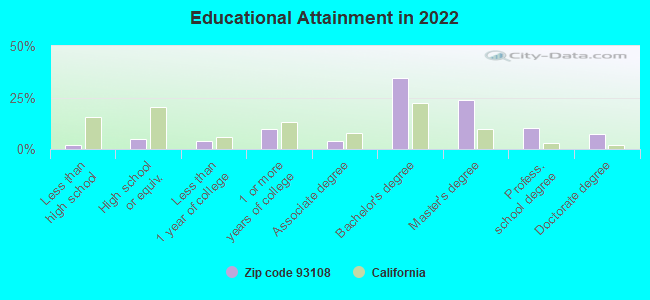
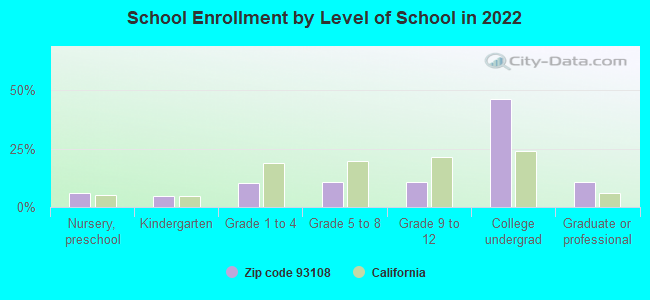
Private vs. public school enrollment:
Students in private schools in grades 1 to 8 (elementary and middle school): 84
Here:
13.7%
California:
10.5%
Students in private schools in grades 9 to 12 (high school): 67
Here:
21.4%
California:
8.5%
Students in private undergraduate colleges: 667
Here:
49.1%
California:
15.9%
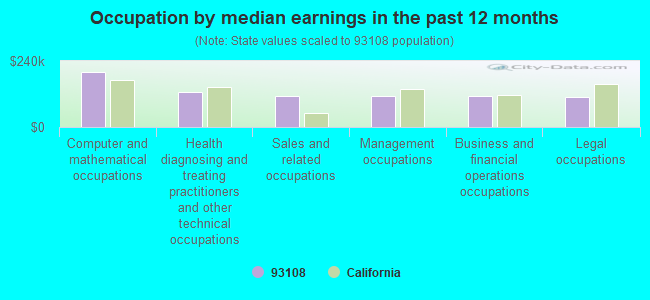
Occupation by median earnings in the past 12 months ($)
199,024Computer and mathematical occupations
127,663Health diagnosing and treating practitioners and other technical occupations
113,909Sales and related occupations
113,609Management occupations
112,958Business and financial operations occupations
109,904Legal occupations
Companies with federal contracts located in this zip code:
CU ENTERPRISES LTD (1187 COAST VILLAGE RD STE in SANTA BARBARA, CA; small business) : $6,433,305 in 378 contractsfrom 2000 to 2006
Contracts for Helicopter Rotor Blades, Drive Mechanisms and Components, Vehicular Power Transmission Components, Degaussing and Mine Sweeping Equipment, Engine Fuel System Components, Aircraft and Missile Prime Movers, and moreby Air Force, Army, Defense Logistics Agency, Navy, and others Signed by year:2000: $231,823; 2001: $629,992; 2002: $873,715; 2003: $389,785; 2004: $761,735; 2005: $2,576,583; 2006: $969,672.
Biggest contracts:
$180,576 with Air Force for Helicopter Rotor Blades, Drive Mechanisms and Components. Signed on 2005-07-21. Completion date: 2005-10-31.
$176,400 with Army for Vehicular Power Transmission Components. Signed on 2002-12-13. Completion date: 2003-06-16.
$136,066 with Defense Logistics Agency for Degaussing and Mine Sweeping Equipment. Signed on 2004-02-10. Completion date: 2004-05-20.
$103,370 with Army for Engine Fuel System Components, Aircraft and Missile Prime Movers. Signed on 2005-10-19. Completion date: 2005-12-18.
ADIZES INSTITUTE, LLC (2815 E VALLEY RD in SANTA BARBARA, CA; small business) : $1,351,600 in 14 contractsfrom 2002 to 2004
Contracts for Other Professional Services by Navy Signed by year:2000: $0; 2001: $0; 2002: $401,000; 2003: $656,227; 2004: $294,373; 2005: $0; 2006: $0.
Biggest contracts:
$193,000 with Navy for Other Professional Services. Signed on 2002-06-14. Completion date: 2002-09-30.
$190,000, same as above.Signed on 2003-04-09. Completion date: 2002-12-31.
$180,000, same as above.Signed on 2003-06-13. Completion date: 2002-12-31.
$158,000, same as above.Signed on 2002-10-18. Completion date: 2002-12-31.
SCITRAN COMPANY (1482 E VALLEY RD STE 15 in SANTA BARBARA, CA; small business) : $440,832 in 13 contractsfrom 2000 to 2006
Contracts for Translation and Interpreting Services(Including Sign Language), Miscellaneous Items by Air Force, Army Signed by year:2000: $70,000; 2001: $80,000; 2002: $30,000; 2003: $102,000; 2004: $50,000; 2005: $48,832; 2006: $60,000.
Biggest contracts:
$50,000 with Air Force for Translation and Interpreting Services(Including Sign Language). Signed on 2004-12-07. Completion date: 2005-07-30.
$45,000, same as above.Signed on 2003-08-26. Completion date: 2005-07-30.
$45,000, same as above.Signed on 2001-09-14. Completion date: 2005-07-30.
$40,000, same as above.Signed on 2006-01-27. Completion date: 2012-08-31.
AIC INTERNATIONAL MARKETING CO (1170 MESA ROAD in MONTECITO, CA; small business) : $387,328 in 7 contractsfrom 2000 to 2005
Contracts for Food Items For Resale by Department of Defense, Defense Commissary Agency Signed by year:2000: $46,725; 2001: $205,453; 2002: $0; 2003: $26,005; 2004: $82,308; 2005: $26,837; 2006: $0.
Biggest contracts:
$205,453 with Department of Defense for Food Items For Resale. Signed on 2001-07-01. Completion date: 2001-05-31.
$53,928 with Defense Commissary Agency for Food Items For Resale. Signed on 2004-10-01. Completion date: 2005-02-28.
$46,725 with Department of Defense for Food Items For Resale. Signed on 2000-10-01. Completion date: 2000-10-31.
$28,380 with Defense Commissary Agency for Food Items For Resale. Signed on 2004-10-01. Completion date: 2005-02-28.
MICHAEL GARRIGAN / DEANNA TIMM (445 NICKELS LN in SANTA BARBARA, CA; small business) : $113,717 in 18 contractsfrom 2002 to 2003
Contracts for Lease or Rental of Facilities -- Office Buildings by Public Buildings Service Signed by year:2000: $0; 2001: $0; 2002: $20,300; 2003: $93,417; 2004: $0; 2005: $0; 2006: $0.
Biggest contracts:
$13,314 with Public Buildings Service for Lease or Rental of Facilities -- Office Buildings. Signed on 2003-09-15. Completion date: 2003-09-15.
$13,314, same as above.Signed on 2003-06-15. Completion date: 2003-06-15.
$10,150, same as above.Signed on 2003-03-15. Completion date: 2003-03-15.
$10,150, same as above.Signed on 2002-12-15. Completion date: 2002-12-15.
ROSS H ILES (1696 SAN LEANDRO LN in SANTA BARBARA, CA; small business) : $33,000 in 4 contractsfrom 2002 to 2005
$8,250 with Army for Custodial Janitorial Services. Taking place in KS. Signed on 2005-02-24. Completion date: 2003-10-06.
$8,250 with U.S. Army Corps of Engineers - civil program financing only for Custodial Janitorial Services. Taking place in KS. Signed on 2004-02-24. Completion date: 2003-10-06.
$8,250 with Army for Custodial Janitorial Services. Taking place in KS. Signed on 2004-02-24. Completion date: 2003-10-06.
$8,250 with U.S. Army Corps of Engineers - civil program financing only for Custodial Janitorial Services. Taking place in KS. Signed on 2002-01-14. Completion date: 2002-01-23.
CORPS CLASSICS (520 EL BOSQUE RD in SANTA BARBARA, CA; small business) : $7,112 in 2 contractsfrom 2003 to 2005
$3,585 with Navy for Clothing, Special Purpose. Signed on 2003-07-23. Completion date: 2003-08-06.
$3,527 with Navy for Kitchen Equipment and Appliances. Signed on 2005-07-11. Completion date: 2005-08-15.
MONTECITO SPORTS (1046 COAST VILLAGE RD STE in SANTA BARBARA, CA; small business)
$2,848 with Air Force for Athletic and Sporting Equipment. Signed on 2005-09-30. Completion date: 2005-10-21.
Top industries in this zip code by the number of employees in 2005:
Educational Services: Colleges, Universities, and Professional Schools (500-999 employees: 1 establishment, 250-499 employees: 1 establishment)
Accommodation and Food Services: Hotels (except Casino Hotels) and Motels (500-999: 1, 20-49: 1, 10-19: 1, 1-4: 1)
2004 - 2018 National Fire Incident Reporting System (NFIRS) incidents
According to the data from the years 2004 - 2018 the average number of fire incidents per year is 13. The highest number of reported fire incidents - 43 took place in 2005, and the least - 0 in 2010. The data has an increasing trend.
When looking into fire subcategories, the most incidents belonged to: Outside Fires (44.6%), and Structure Fires (30.1%).
Fire incident types reported to NFIRS in Zip Code 93108


 Nearest zip codes: 93067, 93103, 93101, 93013, 93109, 93110.
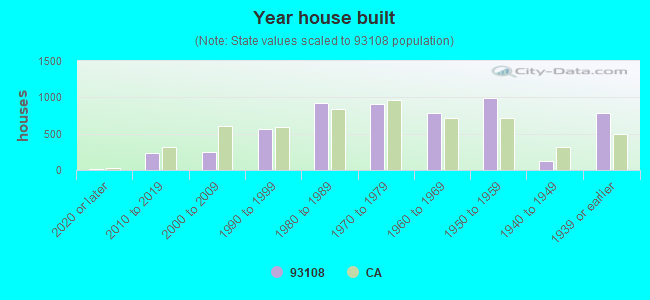


 . Federal Facility
 According to the data from the years 2004 - 2018 the average number of fire incidents per year is 13. The highest number of reported fire incidents - 43 took place in 2005, and the least - 0 in 2010. The data has an increasing trend.
 When looking into fire subcategories, the most incidents belonged to: Outside Fires (44.6%), and Structure Fires (30.1%).