Estimated zip code population in 2022: 19,489 Zip code population in 2010: 20,249 Zip code population in 2000: 20,877
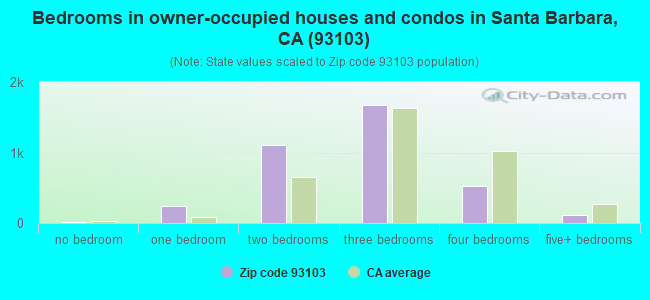
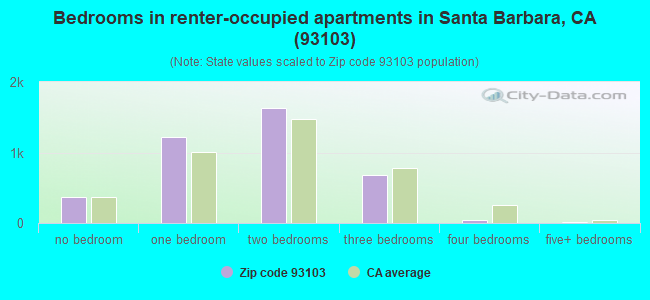
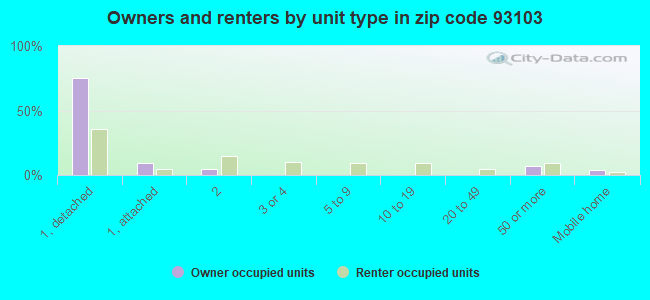
Houses and condos: 8,082 Renter-occupied apartments: 3,949
% of renters here:
52%
State:
44%
March 2022 cost of living index in zip code 93103: 119.4 (more than average, U.S. average is 100)
Land area: 5.2 sq. mi. Water area: 0.1 sq. mi.
Population density: 3,720 people per square mile
(average).
OSM Map
General Map
Google Map
MSN Map
OSM Map
General Map
Google Map
MSN Map
OSM Map
General Map
Google Map
MSN Map
OSM Map
General Map
Google Map
MSN Map
Please wait while loading the map...
Real estate property taxes paid for housing units in 2022:
This zip code:
0.5% ($6,966)
California:
0.7% ($4,831)
Median real estate property taxes paid for housing units with mortgages in 2022: $8,549 (0.6%) Median real estate property taxes paid for housing units with no mortgage in 2022: $4,729 (0.4%)
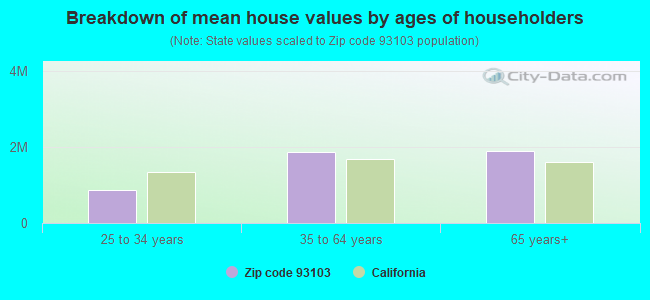
Estimated median house/condo value in 2022: $1,446,785
93103:
$1,446,785
California:
$715,900
According to our research of California and other state lists, there were 31 registered sex offenders living in 93103 zip code as of April 27, 2024. The ratio of all residents to sex offenders in zip code 93103 is 681 to 1. The ratio of registered sex offenders to all residents in this zip code is near the state average.
Median resident age:
This zip code:
40.7 years
California median age:
37.9 years
Average household size:
This zip code:
2.5 people
California:
2.8 people
Averages for the 2020 tax year for zip code 93103, filed in 2021:
Average Adjusted Gross Income (AGI) in 2020: $107,157 (Individual Income Tax Returns)
Here:
$107,157
State:
$95,910
Salary/wage: $69,801 (reported on 78.7% of returns)
Here:
$69,801
State:
$77,331
(% of AGI for various income ranges: 1420.0% for AGIs below $25k, 4454.7% for AGIs $25k-50k, 7643.3% for AGIs $50k-75k, 11936.4% for AGIs $75k-100k, 20601.6% for AGIs $100k-200k, 121035.9% for AGIs over 200k)
Taxable interest for individuals: $3,444 (reported on 31.5% of returns)
This zip code:
$3,444
California:
$2,294
(% of AGI for various income ranges: 20.5% for AGIs below $25k, 32.7% for AGIs $25k-50k, 59.3% for AGIs $50k-75k, 107.7% for AGIs $75k-100k, 357.0% for AGIs $100k-200k, 3980.6% for AGIs over 200k)
Ordinary dividends: $15,438 (reported on 24.2% of returns)
Here:
$15,438
State:
$10,949
(% of AGI for various income ranges: 56.8% for AGIs below $25k, 79.5% for AGIs $25k-50k, 189.8% for AGIs $50k-75k, 372.8% for AGIs $75k-100k, 1255.0% for AGIs $100k-200k, 14090.6% for AGIs over 200k)
Net capital gain/loss in AGI: +$72,923 (reported on 24.1% of returns)
Here:
+$72,923
State:
+$49,306
(% of AGI for various income ranges: 45.0% for AGIs below $25k, 43.1% for AGIs $25k-50k, 173.2% for AGIs $50k-75k, 272.8% for AGIs $75k-100k, 1323.2% for AGIs $100k-200k, 94390.6% for AGIs over 200k)
Profit/loss from business: +$21,144 (reported on 20.8% of returns)
Here:
+$21,144
State:
+$15,671
(% of AGI for various income ranges: 313.4% for AGIs below $25k, 357.5% for AGIs $25k-50k, 458.8% for AGIs $50k-75k, 566.0% for AGIs $75k-100k, 1472.1% for AGIs $100k-200k, 10329.4% for AGIs over 200k)
Taxable individual retirement arrangement distribution: $27,791 (reported on 8.0% of returns)
93103:
$27,791
California:
$23,505
(% of AGI for various income ranges: 56.8% for AGIs below $25k, 71.7% for AGIs $25k-50k, 157.2% for AGIs $50k-75k, 570.2% for AGIs $75k-100k, 998.9% for AGIs $100k-200k, 5862.9% for AGIs over 200k)
Self-employed (Keogh) retirement plans: $28,847 (reported on 1.5% of returns)
93103:
$28,847
California:
$30,163
(% of AGI for various income ranges: 17.0% for AGIs $25k-50k, 130.4% for AGIs $100k-200k, 1957.1% for AGIs over 200k)
Total itemized deductions: $55,116 (reported on 14.4% of returns)
Here:
$55,116
State:
$39,517
(% of AGI for various income ranges: 161.4% for AGIs below $25k, 193.5% for AGIs $25k-50k, 405.6% for AGIs $50k-75k, 1019.8% for AGIs $75k-100k, 2554.5% for AGIs $100k-200k, 29052.4% for AGIs over 200k)
Charity contributions: $15,570 (reported on 11.9% of returns)
Here:
$15,570
State:
$12,598
(% of AGI for various income ranges: 6.1% for AGIs below $25k, 10.8% for AGIs $25k-50k, 40.7% for AGIs $50k-75k, 120.6% for AGIs $75k-100k, 368.2% for AGIs $100k-200k, 8797.1% for AGIs over 200k)
Taxes paid: $8,730 (reported on 14.4% of returns)
93103:
$8,730
State:
$8,807
(% of AGI for various income ranges: 28.5% for AGIs below $25k, 40.8% for AGIs $25k-50k, 96.4% for AGIs $50k-75k, 268.5% for AGIs $75k-100k, 709.1% for AGIs $100k-200k, 3011.2% for AGIs over 200k)
Earned income credit: $1,766 (reported on 10.7% of returns)
Here:
$1,766
State:
$2,074
(% of AGI for various income ranges: 71.4% for AGIs below $25k, 47.0% for AGIs $25k-50k)
Percentage of individuals using paid preparers for their 2020 taxes: 91.7%
Here:
92%
State:
92%
(% for various income ranges: 88.1% for AGIs below $25k, 91.2% for AGIs $25k-50k, 93.1% for AGIs $50k-75k, 93.2% for AGIs $75k-100k, 95.3% for AGIs $100k-200k, 95.6% for AGIs over 200k)
Averages for the 2012 tax year for zip code 93103, filed in 2013:
Average Adjusted Gross Income (AGI) in 2012: $70,702 (Individual Income Tax Returns)
Here:
$70,702
State:
$72,726
Salary/wage: $51,028 (reported on 81.1% of returns)
Here:
$51,028
State:
$59,079
(% of AGI for various income ranges: 79.8% for AGIs below $25k, 83.3% for AGIs $25k-50k, 77.0% for AGIs $50k-75k, 72.4% for AGIs $75k-100k, 57.9% for AGIs $100k-200k, 39.6% for AGIs over 200k)
Taxable interest for individuals: $2,994 (reported on 31.6% of returns)
This zip code:
$2,994
California:
$2,146
(% of AGI for various income ranges: 1.0% for AGIs below $25k, 0.7% for AGIs $25k-50k, 1.2% for AGIs $50k-75k, 1.0% for AGIs $75k-100k, 1.7% for AGIs $100k-200k, 1.5% for AGIs over 200k)
Ordinary dividends: $13,984 (reported on 20.4% of returns)
Here:
$13,984
State:
$9,308
(% of AGI for various income ranges: 2.1% for AGIs below $25k, 1.4% for AGIs $25k-50k, 2.3% for AGIs $50k-75k, 2.5% for AGIs $75k-100k, 3.9% for AGIs $100k-200k, 6.0% for AGIs over 200k)
Net capital gain/loss in AGI: +$29,670 (reported on 19.8% of returns)
Here:
+$29,670
State:
+$30,460
(% of AGI for various income ranges: 0.8% for AGIs below $25k, 0.3% for AGIs $25k-50k, 1.2% for AGIs $50k-75k, 1.3% for AGIs $75k-100k, 2.6% for AGIs $100k-200k, 17.9% for AGIs over 200k)
Profit/loss from business: +$22,307 (reported on 19.6% of returns)
Here:
+$22,307
State:
+$17,064
(% of AGI for various income ranges: 12.9% for AGIs below $25k, 6.0% for AGIs $25k-50k, 5.7% for AGIs $50k-75k, 4.7% for AGIs $75k-100k, 6.9% for AGIs $100k-200k, 5.1% for AGIs over 200k)
Taxable individual retirement arrangement distribution: $31,930 (reported on 8.8% of returns)
93103:
$31,930
California:
$19,557
(% of AGI for various income ranges: 1.9% for AGIs below $25k, 1.3% for AGIs $25k-50k, 2.5% for AGIs $50k-75k, 3.2% for AGIs $75k-100k, 4.7% for AGIs $100k-200k, 5.4% for AGIs over 200k)
Self-employment retirement plans: $21,271 (reported on 1.6% of returns)
93103:
$21,271
California:
$24,530
(% of AGI for various income ranges: 0.4% for AGIs below $25k, 0.4% for AGIs $50k-75k, 0.5% for AGIs $100k-200k, 0.7% for AGIs over 200k)
Total itemized deductions: $37,508 (23% of AGI, reported on 29.4% of returns)
Here:
$37,508
State:
$34,004
Here:
22.6% of AGI
State:
22.7% of AGI
(% of AGI for various income ranges: 12.6% for AGIs below $25k, 8.9% for AGIs $25k-50k, 13.2% for AGIs $50k-75k, 16.4% for AGIs $75k-100k, 20.5% for AGIs $100k-200k, 16.5% for AGIs over 200k)
Charity contributions: $4,668 (reported on 23.6% of returns)
Here:
$4,668
State:
$4,659
(% of AGI for various income ranges: 0.6% for AGIs below $25k, 0.6% for AGIs $25k-50k, 1.1% for AGIs $50k-75k, 1.3% for AGIs $75k-100k, 1.8% for AGIs $100k-200k, 2.1% for AGIs over 200k)
Taxes paid: $16,548 (reported on 29.3% of returns)
93103:
$16,548
State:
$14,448
(% of AGI for various income ranges: 2.5% for AGIs below $25k, 2.0% for AGIs $25k-50k, 3.6% for AGIs $50k-75k, 5.9% for AGIs $75k-100k, 7.7% for AGIs $100k-200k, 9.8% for AGIs over 200k)
Earned income credit: $1,868 (reported on 13.1% of returns)
Here:
$1,868
State:
$2,286
(% of AGI for various income ranges: 3.3% for AGIs below $25k, 0.8% for AGIs $25k-50k)
Percentage of individuals using paid preparers for their 2012 taxes: 63.5%
Here:
64%
State:
64%
(% for various income ranges: 60.3% for AGIs below $25k, 62.1% for AGIs $25k-50k, 61.7% for AGIs $50k-75k, 63.5% for AGIs $75k-100k, 69.8% for AGIs $100k-200k, 84.9% for AGIs over 200k)
Averages for the 2004 tax year for zip code 93103, filed in 2005:
Average Adjusted Gross Income (AGI) in 2004: $67,378 (Individual Income Tax Returns)
Here:
$67,378
State:
$58,600
Salary/wage: $47,423 (reported on 78.7% of returns)
Here:
$47,423
State:
$49,455
(% of AGI for various income ranges: 231.7% for AGIs below $10k, 79.7% for AGIs $10k-25k, 83.5% for AGIs $25k-50k, 75.1% for AGIs $50k-75k, 63.2% for AGIs $75k-100k, 40.9% for AGIs over 100k)
Taxable interest for individuals: $3,964 (reported on 42.1% of returns)
This zip code:
$3,964
California:
$2,365
(% of AGI for various income ranges: 15.8% for AGIs below $10k, 1.6% for AGIs $10k-25k, 1.3% for AGIs $25k-50k, 1.9% for AGIs $50k-75k, 2.8% for AGIs $75k-100k, 2.8% for AGIs over 100k)
Taxable dividends: $8,958 (reported on 26.2% of returns)
Here:
$8,958
State:
$4,746
(% of AGI for various income ranges: 18.0% for AGIs below $10k, 2.3% for AGIs $10k-25k, 1.5% for AGIs $25k-50k, 2.3% for AGIs $50k-75k, 3.4% for AGIs $75k-100k, 4.2% for AGIs over 100k)
Net capital gain/loss: +$49,535 (reported on 24.4% of returns)
Here:
+$49,535
State:
+$23,418
(% of AGI for various income ranges: -4.3% for AGIs below $10k, 0.4% for AGIs $10k-25k, 0.6% for AGIs $25k-50k, 1.8% for AGIs $50k-75k, 2.8% for AGIs $75k-100k, 28.5% for AGIs over 100k)
Profit/loss from business: +$19,809 (reported on 20.7% of returns)
Here:
+$19,809
State:
+$16,826
(% of AGI for various income ranges: 51.4% for AGIs below $10k, 10.3% for AGIs $10k-25k, 5.8% for AGIs $25k-50k, 6.0% for AGIs $50k-75k, 9.2% for AGIs $75k-100k, 5.0% for AGIs over 100k)
Profit/loss from farming: +$7,062 (reported on 0.2% of returns)
Here:
+$7,062
State:
-$7,562
IRA payment deduction: $3,186 (reported on 3.3% of returns)
93103:
$3,186
California:
$3,192
(% of AGI for various income ranges: 0.3% for AGIs $10k-25k, 0.3% for AGIs $25k-50k, 0.3% for AGIs $50k-75k, 0.3% for AGIs $75k-100k, 0.1% for AGIs over 100k)
Self-employed pension: $17,874 (reported on 2.3% of returns)
Here:
$17,874
California:
$17,688
(% of AGI for various income ranges: 1.8% for AGIs below $10k, 0.2% for AGIs $25k-50k, 0.2% for AGIs $50k-75k, 0.8% for AGIs $75k-100k, 0.8% for AGIs over 100k)
Total itemized deductions: $35,129 (22% of AGI, reported on 31.7% of returns)
Here:
$35,129
State:
$28,113
Here:
22.4% of AGI
State:
25.3% of AGI
(% of AGI for various income ranges: 60.6% for AGIs below $10k, 10.8% for AGIs $10k-25k, 12.6% for AGIs $25k-50k, 17.1% for AGIs $50k-75k, 22.4% for AGIs $75k-100k, 16.9% for AGIs over 100k)
Charity contributions deductions: $5,088 (3% of AGI, reported on 27.9% of returns)
Here:
$5,088
State:
$3,923
Here:
3.0% of AGI
State:
3.3% of AGI
(% of AGI for various income ranges: 2.2% for AGIs below $10k, 0.8% for AGIs $10k-25k, 1.0% for AGIs $25k-50k, 1.4% for AGIs $50k-75k, 2.1% for AGIs $75k-100k, 2.6% for AGIs over 100k)
Total tax: $13,932 (reported on 74.8% of returns)
93103:
$13,932
State:
$10,761
(% of AGI for various income ranges: 12.9% for AGIs below $10k, 4.7% for AGIs $10k-25k, 7.4% for AGIs $25k-50k, 10.4% for AGIs $50k-75k, 11.7% for AGIs $75k-100k, 19.8% for AGIs over 100k)
Earned income credit: $1,492 (reported on 11.9% of returns)
Here:
$1,492
State:
$1,763
Percentage of individuals using paid preparers for their 2004 taxes: 68.5%
Here:
69%
State:
66%
(% for various income ranges: 63.3% for AGIs below $10k, 68.4% for AGIs $10k-25k, 66.6% for AGIs $25k-50k, 67.2% for AGIs $50k-75k, 71.6% for AGIs $75k-100k, 80.2% for AGIs over 100k)
Likely homosexual households (counted as self-reported same-sex unmarried-partner households)
Lesbian couples: 0.0% of all households
Gay men: 0.2% of all households
Household received Food Stamps/SNAP in the past 12 months: 788 Household did not receive Food Stamps/SNAP in the past 12 months: 6,827
Women who had a birth in the past 12 months: 126 (79 now married, 47 unmarried) Women who did not have a birth in the past 12 months: 4,212 (1,698 now married, 2,513 unmarried)
Housing units in zip code 93103 with a mortgage: 2,213 (165 second mortgage, 8 home equity loan, 163 both second mortgage and home equity loan) Houses without a mortgage: 17
Median monthly owner costs for units with a mortgage: $3,746 Median monthly owner costs for units without a mortgage: $950
Residents with income below the poverty level in 2022:
This zip code:
10.6%
Whole state:
12.2%
Residents with income below 50% of the poverty level in 2022:
This zip code:
4.9%
Whole state:
6.2%
Median number of rooms in houses and condos:
Here:
5.8
State:
6.0
Median number of rooms in apartments:
Here:
3.8
State:
3.9
Notable locations in this zip code not listed on our city pages
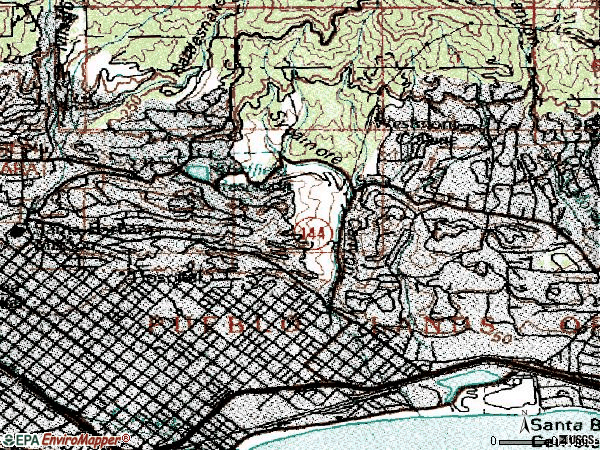
Notable locations in zip code 93103: Santa Barbara County Bowl (A), Montecito Country Club (B), Santa Barbara Chamber of Commerce (C), La Casa de la Raza (D), Eastside Branch Santa Barbara Public Library (E), Pine Hall (F), East Side Social Center Catholic Welfare Bureau (G), Sea Center Marine Museum (H), Santa Barbara City Fire Department Station 7 (I), Santa Barbara City Fire Department Station 2 (J), Cabrillo Pavillion (K). Display/hide their locations on the map
Churches in zip code 93103 include: Friendship Missionary Baptist Church (A), Saint Paul African Methodist Episcopal Church (B), United Pentecostal Church (C), First Southern Baptist Church (D), New Covenant Worship Center (E), Our Lady of Guadalupe Church (F), Santa Barbara Buddhist Church (G), Asamblea De Dios Templo (H). Display/hide their locations on the map
Parks in zip code 93103 include: Mission Historical Park (1), Eastside Neighborhood Park (2), Franklin Park (3), Ortega Park (4), Peabody Stadium (5), Santa Barbara Municipal Tennis Court (6), Sunflower Park (7), Andree Clark Bird Refuge (8), Cabrillo Park (9). Display/hide their locations on the map
1,612 married couples with children.
1,138 single-parent households (385 men, 753 women).
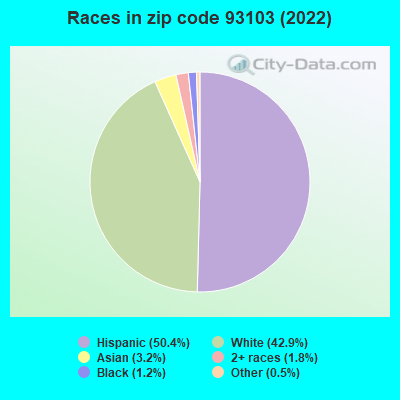
55.2% of residents of 93103 zip code speak English at home.
38.9% of residents speak Spanish at home (57% very well, 14% well, 24% not well, 5% not at all).
3.8% of residents speak other Indo-European language at home (84% very well, 16% well).
1.9% of residents speak Asian or Pacific Island language at home (30% very well, 44% well, 26% not well).
0.1% of residents speak other language at home (100% very well).
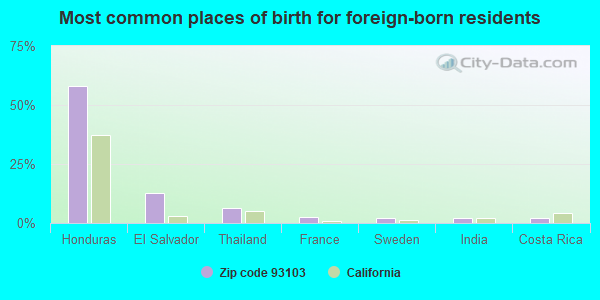
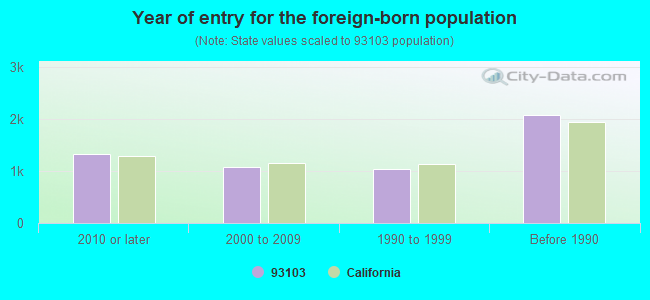
Foreign born population: 5,189 (26.6%) (43.0% of them are naturalized citizens)
Major facilities with environmental interests located in this zip code:
MARBORG CORP DBA MARBORG DISPOSAL CO (136 N QUARANTINA ST in SANTA BARBARA, CA) . Federal Facility
STATE MASTER (California - Hazardous Waste Tracking) - HAZARDOU WASTE PROGRAM TRANSPORTER (Resource Conservation and Recovery Act (tracking hazardous waste)) Organizations: MARBORG CORPORATION (CONTACT/OWNER)
Alternative names: MARBORG DSPL CO
CHANNEL COAST CORPORATION (525 E MICHELTORENA ST NO 101 in SANTA BARBARA, CA)
STATE MASTER (California - Hazardous Waste Tracking) - HAZARDOU WASTE PROGRAM TRANSPORTER (Resource Conservation and Recovery Act (tracking hazardous waste)) - notification
CHEVRON STATION NO 92444 (803 N MILPAS ST in SANTA BARBARA, CA)
STATE MASTER (California - Hazardous Waste Tracking) - HAZARDOU WASTE PROGRAM Small Quantity Generators, between 100 kg and 1000 kg of hazardous waste/month (Resource Conservation and Recovery Act (tracking hazardous waste)) - notification Organizations: CHEVRON PRODUCTS CO (CONTACT/OWNER)
FRANKLIN ELEMENTARY (1111 EAST MASON ST. in SANTA BARBARA, CA)
(National Center for Education Statistics) - STATE ID-6045835 Organizations: SANTA BARBARA ELEMENTARY (SCHOOL DISTRICT)
LA CUESTA CONTINUATION HIGH (905 N. NOPAL in SANTA BARBARA, CA)
(National Center for Education Statistics) - STATE ID-4232690 Organizations: SANTA BARBARA HIGH (SCHOOL DISTRICT)
CESAR ESTRADA CHAVEZ DUAL LANGUAGE IMMERISON CHART (531 E. COTA ST. in SANTA BARBARA, CA)
(National Center for Education Statistics) - STATE ID-6118202 Organizations: SANTA BARBARA ELEMENTARY (SCHOOL DISTRICT)
MCCORMIX CORPORATION (22 NORTH CALLE CESAR CHAVEZ in SANTA BARBARA, CA)
ALL COAST TRUCK & TRACTOR SVC (821 QUINIENTOS ST in SANTA BARBARA, CA)
Small Quantity Generators, between 100 kg and 1000 kg of hazardous waste/month (Resource Conservation and Recovery Act (tracking hazardous waste)) - notification Business NAICS classification: GENERAL AUTOMOTIVE REPAIR. Organizations: MONTE HENDRICKSON (CONTACT/OWNER)
CHANNEL CITY AUTO BODY (611 E GUTIERREZ ST in SANTA BARBARA, CA)
Small Quantity Generators, between 100 kg and 1000 kg of hazardous waste/month (Resource Conservation and Recovery Act (tracking hazardous waste)) - notification Business NAICS classification: AUTOMOTIVE BODY, PAINT, AND INTERIOR REPAIR AND MAINTENANCE. Organizations: JOSEPH DAHLGREN (CONTACT/OWNER)
CHANNEL DSPL CO INC (725 CACIQUE ST in SANTA BARBARA, CA)
TRANSPORTER (Resource Conservation and Recovery Act (tracking hazardous waste))
A OK MOWER SHOP (14 NORTH MILPAS in SANTA BARBARA, CA)
Small Quantity Generators, between 100 kg and 1000 kg of hazardous waste/month (Resource Conservation and Recovery Act (tracking hazardous waste)) - notification Organizations: A OK MOWER SHOPS INC (CONTACT/OWNER)
EL ESTERO WWTP NPDES (520 E. YANONALI in SANTA BARBARA, CA)
National Pollutant Discharge Elimination System MAJOR (Tracking pollutant discharge elimination systems) - permit Business SIC classification: SEWERAGE SYSTEMS Organizations: SANTA BARBARA CITY PWD (CONTACT/OWNER)
Alternative names: SANTA BARBARA CITY DPW, SANTA BARBARA, CITY OF
JOHN HURLEY AUTOMOTIVE (414 POR LA MAR DR in SANTA BARBARA, CA)
Small Quantity Generators, between 100 kg and 1000 kg of hazardous waste/month (Resource Conservation and Recovery Act (tracking hazardous waste)) Business NAICS classification: GENERAL AUTOMOTIVE REPAIR.
Housing units lacking complete plumbing facilities: 0.1% Housing units lacking complete kitchen facilities: 0.9%
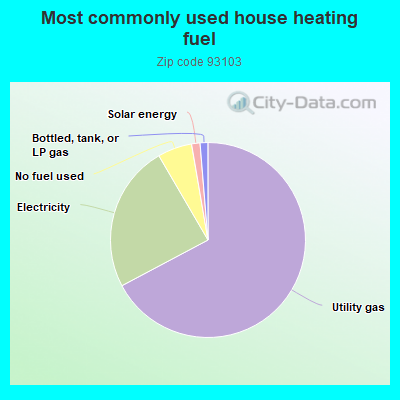
67.3%Utility gas
24.4%Electricity
5.7%No fuel used
1.4%Solar energy
1.3%Bottled, tank, or LP gas
Population in 1990: 18,199. Population change in the 1990s: +2,678 (+14.7%).
Place of birth for U.S.-born residents:
This state: 10,254
Northeast: 968
Midwest: 1,332
South: 800
West: 563
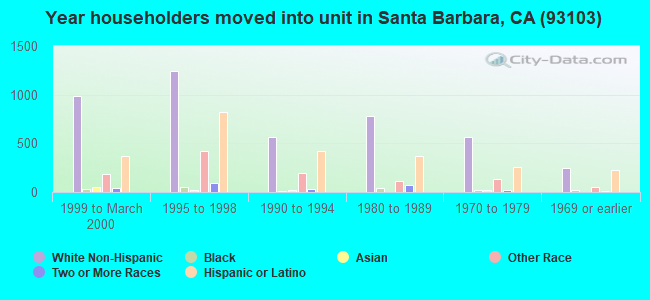
57% of the 93103 zip code residents lived in the same house 5 years ago. Out of people who lived in different houses, 69% lived in this county. Out of people who lived in different counties, 50% lived in California.
86% of the 93103 zip code residents lived in the same house 1 year ago. Out of people who lived in different houses, 49% moved from this county. Out of people who lived in different houses, 28% moved from different county within same state. Out of people who lived in different houses, 19% moved from different state. Out of people who lived in different houses, 4% moved from abroad.
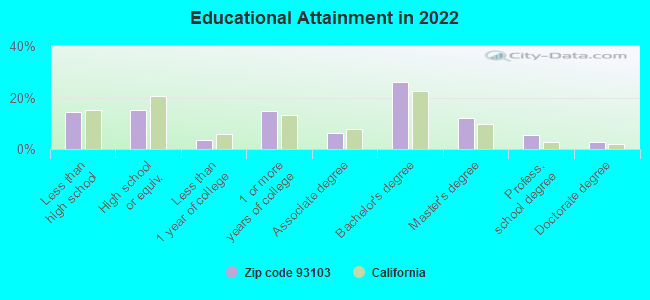
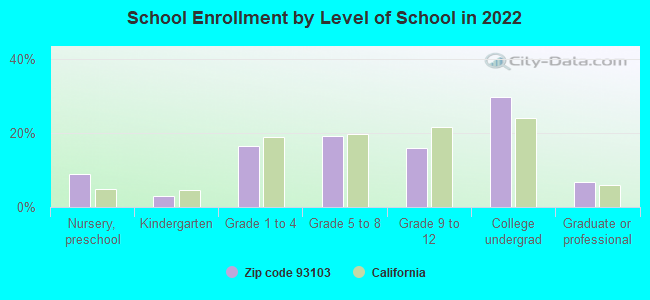
Private vs. public school enrollment:
Students in private schools in grades 1 to 8 (elementary and middle school): 166
Here:
10.8%
California:
10.5%
Students in private schools in grades 9 to 12 (high school): 44
Here:
6.5%
California:
8.5%
Students in private undergraduate colleges: 77
Here:
6.1%
California:
15.9%
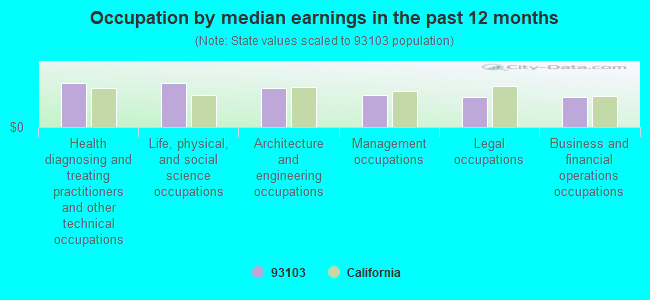
Occupation by median earnings in the past 12 months ($)
117,252Health diagnosing and treating practitioners and other technical occupations
116,157Life, physical, and social science occupations
105,188Architecture and engineering occupations
85,395Management occupations
80,517Legal occupations
80,194Business and financial operations occupations
Companies with federal contracts located in this zip code (SANTA BARBARA, CA):
SANTA BARBARA INFRARED, INC (30 S CALLE CESAR CHAVEZ; small business) : $25,986,315 in 102 contractsfrom 1999 to 2006
Contracts for Services -- Basic Research (R&D), Equipment and Materials Testing -- Instruments and Laboratory Equipment, Weapons -- Advanced Development (R&D), Services -- Applied Research and Exploratory Development (R&D), and moreby Navy, Air Force, Army, Federal Technology Service, and others Signed by year:2000: $1,088,001; 2001: $1,170,868; 2002: $2,459,589; 2003: $2,974,191; 2004: $10,156,532; 2005: $6,172,445; 2006: $1,400,546.
Biggest contracts:
$4,280,438 with Navy for Services -- Basic Research (R&D). Signed on 2004-08-20. Completion date: 2006-09-18.
$2,285,229, same as above.Signed on 2004-12-08. Completion date: 2006-09-30.
$2,279,700, same as above.Signed on 2004-02-19. Completion date: 2006-09-30.
$2,103,419, same as above.Signed on 2005-03-02. Completion date: 2006-09-18.
COMPUTATIONAL SENSORS CORP (201 N CALLE CESAR CHAVEZ S; small business) : $15,750,266 in 53 contractsfrom 2000 to 2006
Contracts for Defense Missile and Space Systems -- Advanced Development (R&D), Engineering -- Applied Research and Exploratory Development (R&D), Other Research and Development -- Advanced Development (R&D), Other Defense -- Applied Research and Exploratory Development (R&D), and moreby Army, Navy, Department of Defense, Defense Advanced Research Projects Agency, and others Signed by year:2000: $2,015,000; 2001: $1,720,736; 2002: $4,409,941; 2003: $1,143,967; 2004: $2,849,545; 2005: $3,511,095; 2006: $99,982.
Biggest contracts:
$1,232,720 with Army for Defense Missile and Space Systems -- Advanced Development (R&D). Signed on 2002-05-28. Completion date: 2002-01-02.
$1,065,000, same as above.Signed on 2000-06-09. Completion date: 2002-01-02.
$1,015,000, same as above.Signed on 2001-03-30. Completion date: 2002-01-02.
$750,026 with Navy for Engineering -- Applied Research and Exploratory Development (R&D). Signed on 2005-06-20. Completion date: 2006-04-17.
ADVANCED SCIENTIFIC CONCEPTS, (2020 ALAMEDA PADRE SERRA,; small business) : $6,593,923 in 34 contractsfrom 1999 to 2006
Contracts for Defense Electronics and Communication Equipment -- Advanced Development (R&D), Other Defense -- Applied Research and Exploratory Development (R&D), Services -- Basic Research (R&D), Other Defense -- Management and Support (R&D), and moreby Air Force, Army, Navy, National Institute of Standards and Technology, and others Signed by year:2000: $438,018; 2001: $1,042,137; 2002: $1,281,375; 2003: $530,045; 2004: $1,246,020; 2005: $1,352,967; 2006: $633,361.
Biggest contracts:
$772,149 with Air Force for Defense Electronics and Communication Equipment -- Advanced Development (R&D). Signed on 2001-05-10. Completion date: 2002-12-21.
$749,973 with Army for Other Defense -- Applied Research and Exploratory Development (R&D). Signed on 2005-03-14. Completion date: 2006-07-31.
$587,806 with Air Force for Defense Electronics and Communication Equipment -- Advanced Development (R&D). Signed on 2002-03-18. Completion date: 2003-12-14.
$481,740 with Navy for Services -- Basic Research (R&D). Signed on 2002-12-18. Completion date: 2003-02-23.
MISSION LINEN SUPPLY, INC (702 E MONTECITO STREET; small business) : $922,085 in 25 contractsfrom 1999 to 2006
Contracts for Construction of Structures and Facilities -- Miscellaneous Buildings, Laundry and DryCleaning Services by Immigration and Naturalization Service, Air Force, Army, Defense Commissary Agency, and others Signed by year:2000: $0; 2001: $571,093; 2002: $16,623; 2003: $147,285; 2004: $139,338; 2005: $23,115; 2006: -$555.
Biggest contracts:
$500,000 with Immigration and Naturalization Service for Construction of Structures and Facilities -- Miscellaneous Buildings. Signed on 2001-09-15. Completion date: 2002-10-15.
$79,112 with Air Force for Laundry and DryCleaning Services. Taking place in AZ. Signed on 2004-05-25. Completion date: 2004-09-30.
$77,913, same as above.Signed on 2003-10-01. Completion date: 2004-09-30.
$45,000 with Air Force for Laundry and DryCleaning Services. Taking place in TX. Signed on 2003-06-01. Completion date: 2003-07-31.
PHILLIPS METSCH SWEENEY MOORE (2020 ALAMEDA PADRE SERRA,; small business) : $511,628 in 5 contractsin 2000
Contracts for Other Architect and Engineering Services by Air Force Signed by year:2000: $511,628; 2001: $0; 2002: $0; 2003: $0; 2004: $0; 2005: $0; 2006: $0.
Biggest contracts:
$244,247 with Air Force for Other Architect and Engineering Services. Signed on 2000-02-28. Completion date: 2000-07-25.
$150,613, same as above.Signed on 2000-09-26. Completion date: 2000-09-12.
$76,754, same as above.Signed on 2000-01-10. Completion date: 2000-10-19.
$35,014, same as above.Signed on 2000-03-28. Completion date: 2000-06-30.
ORR, ROBIN (580 LAS ALTURAS; small business)
$39,000 with Air Force for Program Review/Development Services. Signed on 2002-11-01. Completion date: 2002-11-29.
smarden & hatcher (810 E. MASON ST.; small business) : $9,017 in 2 contractsin 2006
$8,850 with Bureau of Prisoners/Federal Prison System for Space and Water Heating Equipment. Signed on 2006-03-13. Completion date: 2006-03-23.
$167, same as above.Signed on 2006-04-14. Completion date: 2006-04-17.
Top industries in this zip code by the number of employees in 2005:
2005 - 2018 National Fire Incident Reporting System (NFIRS) incidents
Based on the data from the years 2005 - 2018 the average number of fire incidents per year is 13. The highest number of reported fires - 41 took place in 2005, and the least - 0 in 2007. The data has a decreasing trend.
When looking into fire subcategories, the most incidents belonged to: Outside Fires (33.5%), and Structure Fires (33.0%).
Fire incident types reported to NFIRS in Zip Code 93103


+$7,062
-$7,562
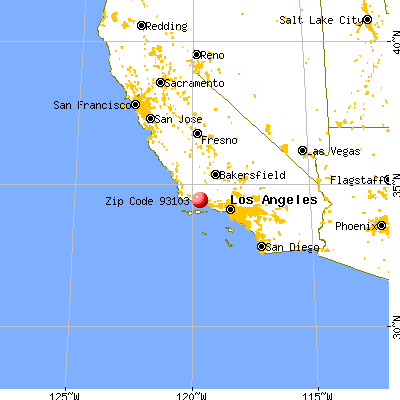
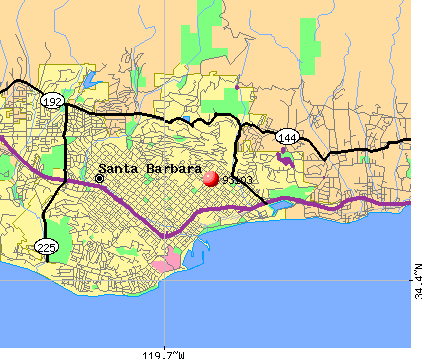 Nearest zip codes: 93101, 93109, 93108, 93110, 93067, 93111.


 . Federal Facility
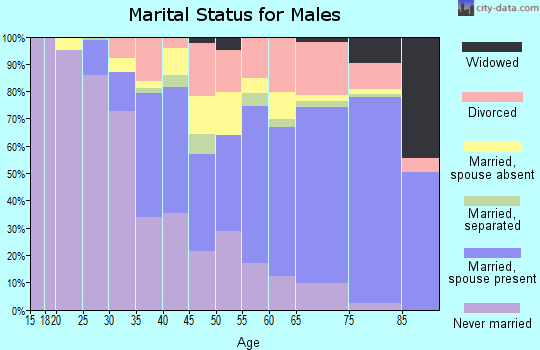

 Based on the data from the years 2005 - 2018 the average number of fire incidents per year is 13. The highest number of reported fires - 41 took place in 2005, and the least - 0 in 2007. The data has a decreasing trend.
 When looking into fire subcategories, the most incidents belonged to: Outside Fires (33.5%), and Structure Fires (33.0%).