Estimated zip code population in 2022: 16,266 Zip code population in 2010: 16,829 Zip code population in 2000: 15,751
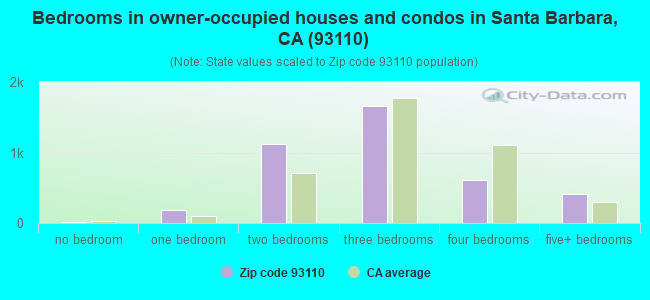
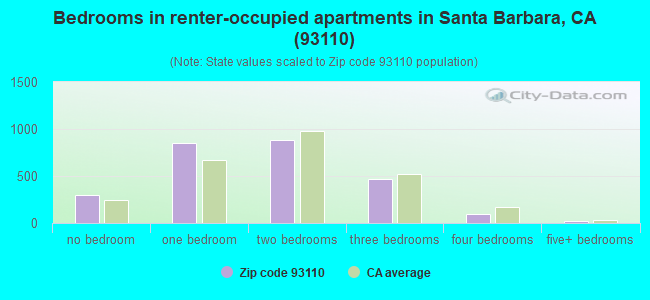
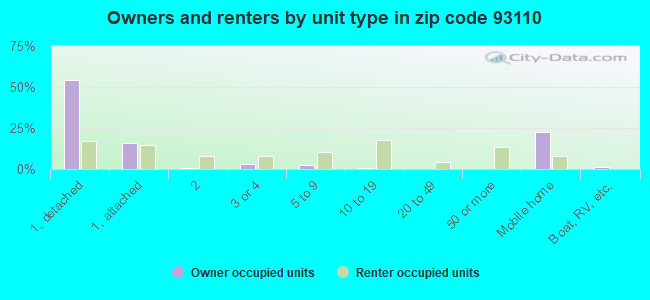
Houses and condos: 7,012 Renter-occupied apartments: 2,612
% of renters here:
39%
State:
44%
March 2022 cost of living index in zip code 93110: 114.1 (more than average, U.S. average is 100)
Land area: 10.5 sq. mi. Water area: 0.1 sq. mi.
Population density: 1,542 people per square mile
(low).
OSM Map
General Map
Google Map
MSN Map
OSM Map
General Map
Google Map
MSN Map
OSM Map
General Map
Google Map
MSN Map
OSM Map
General Map
Google Map
MSN Map
Please wait while loading the map...
Real estate property taxes paid for housing units in 2022:
This zip code:
0.6% ($6,313)
California:
0.7% ($4,831)
Median real estate property taxes paid for housing units with mortgages in 2022: $7,653 (0.7%) Median real estate property taxes paid for housing units with no mortgage in 2022: $4,108 (0.5%)
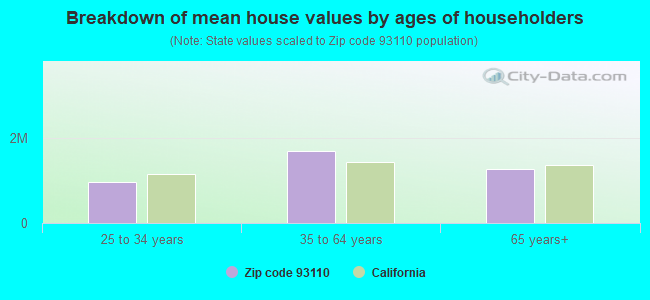
Estimated median house/condo value in 2022: $1,035,465
93110:
$1,035,465
California:
$715,900
According to our research of California and other state lists, there were 10 registered sex offenders living in 93110 zip code as of April 26, 2024. The ratio of all residents to sex offenders in zip code 93110 is 1,702 to 1. The ratio of registered sex offenders to all residents in this zip code is lower than the state average.
Median resident age:
This zip code:
44.6 years
California median age:
37.9 years
Average household size:
This zip code:
2.3 people
California:
2.8 people
Averages for the 2020 tax year for zip code 93110, filed in 2021:
Average Adjusted Gross Income (AGI) in 2020: $134,233 (Individual Income Tax Returns)
Here:
$134,233
State:
$95,910
Salary/wage: $87,971 (reported on 71.4% of returns)
Here:
$87,971
State:
$77,331
(% of AGI for various income ranges: 1226.1% for AGIs below $25k, 4135.5% for AGIs $25k-50k, 7856.3% for AGIs $50k-75k, 10982.5% for AGIs $75k-100k, 20568.4% for AGIs $100k-200k, 112419.1% for AGIs over 200k)
Taxable interest for individuals: $4,795 (reported on 44.7% of returns)
This zip code:
$4,795
California:
$2,294
(% of AGI for various income ranges: 32.5% for AGIs below $25k, 50.5% for AGIs $25k-50k, 111.8% for AGIs $50k-75k, 206.2% for AGIs $75k-100k, 402.7% for AGIs $100k-200k, 5802.3% for AGIs over 200k)
Ordinary dividends: $21,268 (reported on 35.7% of returns)
Here:
$21,268
State:
$10,949
(% of AGI for various income ranges: 128.1% for AGIs below $25k, 135.4% for AGIs $25k-50k, 326.3% for AGIs $50k-75k, 699.5% for AGIs $75k-100k, 1430.2% for AGIs $100k-200k, 20925.9% for AGIs over 200k)
Net capital gain/loss in AGI: +$73,316 (reported on 33.9% of returns)
Here:
+$73,316
State:
+$49,306
(% of AGI for various income ranges: 39.3% for AGIs below $25k, 76.4% for AGIs $25k-50k, 272.8% for AGIs $50k-75k, 493.0% for AGIs $75k-100k, 1564.9% for AGIs $100k-200k, 85199.1% for AGIs over 200k)
Profit/loss from business: +$27,939 (reported on 21.0% of returns)
Here:
+$27,939
State:
+$15,671
(% of AGI for various income ranges: 229.3% for AGIs below $25k, 349.6% for AGIs $25k-50k, 627.5% for AGIs $50k-75k, 513.8% for AGIs $75k-100k, 1571.8% for AGIs $100k-200k, 12214.1% for AGIs over 200k)
Taxable individual retirement arrangement distribution: $25,933 (reported on 11.7% of returns)
93110:
$25,933
California:
$23,505
(% of AGI for various income ranges: 100.8% for AGIs below $25k, 128.6% for AGIs $25k-50k, 260.7% for AGIs $50k-75k, 676.5% for AGIs $75k-100k, 1360.7% for AGIs $100k-200k, 4745.5% for AGIs over 200k)
Self-employed (Keogh) retirement plans: $29,024 (reported on 2.1% of returns)
93110:
$29,024
California:
$30,163
(% of AGI for various income ranges: 16.5% for AGIs $25k-50k, 117.6% for AGIs $100k-200k, 1869.1% for AGIs over 200k)
Total itemized deductions: $48,379 (reported on 20.1% of returns)
Here:
$48,379
State:
$39,517
(% of AGI for various income ranges: 201.7% for AGIs below $25k, 191.8% for AGIs $25k-50k, 760.7% for AGIs $50k-75k, 1355.8% for AGIs $75k-100k, 3194.0% for AGIs $100k-200k, 21414.5% for AGIs over 200k)
Charity contributions: $16,021 (reported on 17.2% of returns)
Here:
$16,021
State:
$12,598
(% of AGI for various income ranges: 9.8% for AGIs below $25k, 12.2% for AGIs $25k-50k, 68.5% for AGIs $50k-75k, 130.5% for AGIs $75k-100k, 429.1% for AGIs $100k-200k, 8519.1% for AGIs over 200k)
Taxes paid: $8,844 (reported on 20.1% of returns)
93110:
$8,844
State:
$8,807
(% of AGI for various income ranges: 36.0% for AGIs below $25k, 40.5% for AGIs $25k-50k, 158.5% for AGIs $50k-75k, 343.2% for AGIs $75k-100k, 814.4% for AGIs $100k-200k, 3090.0% for AGIs over 200k)
Earned income credit: $1,625 (reported on 7.4% of returns)
Here:
$1,625
State:
$2,074
(% of AGI for various income ranges: 51.7% for AGIs below $25k, 39.8% for AGIs $25k-50k)
Percentage of individuals using paid preparers for their 2020 taxes: 92.5%
Here:
92%
State:
92%
(% for various income ranges: 90.2% for AGIs below $25k, 91.7% for AGIs $25k-50k, 93.8% for AGIs $50k-75k, 92.6% for AGIs $75k-100k, 94.2% for AGIs $100k-200k, 94.4% for AGIs over 200k)
Averages for the 2012 tax year for zip code 93110, filed in 2013:
Average Adjusted Gross Income (AGI) in 2012: $111,201 (Individual Income Tax Returns)
Here:
$111,201
State:
$72,726
Salary/wage: $79,161 (reported on 74.0% of returns)
Here:
$79,161
State:
$59,079
(% of AGI for various income ranges: 68.5% for AGIs below $25k, 71.3% for AGIs $25k-50k, 66.1% for AGIs $50k-75k, 65.7% for AGIs $75k-100k, 58.8% for AGIs $100k-200k, 44.3% for AGIs over 200k)
Taxable interest for individuals: $5,350 (reported on 46.0% of returns)
This zip code:
$5,350
California:
$2,146
(% of AGI for various income ranges: 2.3% for AGIs below $25k, 1.2% for AGIs $25k-50k, 1.5% for AGIs $50k-75k, 1.2% for AGIs $75k-100k, 2.2% for AGIs $100k-200k, 2.5% for AGIs over 200k)
Ordinary dividends: $21,087 (reported on 33.6% of returns)
Here:
$21,087
State:
$9,308
(% of AGI for various income ranges: 5.1% for AGIs below $25k, 3.0% for AGIs $25k-50k, 3.3% for AGIs $50k-75k, 3.0% for AGIs $75k-100k, 5.0% for AGIs $100k-200k, 8.1% for AGIs over 200k)
Net capital gain/loss in AGI: +$45,929 (reported on 31.2% of returns)
Here:
+$45,929
State:
+$30,460
(% of AGI for various income ranges: 0.6% for AGIs $25k-50k, 1.4% for AGIs $50k-75k, 1.7% for AGIs $75k-100k, 3.0% for AGIs $100k-200k, 21.0% for AGIs over 200k)
Profit/loss from business: +$26,203 (reported on 21.4% of returns)
Here:
+$26,203
State:
+$17,064
(% of AGI for various income ranges: 11.6% for AGIs below $25k, 8.0% for AGIs $25k-50k, 5.7% for AGIs $50k-75k, 6.1% for AGIs $75k-100k, 5.3% for AGIs $100k-200k, 4.0% for AGIs over 200k)
Taxable individual retirement arrangement distribution: $25,665 (reported on 14.0% of returns)
93110:
$25,665
California:
$19,557
(% of AGI for various income ranges: 4.7% for AGIs below $25k, 2.4% for AGIs $25k-50k, 3.3% for AGIs $50k-75k, 3.7% for AGIs $75k-100k, 5.0% for AGIs $100k-200k, 2.6% for AGIs over 200k)
Self-employment retirement plans: $25,082 (reported on 2.2% of returns)
93110:
$25,082
California:
$24,530
(% of AGI for various income ranges: 0.6% for AGIs $50k-75k, 0.5% for AGIs $100k-200k, 0.7% for AGIs over 200k)
Total itemized deductions: $50,509 (23% of AGI, reported on 41.0% of returns)
Here:
$50,509
State:
$34,004
Here:
22.7% of AGI
State:
22.7% of AGI
(% of AGI for various income ranges: 16.1% for AGIs below $25k, 12.7% for AGIs $25k-50k, 16.3% for AGIs $50k-75k, 17.8% for AGIs $75k-100k, 22.8% for AGIs $100k-200k, 18.6% for AGIs over 200k)
Charity contributions: $9,199 (reported on 35.5% of returns)
Here:
$9,199
State:
$4,659
(% of AGI for various income ranges: 1.0% for AGIs below $25k, 0.9% for AGIs $25k-50k, 1.5% for AGIs $50k-75k, 1.6% for AGIs $75k-100k, 2.6% for AGIs $100k-200k, 3.8% for AGIs over 200k)
Taxes paid: $22,956 (reported on 41.0% of returns)
93110:
$22,956
State:
$14,448
(% of AGI for various income ranges: 2.8% for AGIs below $25k, 3.0% for AGIs $25k-50k, 4.3% for AGIs $50k-75k, 5.8% for AGIs $75k-100k, 8.9% for AGIs $100k-200k, 10.2% for AGIs over 200k)
Earned income credit: $1,756 (reported on 9.6% of returns)
Here:
$1,756
State:
$2,286
(% of AGI for various income ranges: 2.9% for AGIs below $25k, 0.7% for AGIs $25k-50k)
Percentage of individuals using paid preparers for their 2012 taxes: 61.2%
Here:
61%
State:
64%
(% for various income ranges: 53.6% for AGIs below $25k, 57.5% for AGIs $25k-50k, 61.3% for AGIs $50k-75k, 66.7% for AGIs $75k-100k, 67.9% for AGIs $100k-200k, 80.6% for AGIs over 200k)
Averages for the 2004 tax year for zip code 93110, filed in 2005:
Average Adjusted Gross Income (AGI) in 2004: $114,540 (Individual Income Tax Returns)
Here:
$114,540
State:
$58,600
Salary/wage: $68,192 (reported on 72.1% of returns)
Here:
$68,192
State:
$49,455
(% of AGI for various income ranges: 64.3% for AGIs $10k-25k, 72.0% for AGIs $25k-50k, 67.8% for AGIs $50k-75k, 63.2% for AGIs $75k-100k, 34.5% for AGIs over 100k)
Taxable interest for individuals: $5,649 (reported on 57.9% of returns)
This zip code:
$5,649
California:
$2,365
(% of AGI for various income ranges: 5.5% for AGIs $10k-25k, 2.8% for AGIs $25k-50k, 2.5% for AGIs $50k-75k, 3.6% for AGIs $75k-100k, 2.4% for AGIs over 100k)
Taxable dividends: $11,787 (reported on 40.7% of returns)
Here:
$11,787
State:
$4,746
(% of AGI for various income ranges: 4.4% for AGIs $10k-25k, 2.5% for AGIs $25k-50k, 2.8% for AGIs $50k-75k, 3.2% for AGIs $75k-100k, 4.3% for AGIs over 100k)
Net capital gain/loss: +$91,721 (reported on 36.1% of returns)
Here:
+$91,721
State:
+$23,418
(% of AGI for various income ranges: 0.3% for AGIs $10k-25k, 1.1% for AGIs $25k-50k, 1.3% for AGIs $50k-75k, 4.1% for AGIs $75k-100k, 36.3% for AGIs over 100k)
Profit/loss from business: +$30,872 (reported on 21.0% of returns)
Here:
+$30,872
State:
+$16,826
(% of AGI for various income ranges: 8.4% for AGIs $10k-25k, 7.3% for AGIs $25k-50k, 5.7% for AGIs $50k-75k, 7.7% for AGIs $75k-100k, 5.0% for AGIs over 100k)
IRA payment deduction: $3,367 (reported on 4.0% of returns)
93110:
$3,367
California:
$3,192
(% of AGI for various income ranges: 0.3% for AGIs $10k-25k, 0.4% for AGIs $25k-50k, 0.3% for AGIs $50k-75k, 0.3% for AGIs $75k-100k, 0.1% for AGIs over 100k)
Self-employed pension: $19,833 (reported on 2.9% of returns)
Here:
$19,833
California:
$17,688
(% of AGI for various income ranges: 0.4% for AGIs $25k-50k, 0.2% for AGIs $50k-75k, 0.5% for AGIs $75k-100k, 0.5% for AGIs over 100k)
Total itemized deductions: $40,734 (18% of AGI, reported on 43.8% of returns)
Here:
$40,734
State:
$28,113
Here:
17.7% of AGI
State:
25.3% of AGI
(% of AGI for various income ranges: 18.6% for AGIs $10k-25k, 17.1% for AGIs $25k-50k, 20.3% for AGIs $50k-75k, 22.9% for AGIs $75k-100k, 14.0% for AGIs over 100k)
Charity contributions deductions: $9,024 (4% of AGI, reported on 39.4% of returns)
Here:
$9,024
State:
$3,923
Here:
3.7% of AGI
State:
3.3% of AGI
(% of AGI for various income ranges: 1.4% for AGIs $10k-25k, 1.7% for AGIs $25k-50k, 2.2% for AGIs $50k-75k, 2.4% for AGIs $75k-100k, 3.4% for AGIs over 100k)
Total tax: $24,735 (reported on 81.2% of returns)
93110:
$24,735
State:
$10,761
(% of AGI for various income ranges: 5.2% for AGIs $10k-25k, 8.3% for AGIs $25k-50k, 9.9% for AGIs $50k-75k, 10.8% for AGIs $75k-100k, 19.8% for AGIs over 100k)
Earned income credit: $1,247 (reported on 6.8% of returns)
Here:
$1,247
State:
$1,763
Percentage of individuals using paid preparers for their 2004 taxes: 65.3%
Here:
65%
State:
66%
(% for various income ranges: 58.8% for AGIs below $10k, 62.0% for AGIs $10k-25k, 61.2% for AGIs $25k-50k, 66.0% for AGIs $50k-75k, 67.8% for AGIs $75k-100k, 78.8% for AGIs over 100k)
Likely homosexual households (counted as self-reported same-sex unmarried-partner households)
Lesbian couples: 0.2% of all households
Gay men: 0.2% of all households
Household received Food Stamps/SNAP in the past 12 months: 547 Household did not receive Food Stamps/SNAP in the past 12 months: 6,012
Women who had a birth in the past 12 months: 277 (275 now married, 0 unmarried) Women who did not have a birth in the past 12 months: 3,179 (1,077 now married, 2,110 unmarried)
Housing units in zip code 93110 with a mortgage: 2,315 (220 second mortgage, 226 both second mortgage and home equity loan) Houses without a mortgage: 21
Median monthly owner costs for units with a mortgage: $3,512 Median monthly owner costs for units without a mortgage: $929
Residents with income below the poverty level in 2022:
This zip code:
8.6%
Whole state:
12.2%
Residents with income below 50% of the poverty level in 2022:
This zip code:
2.6%
Whole state:
6.2%
Median number of rooms in houses and condos:
Here:
5.5
State:
6.0
Median number of rooms in apartments:
Here:
3.7
State:
3.9
Notable locations in this zip code not listed on our city pages
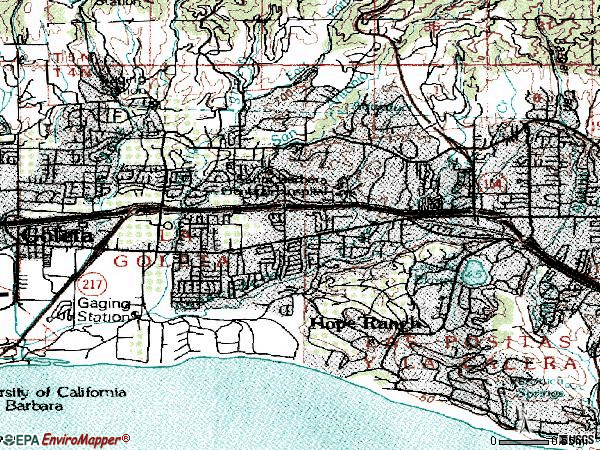
Notable locations in zip code 93110: Hope Ranch (A), La Cumbre Country Club (B), Santa Barbara County Jail (C), La Morada Girls Home (D), Hope House (E), Cathedral Oaks Fire Administrative Center (F), Santa Barbara County Fire Department Station 13 (G). Display/hide their locations on the map
Churches in zip code 93110 include: Faith Baptist Church (A), Family LIfe Fellowship Church (B), Grace Baptist Church (C), Living Faith Center (D), Saint Andrews Presbyterian Church (E), Trinity Baptist Church (F), Bethany Congregational Church (G). Display/hide their locations on the map
1,913 married couples with children.
642 single-parent households (87 men, 555 women).
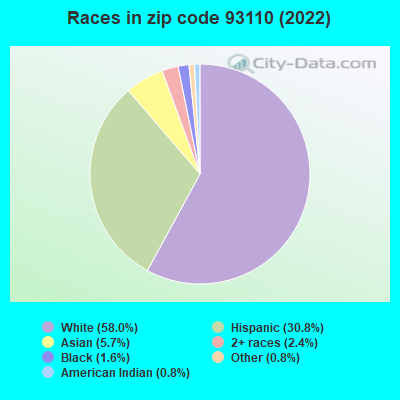
74.2% of residents of 93110 zip code speak English at home.
17.7% of residents speak Spanish at home (59% very well, 13% well, 22% not well, 5% not at all).
4.6% of residents speak other Indo-European language at home (77% very well, 23% well).
3.3% of residents speak Asian or Pacific Island language at home (77% very well, 2% well, 21% not well).
0.2% of residents speak other language at home (63% very well, 37% not well).
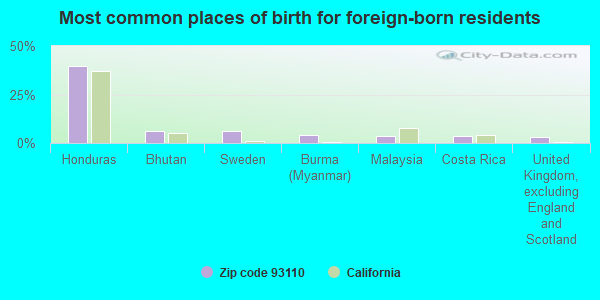
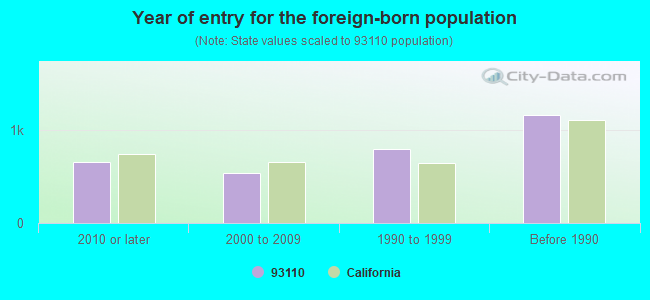
Foreign born population: 2,933 (18.0%) (56.9% of them are naturalized citizens)
Facilities with environmental interests located in this zip code:
HOPE ELEMENTARY (3970 LA COLINA ROAD in SANTA BARBARA, CA)
(National Center for Education Statistics) - STATE ID-6045538
LA COLINA JUNIOR HIGH (4025 FOOTHILL ROAD in SANTA BARBARA, CA)
(National Center for Education Statistics) - STATE ID-6062095 Organizations: SANTA BARBARA HIGH (SCHOOL DISTRICT)
LAS ALTURAS CONTINUATION HIGH (4025 FOOTHILL ROAD in SANTA BARBARA, CA)
(National Center for Education Statistics) - STATE ID-4230090 Organizations: SANTA BARBARA HIGH (SCHOOL DISTRICT)
MONTE VISTA ELEMENTARY (730 HOPE AVE. in SANTA BARBARA, CA)
(National Center for Education Statistics) - STATE ID-6045546 Organizations: HOPE ELEMENTARY (SCHOOL DISTRICT)
EXXONMOBIL OIL CORP. (4790 CALLE REAL in SANTA BARBARA, CA)
HAZARDOUS WASTE BIENNIAL REPORTER (Resource Conservation and Recovery Act (tracking hazardous waste)) Large Quantity Generators, more that 1000 kg of hazardous waste/month (Resource Conservation and Recovery Act (tracking hazardous waste)) Organizations: EXXONMOBIL OIL CORPORATION (CONTACT/OWNER)
LASH CONSTRUCTION (110 SOUTH SALSIPUEDES STREET in SANTA BARBARA, CA)
CRITERIA AND HAZARDOUS AIR POLLUTANT INVENTORY (Inventory of air pollution sources) Business SIC classification: MINERALS AND EARTHS, GROUND OR OTHERWISE TREATED
Housing units lacking complete plumbing facilities: 0.8% Housing units lacking complete kitchen facilities: 1.2%
71.6%Utility gas
22.6%Electricity
3.1%Bottled, tank, or LP gas
1.6%No fuel used
1.1%Other fuel
Population in 1990: 15,352. Population change in the 1990s: +399 (+2.6%).
Place of birth for U.S.-born residents:
This state: 8,908
Northeast: 1,350
Midwest: 1,219
South: 849
West: 712
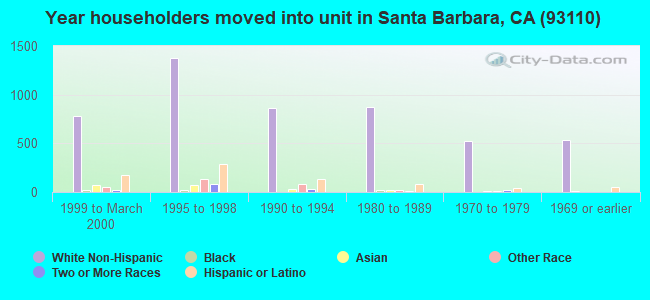
55% of the 93110 zip code residents lived in the same house 5 years ago. Out of people who lived in different houses, 65% lived in this county. Out of people who lived in different counties, 50% lived in California.
84% of the 93110 zip code residents lived in the same house 1 year ago. Out of people who lived in different houses, 71% moved from this county. Out of people who lived in different houses, 15% moved from different county within same state. Out of people who lived in different houses, 10% moved from different state. Out of people who lived in different houses, 1% moved from abroad.
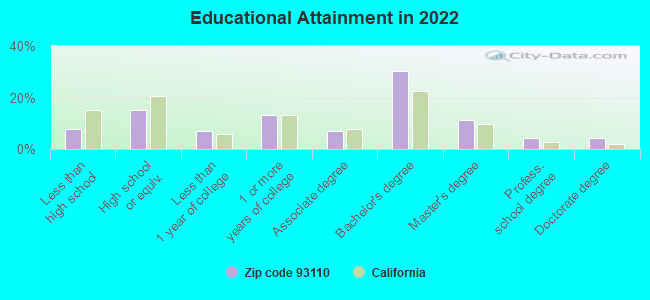
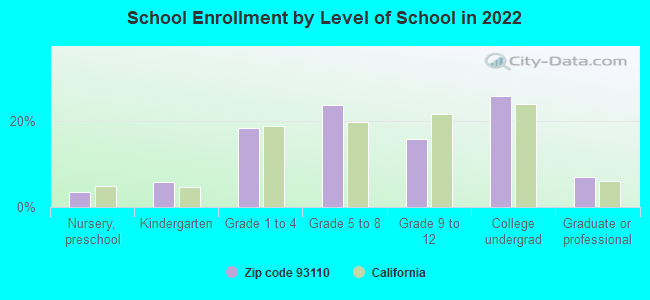
Private vs. public school enrollment:
Students in private schools in grades 1 to 8 (elementary and middle school): 170
Here:
11.8%
California:
10.5%
Students in private schools in grades 9 to 12 (high school): 25
Here:
4.7%
California:
8.5%
Students in private undergraduate colleges: 116
Here:
13.2%
California:
15.9%
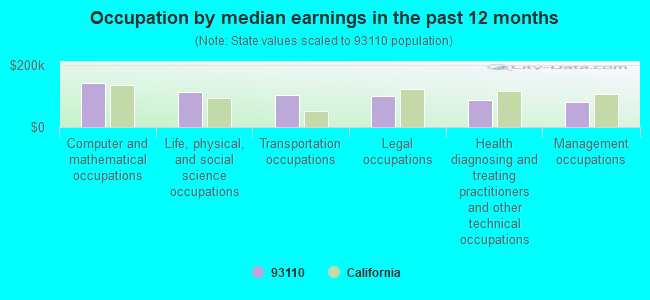
Occupation by median earnings in the past 12 months ($)
143,057Computer and mathematical occupations
112,596Life, physical, and social science occupations
104,624Transportation occupations
99,410Legal occupations
87,938Health diagnosing and treating practitioners and other technical occupations
81,815Management occupations
Companies with federal contracts located in this zip code (SANTA BARBARA, CA):
R P RICHARDS, INC (575 LAS PALMAS DRIVE) : $4,499,193 in 16 contractsfrom 1999 to 2002
Contracts for Maintenance, Repair or Alteration of Real Property -- Miscellaneous Buildings, Construction of Structures and Facilities -- Other Hospital Buildings, Maintenance, Repair or Alteration of Real Property -- Office Buildings, Maintenance, Repair or Alteration of Real Property -- Troop Housing Facilities, and moreby Army, Air Force, Navy, NASA, and others Signed by year:2000: $1,927,453; 2001: $2,165,079; 2002: -$17,383; 2003: $0; 2004: $0; 2005: $0; 2006: $0.
Biggest contracts:
$1,750,000 with Army for Maintenance, Repair or Alteration of Real Property -- Miscellaneous Buildings. Signed on 2000-07-14. Completion date: 2000-07-14.
$1,647,244 with Army for Construction of Structures and Facilities -- Other Hospital Buildings. Taking place in AZ. Signed on 2001-10-12. Completion date: 2002-05-06.
$737,835, same as above.Signed on 2001-09-25. Completion date: 2001-09-29.
$269,991 with Air Force for Maintenance, Repair or Alteration of Real Property -- Office Buildings. Taking place in AZ. Signed on 1999-11-01. Completion date: 2000-09-30.
MNS ENGINEERS, INC. (4141 STATE STREET, SUITE; small business) : $1,239,538 in 25 contractsfrom 1999 to 2006
Contracts for Other Architect and Engineering Services by Air Force Signed by year:2000: $19,345; 2001: $299,670; 2002: $289,598; 2003: $174,795; 2004: $57,525; 2005: $181,458; 2006: $56,923.
Biggest contracts:
$174,795 with Air Force for Other Architect and Engineering Services. Signed on 2003-08-13. Completion date: 2004-05-10.
$150,201, same as above.Signed on 1999-11-09. Completion date: 2000-11-30.
$149,799, same as above.Signed on 2001-01-10. Completion date: 2001-12-31.
$128,302, same as above.Signed on 2002-06-28. Completion date: 2002-12-24.
GREENERIDGE SCIENCES INC (4512 VIA HUERTO; small business) : $756,169 in 12 contractsfrom 1999 to 2006
Contracts for Other Defense -- Applied Research and Exploratory Development (R&D), Other Defense -- Basic Research (R&D), Other Professional Services, Architect - Engineer Services (including landscaping, interior layout, and designing), and moreby Navy, National Oceanic and Atmospheric Administration/Under Secretary for Oceans and Atmosphere Signed by year:2000: $151,320; 2001: $42,435; 2002: $0; 2003: $192,380; 2004: $7,235; 2005: $0; 2006: $203,000.
Biggest contracts:
$200,000 with Navy for Other Defense -- Applied Research and Exploratory Development (R&D). Signed on 2006-03-07. Completion date: 2007-05-31.
$159,799 with Navy for Other Defense -- Basic Research (R&D). Signed on 1999-10-13. Completion date: 2002-05-14.
$151,320, same as above.Signed on 2000-10-11. Completion date: 2002-06-02.
$100,885 with Navy for Other Defense -- Applied Research and Exploratory Development (R&D). Signed on 2003-04-16. Completion date: 2005-04-30.
SANTA BARBARA COUNTY AIR POLLU (260 N SAN ANTONIO RD, SUIT; small business) : $170,363 in 3 contractsfrom 2003 to 2005
$86,037 with Air Force for Air Quality Analyses. Signed on 2005-10-01. Completion date: 2006-09-30.
$80,414 with Air Force for Other Quality Control, Testing and Inspection Services -- Miscellaneous. Signed on 2003-06-03. Completion date: 2004-07-01.
$3,912 with Bureau of Prisoners/Federal Prison System for Miscellaneous Items. Signed on 2004-12-28. Completion date: 2004-12-29.
CLIFFORD A BUNTON (935 COCOPAH DRIVE; small business) : $48,850 in 3 contractsfrom 2002 to 2003
$33,850 with Army for Other Research and Development -- Applied Research and Exploratory Development (R&D). Signed on 2002-08-08. Completion date: 2002-12-30.
$9,000, same as above.Signed on 2003-06-17. Completion date: 2003-10-31.
$6,000, same as above.Signed on 2003-04-03. Completion date: 2003-05-31.
SANTA BARBARA, COUNTY OF (225 CAMINO DEL REMEDIO)
$24,000 with Army for Other Professional Services. Signed on 2004-04-29. Completion date: 2006-12-31.
Top industries in this zip code by the number of employees in 2005:
Management of Companies and Enterprises: Corporate, Subsidiary, and Regional Managing Offices (250-499 employees: 1 establishment, 10-19 employees: 1 establishment)
Health Care and Social Assistance: All Other Outpatient Care Centers (100-249: 1, 50-99: 1, 20-49: 1)
Finance and Insurance: Direct Title Insurance Carriers (100-249: 1)
Health Care and Social Assistance: Services for the Elderly and Persons with Disabilities (100-249: 1)
Educational Services: Elementary and Secondary Schools (50-99: 2, 1-4: 1)
2005 - 2018 National Fire Incident Reporting System (NFIRS) incidents
Based on the data from the years 2005 - 2018 the average number of fire incidents per year is 21. The highest number of reported fires - 41 took place in 2005, and the least - 1 in 2007. The data has a decreasing trend.
When looking into fire subcategories, the most incidents belonged to: Outside Fires (46.7%), and Structure Fires (23.9%).
Fire incident types reported to NFIRS in Zip Code 93110


 Nearest zip codes: 93111, 93109, 93101, 93103, 93105, 93108.


 Based on the data from the years 2005 - 2018 the average number of fire incidents per year is 21. The highest number of reported fires - 41 took place in 2005, and the least - 1 in 2007. The data has a decreasing trend.
 When looking into fire subcategories, the most incidents belonged to: Outside Fires (46.7%), and Structure Fires (23.9%).