Estimated zip code population in 2022: 26,262 Zip code population in 2010: 24,815 Zip code population in 2000: 25,756
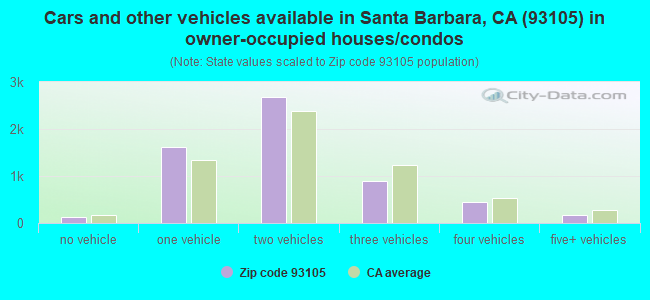
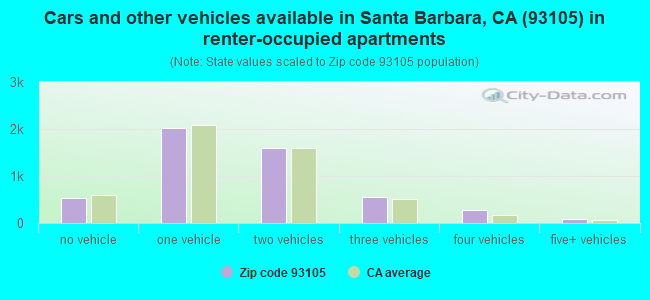
Houses and condos: 11,684 Renter-occupied apartments: 5,046
% of renters here:
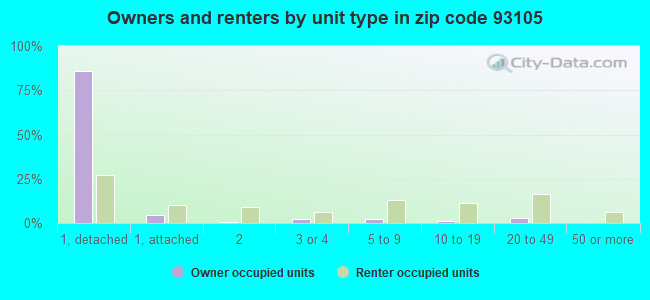
46%
State:
44%
March 2022 cost of living index in zip code 93105: 117.4 (more than average, U.S. average is 100)
Land area: 97.1 sq. mi. Water area: 2.6 sq. mi.
Population density: 270 people per square mile
(very low).
OSM Map
General Map
Google Map
MSN Map
OSM Map
General Map
Google Map
MSN Map
OSM Map
General Map
Google Map
MSN Map
OSM Map
General Map
Google Map
MSN Map
Please wait while loading the map...
Real estate property taxes paid for housing units in 2022:
This zip code:
0.6% ($8,618)
California:
0.7% ($4,831)
Median real estate property taxes paid for housing units with mortgages in 2022: $9,942 (0.6%) Median real estate property taxes paid for housing units with no mortgage in 2022: $6,603 (0.4%)
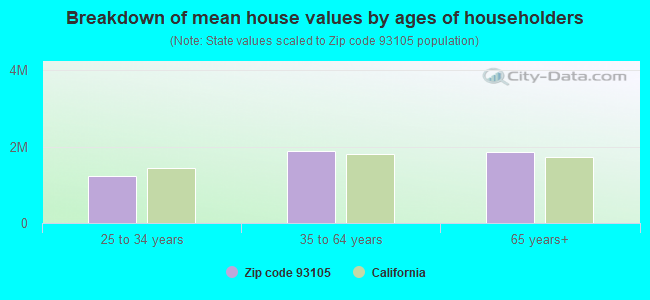
Estimated median house/condo value in 2022: $1,526,377
93105:
$1,526,377
California:
$715,900
According to our research of California and other state lists, there were 12 registered sex offenders living in 93105 zip code as of April 26, 2024. The ratio of all residents to sex offenders in zip code 93105 is 2,182 to 1. The ratio of registered sex offenders to all residents in this zip code is much lower than the state average.
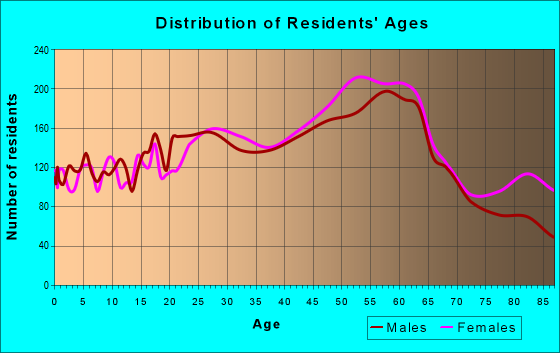
Median resident age:
This zip code:
47.1 years
California median age:
37.9 years
Average household size:
This zip code:
2.3 people
California:
2.8 people
Averages for the 2020 tax year for zip code 93105, filed in 2021:
Average Adjusted Gross Income (AGI) in 2020: $135,923 (Individual Income Tax Returns)
Here:
$135,923
State:
$95,910
Salary/wage: $94,118 (reported on 68.8% of returns)
Here:
$94,118
State:
$77,331
(% of AGI for various income ranges: 1261.8% for AGIs below $25k, 4153.4% for AGIs $25k-50k, 7056.5% for AGIs $50k-75k, 10376.6% for AGIs $75k-100k, 19388.0% for AGIs $100k-200k, 95950.9% for AGIs over 200k)
Taxable interest for individuals: $3,424 (reported on 49.1% of returns)
This zip code:
$3,424
California:
$2,294
(% of AGI for various income ranges: 45.1% for AGIs below $25k, 91.1% for AGIs $25k-50k, 134.2% for AGIs $50k-75k, 250.2% for AGIs $75k-100k, 461.3% for AGIs $100k-200k, 2729.1% for AGIs over 200k)
Ordinary dividends: $15,954 (reported on 41.2% of returns)
Here:
$15,954
State:
$10,949
(% of AGI for various income ranges: 139.5% for AGIs below $25k, 247.8% for AGIs $25k-50k, 470.8% for AGIs $50k-75k, 864.4% for AGIs $75k-100k, 1837.9% for AGIs $100k-200k, 11342.0% for AGIs over 200k)
Net capital gain/loss in AGI: +$56,319 (reported on 39.6% of returns)
Here:
+$56,319
State:
+$49,306
(% of AGI for various income ranges: 87.3% for AGIs below $25k, 138.3% for AGIs $25k-50k, 247.3% for AGIs $50k-75k, 627.6% for AGIs $75k-100k, 2058.0% for AGIs $100k-200k, 56975.2% for AGIs over 200k)
Profit/loss from business: +$26,521 (reported on 23.3% of returns)
Here:
+$26,521
State:
+$15,671
(% of AGI for various income ranges: 276.0% for AGIs below $25k, 395.2% for AGIs $25k-50k, 511.1% for AGIs $50k-75k, 825.4% for AGIs $75k-100k, 2150.9% for AGIs $100k-200k, 8598.7% for AGIs over 200k)
Taxable individual retirement arrangement distribution: $33,766 (reported on 14.0% of returns)
93105:
$33,766
California:
$23,505
(% of AGI for various income ranges: 84.5% for AGIs below $25k, 230.7% for AGIs $25k-50k, 391.6% for AGIs $50k-75k, 940.3% for AGIs $75k-100k, 1884.2% for AGIs $100k-200k, 6305.2% for AGIs over 200k)
Self-employed (Keogh) retirement plans: $25,105 (reported on 2.8% of returns)
93105:
$25,105
California:
$30,163
(% of AGI for various income ranges: 54.2% for AGIs $50k-75k, 169.3% for AGIs $100k-200k, 1524.1% for AGIs over 200k)
Total itemized deductions: $44,543 (reported on 25.0% of returns)
Here:
$44,543
State:
$39,517
(% of AGI for various income ranges: 315.0% for AGIs below $25k, 469.6% for AGIs $25k-50k, 924.4% for AGIs $50k-75k, 1794.7% for AGIs $75k-100k, 3705.1% for AGIs $100k-200k, 16771.1% for AGIs over 200k)
Charity contributions: $14,743 (reported on 21.4% of returns)
Here:
$14,743
State:
$12,598
(% of AGI for various income ranges: 12.0% for AGIs below $25k, 39.4% for AGIs $25k-50k, 106.0% for AGIs $50k-75k, 187.6% for AGIs $75k-100k, 586.4% for AGIs $100k-200k, 7082.2% for AGIs over 200k)
Taxes paid: $8,524 (reported on 24.9% of returns)
93105:
$8,524
State:
$8,807
(% of AGI for various income ranges: 60.1% for AGIs below $25k, 89.4% for AGIs $25k-50k, 188.1% for AGIs $50k-75k, 417.1% for AGIs $75k-100k, 895.2% for AGIs $100k-200k, 2667.6% for AGIs over 200k)
Earned income credit: $1,475 (reported on 6.1% of returns)
Here:
$1,475
State:
$2,074
(% of AGI for various income ranges: 47.9% for AGIs below $25k, 32.6% for AGIs $25k-50k)
Percentage of individuals using paid preparers for their 2020 taxes: 92.3%
Here:
92%
State:
92%
(% for various income ranges: 88.5% for AGIs below $25k, 91.3% for AGIs $25k-50k, 93.7% for AGIs $50k-75k, 92.9% for AGIs $75k-100k, 93.8% for AGIs $100k-200k, 95.1% for AGIs over 200k)
Averages for the 2012 tax year for zip code 93105, filed in 2013:
Average Adjusted Gross Income (AGI) in 2012: $101,231 (Individual Income Tax Returns)
Here:
$101,231
State:
$72,726
Salary/wage: $71,711 (reported on 71.0% of returns)
Here:
$71,711
State:
$59,079
(% of AGI for various income ranges: 67.9% for AGIs below $25k, 67.8% for AGIs $25k-50k, 63.2% for AGIs $50k-75k, 55.9% for AGIs $75k-100k, 56.9% for AGIs $100k-200k, 39.8% for AGIs over 200k)
Taxable interest for individuals: $3,670 (reported on 50.3% of returns)
This zip code:
$3,670
California:
$2,146
(% of AGI for various income ranges: 2.7% for AGIs below $25k, 1.7% for AGIs $25k-50k, 1.9% for AGIs $50k-75k, 2.0% for AGIs $75k-100k, 1.6% for AGIs $100k-200k, 1.8% for AGIs over 200k)
Ordinary dividends: $13,204 (reported on 37.8% of returns)
Here:
$13,204
State:
$9,308
(% of AGI for various income ranges: 5.1% for AGIs below $25k, 3.7% for AGIs $25k-50k, 3.9% for AGIs $50k-75k, 5.2% for AGIs $75k-100k, 4.3% for AGIs $100k-200k, 5.5% for AGIs over 200k)
Net capital gain/loss in AGI: +$32,504 (reported on 35.5% of returns)
Here:
+$32,504
State:
+$30,460
(% of AGI for various income ranges: 0.5% for AGIs $25k-50k, 1.0% for AGIs $50k-75k, 2.4% for AGIs $75k-100k, 2.9% for AGIs $100k-200k, 21.6% for AGIs over 200k)
Profit/loss from business: +$26,227 (reported on 23.6% of returns)
Here:
+$26,227
State:
+$17,064
(% of AGI for various income ranges: 13.8% for AGIs below $25k, 6.9% for AGIs $25k-50k, 7.2% for AGIs $50k-75k, 6.9% for AGIs $75k-100k, 7.1% for AGIs $100k-200k, 4.7% for AGIs over 200k)
Taxable individual retirement arrangement distribution: $23,899 (reported on 16.0% of returns)
93105:
$23,899
California:
$19,557
(% of AGI for various income ranges: 4.4% for AGIs below $25k, 3.7% for AGIs $25k-50k, 3.2% for AGIs $50k-75k, 5.0% for AGIs $75k-100k, 4.8% for AGIs $100k-200k, 3.2% for AGIs over 200k)
Self-employment retirement plans: $22,524 (reported on 2.8% of returns)
93105:
$22,524
California:
$24,530
(% of AGI for various income ranges: 0.3% for AGIs $25k-50k, 0.5% for AGIs $50k-75k, 0.5% for AGIs $75k-100k, 0.6% for AGIs $100k-200k, 0.7% for AGIs over 200k)
Total itemized deductions: $40,998 (24% of AGI, reported on 46.7% of returns)
Here:
$40,998
State:
$34,004
Here:
23.5% of AGI
State:
22.7% of AGI
(% of AGI for various income ranges: 21.1% for AGIs below $25k, 15.8% for AGIs $25k-50k, 17.5% for AGIs $50k-75k, 20.8% for AGIs $75k-100k, 21.7% for AGIs $100k-200k, 17.8% for AGIs over 200k)
Charity contributions: $6,568 (reported on 40.2% of returns)
Here:
$6,568
State:
$4,659
(% of AGI for various income ranges: 0.9% for AGIs below $25k, 1.2% for AGIs $25k-50k, 1.8% for AGIs $50k-75k, 2.2% for AGIs $75k-100k, 2.3% for AGIs $100k-200k, 3.3% for AGIs over 200k)
Taxes paid: $16,151 (reported on 46.6% of returns)
93105:
$16,151
State:
$14,448
(% of AGI for various income ranges: 4.0% for AGIs below $25k, 3.2% for AGIs $25k-50k, 4.3% for AGIs $50k-75k, 6.0% for AGIs $75k-100k, 7.9% for AGIs $100k-200k, 8.9% for AGIs over 200k)
Earned income credit: $1,493 (reported on 7.2% of returns)
Here:
$1,493
State:
$2,286
(% of AGI for various income ranges: 2.4% for AGIs below $25k, 0.3% for AGIs $25k-50k)
Percentage of individuals using paid preparers for their 2012 taxes: 62.9%
Here:
63%
State:
64%
(% for various income ranges: 54.0% for AGIs below $25k, 55.7% for AGIs $25k-50k, 64.4% for AGIs $50k-75k, 66.1% for AGIs $75k-100k, 70.7% for AGIs $100k-200k, 82.4% for AGIs over 200k)
Averages for the 2004 tax year for zip code 93105, filed in 2005:
Average Adjusted Gross Income (AGI) in 2004: $82,215 (Individual Income Tax Returns)
Here:
$82,215
State:
$58,600
Salary/wage: $60,585 (reported on 69.3% of returns)
Here:
$60,585
State:
$49,455
(% of AGI for various income ranges: 65.6% for AGIs $10k-25k, 68.5% for AGIs $25k-50k, 59.7% for AGIs $50k-75k, 57.5% for AGIs $75k-100k, 43.6% for AGIs over 100k)
Taxable interest for individuals: $4,152 (reported on 61.0% of returns)
This zip code:
$4,152
California:
$2,365
(% of AGI for various income ranges: 4.9% for AGIs $10k-25k, 3.4% for AGIs $25k-50k, 3.5% for AGIs $50k-75k, 3.5% for AGIs $75k-100k, 2.6% for AGIs over 100k)
Taxable dividends: $8,088 (reported on 44.6% of returns)
Here:
$8,088
State:
$4,746
(% of AGI for various income ranges: 5.1% for AGIs $10k-25k, 3.6% for AGIs $25k-50k, 4.2% for AGIs $50k-75k, 3.7% for AGIs $75k-100k, 4.4% for AGIs over 100k)
Net capital gain/loss: +$29,742 (reported on 40.1% of returns)
Here:
+$29,742
State:
+$23,418
(% of AGI for various income ranges: 0.9% for AGIs $10k-25k, 1.1% for AGIs $25k-50k, 2.1% for AGIs $50k-75k, 3.8% for AGIs $75k-100k, 20.6% for AGIs over 100k)
Profit/loss from business: +$27,900 (reported on 23.5% of returns)
Here:
+$27,900
State:
+$16,826
(% of AGI for various income ranges: 10.7% for AGIs $10k-25k, 8.0% for AGIs $25k-50k, 7.9% for AGIs $50k-75k, 7.4% for AGIs $75k-100k, 7.9% for AGIs over 100k)
IRA payment deduction: $3,468 (reported on 4.3% of returns)
93105:
$3,468
California:
$3,192
(% of AGI for various income ranges: 0.4% for AGIs $10k-25k, 0.4% for AGIs $25k-50k, 0.3% for AGIs $50k-75k, 0.2% for AGIs $75k-100k, 0.1% for AGIs over 100k)
Self-employed pension: $18,585 (reported on 3.7% of returns)
Here:
$18,585
California:
$17,688
(% of AGI for various income ranges: 0.2% for AGIs $10k-25k, 0.3% for AGIs $25k-50k, 0.5% for AGIs $50k-75k, 0.7% for AGIs $75k-100k, 1.0% for AGIs over 100k)
Total itemized deductions: $34,460 (24% of AGI, reported on 47.6% of returns)
Here:
$34,460
State:
$28,113
Here:
24.4% of AGI
State:
25.3% of AGI
(% of AGI for various income ranges: 21.8% for AGIs $10k-25k, 18.9% for AGIs $25k-50k, 21.7% for AGIs $50k-75k, 23.7% for AGIs $75k-100k, 18.5% for AGIs over 100k)
Charity contributions deductions: $6,250 (4% of AGI, reported on 43.0% of returns)
Here:
$6,250
State:
$3,923
Here:
4.2% of AGI
State:
3.3% of AGI
(% of AGI for various income ranges: 1.5% for AGIs $10k-25k, 1.8% for AGIs $25k-50k, 2.4% for AGIs $50k-75k, 2.9% for AGIs $75k-100k, 3.7% for AGIs over 100k)
Total tax: $15,968 (reported on 83.1% of returns)
93105:
$15,968
State:
$10,761
(% of AGI for various income ranges: 5.5% for AGIs $10k-25k, 8.6% for AGIs $25k-50k, 10.7% for AGIs $50k-75k, 11.3% for AGIs $75k-100k, 19.2% for AGIs over 100k)
Earned income credit: $1,140 (reported on 6.0% of returns)
Here:
$1,140
State:
$1,763
Percentage of individuals using paid preparers for their 2004 taxes: 65.5%
Here:
66%
State:
66%
(% for various income ranges: 57.7% for AGIs below $10k, 59.1% for AGIs $10k-25k, 61.3% for AGIs $25k-50k, 67.0% for AGIs $50k-75k, 70.6% for AGIs $75k-100k, 78.9% for AGIs over 100k)
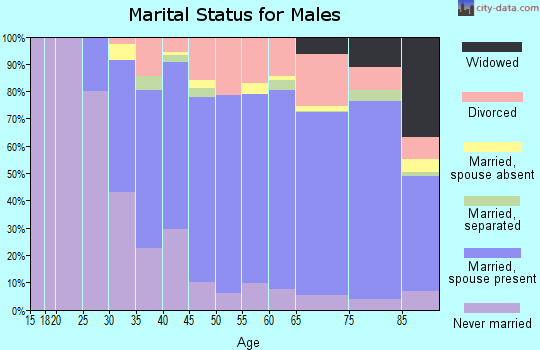
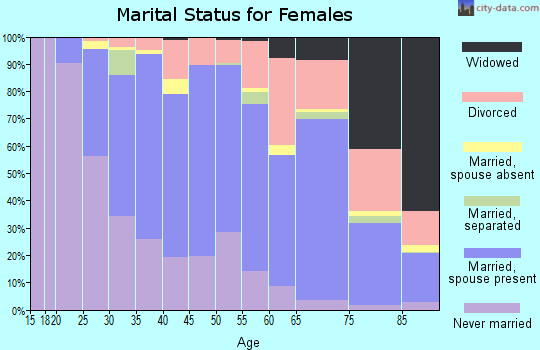
Likely homosexual households (counted as self-reported same-sex unmarried-partner households)
Lesbian couples: 0.2% of all households
Gay men: 0.8% of all households
Household received Food Stamps/SNAP in the past 12 months: 562 Household did not receive Food Stamps/SNAP in the past 12 months: 10,232
Women who had a birth in the past 12 months: 239 (179 now married, 60 unmarried) Women who did not have a birth in the past 12 months: 5,322 (2,252 now married, 3,063 unmarried)
Housing units in zip code 93105 with a mortgage: 3,580 (476 second mortgage, 16 home equity loan, 409 both second mortgage and home equity loan) Houses without a mortgage: 68
Median monthly owner costs for units with a mortgage: $3,876 Median monthly owner costs for units without a mortgage: $1,077
Residents with income below the poverty level in 2022:
This zip code:
8.0%
Whole state:
12.2%
Residents with income below 50% of the poverty level in 2022:
This zip code:
3.3%
Whole state:
6.2%
Median number of rooms in houses and condos:
Here:
6.1
State:
6.0
Median number of rooms in apartments:
Here:
3.8
State:
3.9
Notable locations in this zip code not listed on our city pages
Notable locations in zip code 93105: Los Prietos Boys Camp (A), Los Prietos Campground (B), Los Prietos Ranger Station (C), Camp Drake (D), Rancho San Fernando Rey (E), Santa Barbara Tennis Club (F), Santa Barbara Municipal Golf Course (G), Leibengood Professional Business Center (H), San Lucas Ranch (I), San Marcos Ranch (J), Four-H Camp (K), Cold Spring (L), Fremont Campground (M), Goddard Picnic Ground (N), Santa Barbara Radio Range Station (O), Bradbury Dam Observation Point (P), San Marcos Trout Club (Q), Sage Hill Campground (R), Ptand T Electronic Site (S), Ranch Alegre Boy Scout Camp (T). Display/hide their locations on the map
Shopping Centers: Mission Creek Plaza Shopping Center (1), Loreto Plaza Shopping Center (2), La Cumbre Plaza Shopping Center (3), Five Points Shopping Center (4). Display/hide their locations on the map
Churches in zip code 93105 include: Mission Santa Barbara (A), Congregation B'nai Brith (B), Emmanuel Lutheran Church (C), First Baptist Church (D), First Presbyterian Church (E), Grace Lutheran Church (F), Santa Barbara Buddhist Priory (G), Alamar Church of the Four Square Gospel (H), Chinese Evangelical Free Church (I). Display/hide their locations on the map
Parks in zip code 93105 include: Chumash Painted Cave State Historic Park (1), Earl Warren Show Grounds (2), Laurel Canyon Park (3), McKenzie Park (4), San Roque Park (5), Stevens Park (6), Willow Glen Park (7), Rattlesnake Canyon Park (8), Skofield Park (9). Display/hide their locations on the map
2,973 married couples with children.
572 single-parent households (463 men, 109 women).
82.1% of residents of 93105 zip code speak English at home.
11.6% of residents speak Spanish at home (62% very well, 14% well, 15% not well, 9% not at all).
4.1% of residents speak other Indo-European language at home (83% very well, 16% well, 1% not at all).
2.3% of residents speak Asian or Pacific Island language at home (50% very well, 42% well, 5% not well, 3% not at all).
0.1% of residents speak other language at home (67% very well, 33% not well).
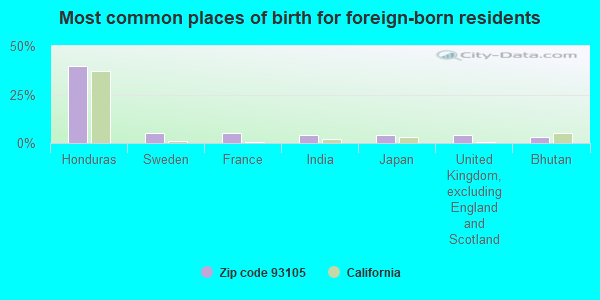
Foreign born population: 3,447 (13.1%) (50.2% of them are naturalized citizens)
Facilities with environmental interests located in this zip code:
MEL CLAYTON FORD (350 HITCHCOCK WAY in SANTA BARBARA, CA)
STATE MASTER (California - Hazardous Waste Tracking) - HAZARDOU WASTE PROGRAM Small Quantity Generators, between 100 kg and 1000 kg of hazardous waste/month (Resource Conservation and Recovery Act (tracking hazardous waste)) Small Quantity Generators, between 100 kg and 1000 kg of hazardous waste/month (Resource Conservation and Recovery Act (tracking hazardous waste)) - notification Alternative names: THOMPSON-FAUSKEE FORD
HUGHES AUTOMOBILE CO (400 HITCHCOCK WY in SANTA BARBARA, CA)
STATE MASTER (California - Hazardous Waste Tracking) - HAZARDOU WASTE PROGRAM Small Quantity Generators, between 100 kg and 1000 kg of hazardous waste/month (Resource Conservation and Recovery Act (tracking hazardous waste)) - notification Organizations: LEE HUGHES (CONTACT/OWNER)
ADAMS ELEMENTARY SCHOOL (2701 LAS POSITAS RD in SANTA BARBARA, CA)
(Geographic Names Information System) (National Center for Education Statistics) - STATE ID-6045819 Organizations: SANTA BARBARA ELEMENTARY (SCHOOL DISTRICT)
ECONO LUBE N TUNE 118 (3956 STATE ST in SANTA BARBARA, CA)
STATE MASTER (California - Hazardous Waste Tracking) - HAZARDOU WASTE PROGRAM Small Quantity Generators, between 100 kg and 1000 kg of hazardous waste/month (Resource Conservation and Recovery Act (tracking hazardous waste)) - notification Organizations: CHRISTOPHER HAHN (CONTACT/OWNER)
CHEVRON STATION NO 93443 (115 S LA CUMBRE RD in SANTA BARBARA, CA)
STATE MASTER (California - Hazardous Waste Tracking) - HAZARDOU WASTE PROGRAM Small Quantity Generators, between 100 kg and 1000 kg of hazardous waste/month (Resource Conservation and Recovery Act (tracking hazardous waste)) - notification Organizations: CHEVRON PRODUCTS CO (CONTACT/OWNER)
EXXONMOBIL OIL CORP. (101 S LA CUMBRE in SANTA BARBARA, CA)
HAZARDOUS WASTE BIENNIAL REPORTER (Resource Conservation and Recovery Act (tracking hazardous waste)) Large Quantity Generators, more that 1000 kg of hazardous waste/month (Resource Conservation and Recovery Act (tracking hazardous waste))
AMERICAN DRY CLEANERS (3009 STATE ST in SANTA BARBARA, CA)
Small Quantity Generators, between 100 kg and 1000 kg of hazardous waste/month (Resource Conservation and Recovery Act (tracking hazardous waste)) Organizations: FRED H COBELENS (CONTACT/OWNER)
LUSTO THE TAYLOR CLEANERS (2014 DE LA VINA ST in SANTA BARBARA, CA)
Small Quantity Generators, between 100 kg and 1000 kg of hazardous waste/month (Resource Conservation and Recovery Act (tracking hazardous waste)) Organizations: LUSTO CUVILLA (CONTACT/OWNER)
JUSTO THE TAILOR AND CLEANERS (2277 LAS POSITAS RD in SANTA BARBARA, CA)
Small Quantity Generators, between 100 kg and 1000 kg of hazardous waste/month (Resource Conservation and Recovery Act (tracking hazardous waste)) - notification Organizations: JUSTO CUBILLA (CONTACT/OWNER)
KITS CAMERAS 1 HOUR NO 127 (3849 STATE ST STE 1 57 in SANTA BARBARA, CA)
Small Quantity Generators, between 100 kg and 1000 kg of hazardous waste/month (Resource Conservation and Recovery Act (tracking hazardous waste)) - notification Organizations: RITZ CAMERA CENTERS INC (CONTACT/OWNER)
CALTRANS DISTRICT 05 (3999 STATE ST in SANTA BARBARA, CA)
Small Quantity Generators, between 100 kg and 1000 kg of hazardous waste/month (Resource Conservation and Recovery Act (tracking hazardous waste)) Business NAICS classification: AIR TRAFFIC CONTROL.
ITT FEDERAL SERVICES (3887 STATE STREET SUITE 107 in SANTA BARBARA, CA)
CRITERIA AND HAZARDOUS AIR POLLUTANT INVENTORY (Inventory of air pollution sources) Business SIC classification: NATIONAL SECURITY
JEDLICKA SADDLERY, INC. (2605 DE LA VINA ST. in SANTA BARBARA, CA)
COMPLIANCE ACTIVITY (Tracking inspections of insecticide, fungicide, and rodenticide, and toxic substances)
Housing units lacking complete plumbing facilities: 1.1% Housing units lacking complete kitchen facilities: 2.5%
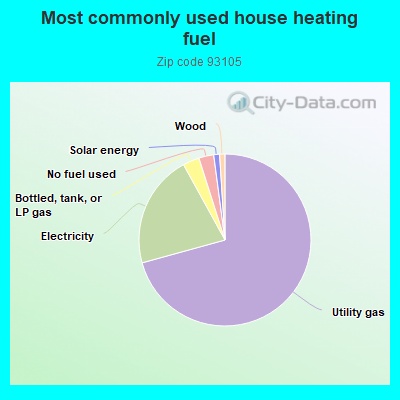
70.8%Utility gas
21.3%Electricity
3.1%Bottled, tank, or LP gas
2.8%No fuel used
1.1%Solar energy
1.0%Wood
Population in 1990: 23,284. Population change in the 1990s: +2,472 (+10.6%).
Place of birth for U.S.-born residents:
This state: 15,004
Northeast: 2,290
Midwest: 2,194
South: 1,377
West: 1,502
55% of the 93105 zip code residents lived in the same house 5 years ago. Out of people who lived in different houses, 62% lived in this county. Out of people who lived in different counties, 50% lived in California.
88% of the 93105 zip code residents lived in the same house 1 year ago. Out of people who lived in different houses, 55% moved from this county. Out of people who lived in different houses, 24% moved from different county within same state. Out of people who lived in different houses, 16% moved from different state. Out of people who lived in different houses, 5% moved from abroad.
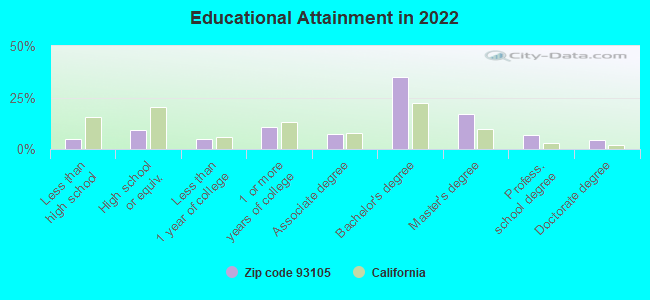
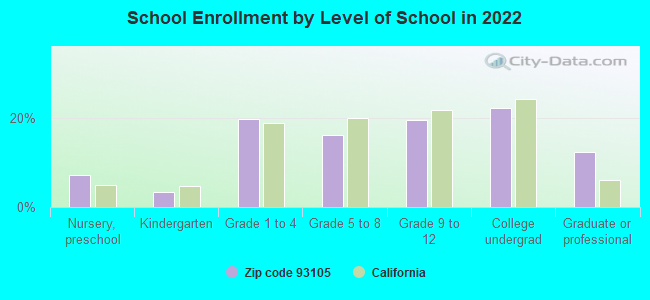
Private vs. public school enrollment:
Students in private schools in grades 1 to 8 (elementary and middle school): 404
Here:
23.1%
California:
10.5%
Students in private schools in grades 9 to 12 (high school): 44
Here:
4.7%
California:
8.5%
Students in private undergraduate colleges: 142
Here:
13.3%
California:
15.9%
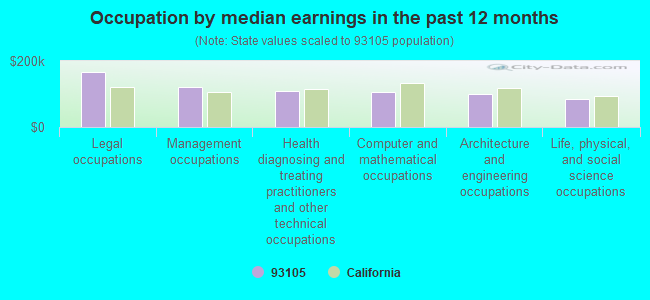
Occupation by median earnings in the past 12 months ($)
168,123Legal occupations
122,597Management occupations
107,629Health diagnosing and treating practitioners and other technical occupations
105,683Computer and mathematical occupations
99,808Architecture and engineering occupations
84,700Life, physical, and social science occupations
Companies with biggest federal contracts located in this zip code (SANTA BARBARA, CA):
BRANDES ASSOCIATES, INC (1417 CRESTLINE DRIVE; small business) : $43,051,972 in 166 contractsfrom 1999 to 2006
Contracts for Program Management/Support Services, Other Defense -- Advanced Development (R&D), Other Professional Services, Other Defense -- Operational Systems Development (R&D), and moreby Navy, Army Signed by year:2000: $5,040,729; 2001: $6,297,400; 2002: $8,149,921; 2003: $4,479,865; 2004: $8,129,642; 2005: $5,292,832; 2006: $1,689,281.
Biggest contracts:
$2,032,805 with Navy for Program Management/Support Services. Taking place in MD. Signed on 2001-11-24. Completion date: 2002-11-23.
$2,032,805, same as above.Signed on 2001-11-24. Completion date: 2002-11-23.
$1,978,068, same as above.Signed on 2000-11-21. Completion date: 2001-11-23.
$1,922,694, same as above.Signed on 1999-11-24. Completion date: 2000-11-24.
SOLETANCHE INQUIP JV (2100 ANACAPA STREET; small business) : $5,510,382 in 13 contractsfrom 2000 to 2001
Contracts for Construction of Structures and Facilities -- Other Non-Building Facilities by U.S. Army Corps of Engineers - civil program financing only Signed by year:2000: $5,308,378; 2001: $202,004; 2002: $0; 2003: $0; 2004: $0; 2005: $0; 2006: $0.
Biggest contracts:
$2,550,000 with U.S. Army Corps of Engineers - civil program financing only for Construction of Structures and Facilities -- Other Non-Building Facilities. Signed on 2000-10-05. Completion date: 2001-01-17.
$1,273,325, same as above.Signed on 2000-11-29. Completion date: 2001-01-17.
$350,000, same as above.Signed on 2000-10-19. Completion date: 2001-01-17.
$350,000, same as above.Signed on 2000-12-20. Completion date: 2001-01-17.
INQUIP ASSOCIATES, INC. (2100 ANACAPA ST; small business)
$384,814 with Army for Construction of Structures and Facilities -- Other Non-Building Facilities. Signed on 2006-01-27. Completion date: 2001-02-02.
EL PATIO, INC. (2600 DE LA VINA ST. STE. C)
$199,873 with Navy for Lodging - Hotel/Motel. Taking place in CT. Signed on 2000-03-21. Completion date: 2000-07-27.
CYAN SYSTEMS, INC (3718 BARCELONA DR; small business)
$99,813 with Air Force for Ammunition -- Advanced Development (R&D). Signed on 2006-06-16. Completion date: 2007-03-15.
HIGHER VISION INC (3905 STATE ST STE 7; small business) : $50,000 in 4 contractsfrom 2004 to 2005
$40,000 with Army for Communications Services. Taking place in DC. Signed on 2004-11-18. Completion date: 2004-12-12.
$10,000 with Army for Other Professional Services. Signed on 2005-09-28. Completion date: 2005-09-28.
$10,000 with Army for Other Professional Services. Taking place in DC. Signed on 2004-07-15. Completion date: 2004-12-12.
-$10,000 with Army for Other Professional Services. Signed on 2005-09-28. Completion date: 2005-09-29.
ENCINA, PEPPER TREE JOINT VENT (3850 STATE ST)
$49,140 with U.S. Special Operations Command for Lodging - Hotel/Motel. Signed on 2003-11-26. Completion date: 2004-01-03.
CONTINENTAL JANITORIAL SERVICE (925 NORTH ONTARE ROAD; small business) : $34,755 in 5 contractsfrom 2004 to 2006
Contracts for Custodial Janitorial Services by Army Signed by year:2000: $0; 2001: $0; 2002: $0; 2003: $0; 2004: $17,220; 2005: $17,820; 2006: -$285.
Biggest contracts:
$17,820 with Army for Custodial Janitorial Services. Signed on 2005-08-27. Completion date: 2006-08-12.
$17,220, same as above.Signed on 2004-06-27. Completion date: 2005-07-31.
$0, same as above.Signed on 2006-03-01. Completion date: 2006-08-12.
$0, same as above.Signed on 2004-06-27. Completion date: 2005-07-31.
RF SPECIALTIES OF CALIFORNIA (3463 STATE STREET STE 229; small business) : $13,329 in 2 contractsfrom 2003 to 2005
$9,396 with American Forces Information Service for Antennas, Waveguides, and Related Equipment. Signed on 2005-03-24. Completion date: 2005-04-29.
$3,933 with Department of Defense for Radio and Television Communication Equipment, Except Airborne. Signed on 2003-02-03. Completion date: 2003-02-28.
A & B LOCK & KEY (2609 DE LAVINA; small business)
$9,946 with Army for Miscellaneous Office Machines. Signed on 2003-07-14. Completion date: 2003-07-31.
Top industries in this zip code by the number of employees in 2005:
Health Care and Social Assistance: General Medical and Surgical Hospitals (over 1000 employees: 1 establishment)
Health Care and Social Assistance: Offices of Physicians (except Mental Health Specialists) (100-249: 1, 50-99: 2, 20-49: 7, 10-19: 11, 5-9: 32, 1-4: 69)
2005 - 2018 National Fire Incident Reporting System (NFIRS) incidents
According to the data from the years 2005 - 2018 the average number of fire incidents per year is 44. The highest number of reported fire incidents - 72 took place in 2016, and the least - 19 in 2007. The data has a decreasing trend.
When looking into fire subcategories, the most incidents belonged to: Outside Fires (40.6%), and Mobile Property/Vehicle Fires (28.4%).
Fire incident types reported to NFIRS in Zip Code 93105
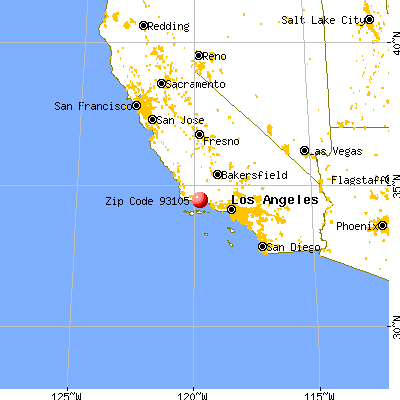


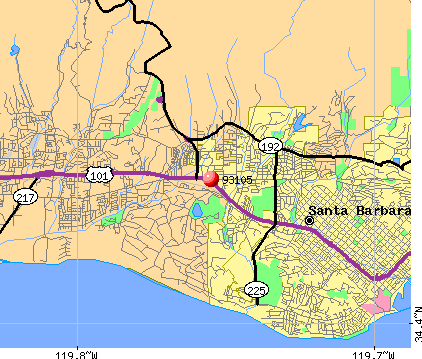 Nearest zip codes: 93111, 93110, 93101, 93109, 93103, 93108.


 According to the data from the years 2005 - 2018 the average number of fire incidents per year is 44. The highest number of reported fire incidents - 72 took place in 2016, and the least - 19 in 2007. The data has a decreasing trend.
 When looking into fire subcategories, the most incidents belonged to: Outside Fires (40.6%), and Mobile Property/Vehicle Fires (28.4%).