Estimated zip code population in 2022: 28,534 Zip code population in 2010: 28,033 Zip code population in 2000: 27,034
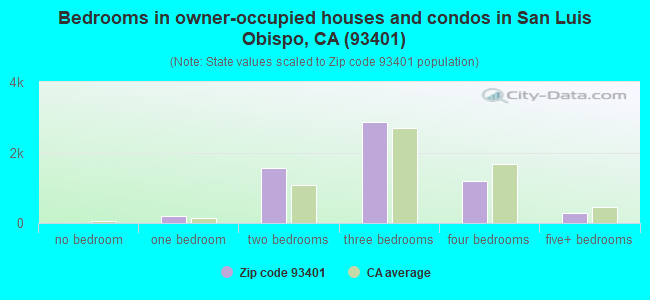
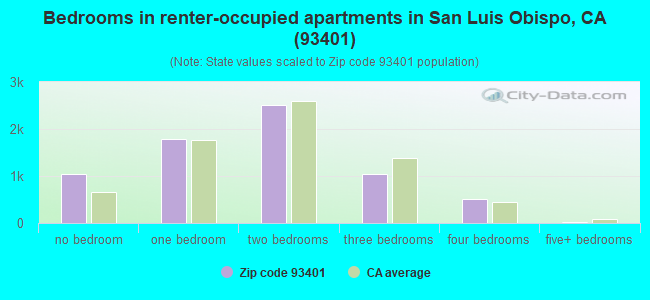
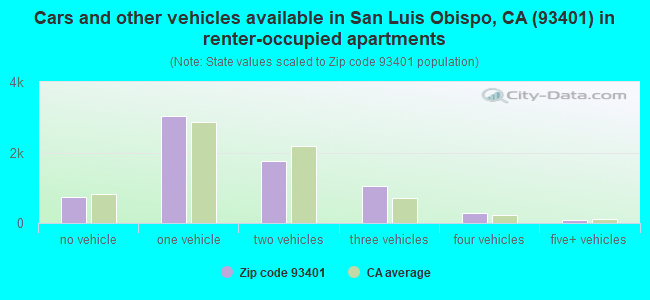
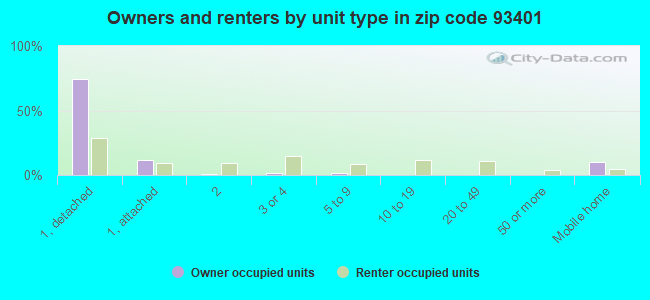
Houses and condos: 13,931 Renter-occupied apartments: 6,894
% of renters here:
53%
State:
44%
March 2022 cost of living index in zip code 93401: 109.1 (more than average, U.S. average is 100)
Land area: 69.9 sq. mi. Water area: 0.0 sq. mi.
Population density: 408 people per square mile
(low).
OSM Map
General Map
Google Map
MSN Map
OSM Map
General Map
Google Map
MSN Map
OSM Map
General Map
Google Map
MSN Map
OSM Map
General Map
Google Map
MSN Map
Please wait while loading the map...
Real estate property taxes paid for housing units in 2022:
This zip code:
0.6% ($6,007)
California:
0.7% ($4,831)
Median real estate property taxes paid for housing units with mortgages in 2022: $6,920 (0.7%) Median real estate property taxes paid for housing units with no mortgage in 2022: $3,673 (0.4%)
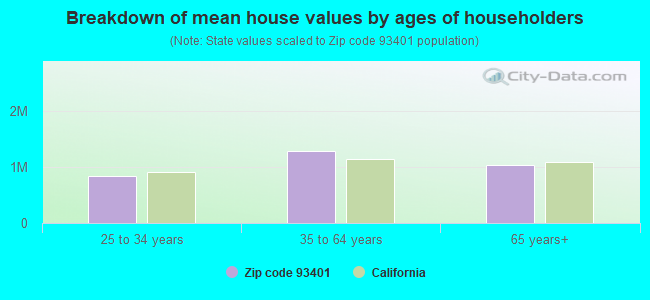
Estimated median house/condo value in 2022: $956,524
93401:
$956,524
California:
$715,900
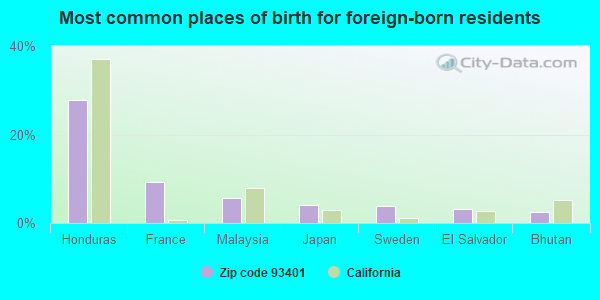
According to our research of California and other state lists, there were 29 registered sex offenders living in 93401 zip code as of April 27, 2024. The ratio of all residents to sex offenders in zip code 93401 is 1,003 to 1. The ratio of registered sex offenders to all residents in this zip code is lower than the state average.
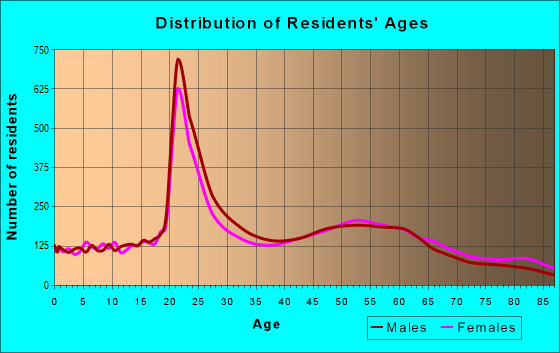
Median resident age:
This zip code:
36.1 years
California median age:
37.9 years
Average household size:
This zip code:
2.1 people
California:
2.8 people
Averages for the 2020 tax year for zip code 93401, filed in 2021:
Average Adjusted Gross Income (AGI) in 2020: $108,744 (Individual Income Tax Returns)
Here:
$108,744
State:
$95,910
Salary/wage: $76,878 (reported on 77.1% of returns)
Here:
$76,878
State:
$77,331
(% of AGI for various income ranges: 1307.0% for AGIs below $25k, 4021.7% for AGIs $25k-50k, 7376.9% for AGIs $50k-75k, 10870.0% for AGIs $75k-100k, 19012.7% for AGIs $100k-200k, 84708.4% for AGIs over 200k)
Taxable interest for individuals: $3,296 (reported on 44.0% of returns)
This zip code:
$3,296
California:
$2,294
(% of AGI for various income ranges: 34.5% for AGIs below $25k, 45.7% for AGIs $25k-50k, 81.6% for AGIs $50k-75k, 162.7% for AGIs $75k-100k, 336.6% for AGIs $100k-200k, 3126.6% for AGIs over 200k)
Ordinary dividends: $8,997 (reported on 32.3% of returns)
Here:
$8,997
State:
$10,949
(% of AGI for various income ranges: 64.2% for AGIs below $25k, 96.2% for AGIs $25k-50k, 190.9% for AGIs $50k-75k, 431.1% for AGIs $75k-100k, 844.6% for AGIs $100k-200k, 5556.4% for AGIs over 200k)
Net capital gain/loss in AGI: +$32,364 (reported on 31.0% of returns)
Here:
+$32,364
State:
+$49,306
(% of AGI for various income ranges: 37.6% for AGIs below $25k, 85.5% for AGIs $25k-50k, 147.3% for AGIs $50k-75k, 493.6% for AGIs $75k-100k, 1139.1% for AGIs $100k-200k, 29446.1% for AGIs over 200k)
Profit/loss from business: +$24,575 (reported on 19.1% of returns)
Here:
+$24,575
State:
+$15,671
(% of AGI for various income ranges: 167.2% for AGIs below $25k, 286.1% for AGIs $25k-50k, 478.4% for AGIs $50k-75k, 570.4% for AGIs $75k-100k, 1421.7% for AGIs $100k-200k, 7557.7% for AGIs over 200k)
Taxable individual retirement arrangement distribution: $26,695 (reported on 10.3% of returns)
93401:
$26,695
California:
$23,505
(% of AGI for various income ranges: 74.6% for AGIs below $25k, 122.3% for AGIs $25k-50k, 249.6% for AGIs $50k-75k, 434.2% for AGIs $75k-100k, 1195.8% for AGIs $100k-200k, 3684.5% for AGIs over 200k)
Self-employed (Keogh) retirement plans: $29,457 (reported on 1.9% of returns)
93401:
$29,457
California:
$30,163
(% of AGI for various income ranges: 18.9% for AGIs $25k-50k, 54.6% for AGIs $75k-100k, 104.4% for AGIs $100k-200k, 1400.5% for AGIs over 200k)
Total itemized deductions: $36,789 (reported on 18.7% of returns)
Here:
$36,789
State:
$39,517
(% of AGI for various income ranges: 126.8% for AGIs below $25k, 235.1% for AGIs $25k-50k, 554.5% for AGIs $50k-75k, 1126.2% for AGIs $75k-100k, 2728.4% for AGIs $100k-200k, 10649.1% for AGIs over 200k)
Charity contributions: $9,086 (reported on 15.1% of returns)
Here:
$9,086
State:
$12,598
(% of AGI for various income ranges: 5.0% for AGIs below $25k, 22.3% for AGIs $25k-50k, 37.5% for AGIs $50k-75k, 138.9% for AGIs $75k-100k, 369.1% for AGIs $100k-200k, 3200.7% for AGIs over 200k)
Taxes paid: $8,794 (reported on 18.7% of returns)
93401:
$8,794
State:
$8,807
(% of AGI for various income ranges: 23.8% for AGIs below $25k, 44.7% for AGIs $25k-50k, 123.7% for AGIs $50k-75k, 325.5% for AGIs $75k-100k, 765.9% for AGIs $100k-200k, 2248.2% for AGIs over 200k)
Earned income credit: $1,342 (reported on 7.3% of returns)
Here:
$1,342
State:
$2,074
(% of AGI for various income ranges: 39.0% for AGIs below $25k, 26.4% for AGIs $25k-50k)
Percentage of individuals using paid preparers for their 2020 taxes: 93.3%
Here:
93%
State:
92%
(% for various income ranges: 91.6% for AGIs below $25k, 92.8% for AGIs $25k-50k, 93.0% for AGIs $50k-75k, 94.3% for AGIs $75k-100k, 94.5% for AGIs $100k-200k, 96.0% for AGIs over 200k)
Averages for the 2012 tax year for zip code 93401, filed in 2013:
Average Adjusted Gross Income (AGI) in 2012: $76,017 (Individual Income Tax Returns)
Here:
$76,017
State:
$72,726
Salary/wage: $54,608 (reported on 78.9% of returns)
Here:
$54,608
State:
$59,079
(% of AGI for various income ranges: 78.7% for AGIs below $25k, 77.2% for AGIs $25k-50k, 68.7% for AGIs $50k-75k, 64.4% for AGIs $75k-100k, 63.7% for AGIs $100k-200k, 37.1% for AGIs over 200k)
Taxable interest for individuals: $2,747 (reported on 42.8% of returns)
This zip code:
$2,747
California:
$2,146
(% of AGI for various income ranges: 1.8% for AGIs below $25k, 1.2% for AGIs $25k-50k, 1.3% for AGIs $50k-75k, 1.5% for AGIs $75k-100k, 1.4% for AGIs $100k-200k, 1.8% for AGIs over 200k)
Ordinary dividends: $7,052 (reported on 27.9% of returns)
Here:
$7,052
State:
$9,308
(% of AGI for various income ranges: 2.5% for AGIs below $25k, 1.9% for AGIs $25k-50k, 2.5% for AGIs $50k-75k, 2.1% for AGIs $75k-100k, 2.3% for AGIs $100k-200k, 3.2% for AGIs over 200k)
Net capital gain/loss in AGI: +$23,580 (reported on 25.0% of returns)
Here:
+$23,580
State:
+$30,460
(% of AGI for various income ranges: 0.8% for AGIs $25k-50k, 1.8% for AGIs $50k-75k, 1.0% for AGIs $75k-100k, 2.1% for AGIs $100k-200k, 18.4% for AGIs over 200k)
Profit/loss from business: +$26,055 (reported on 18.3% of returns)
Here:
+$26,055
State:
+$17,064
(% of AGI for various income ranges: 8.7% for AGIs below $25k, 6.4% for AGIs $25k-50k, 4.9% for AGIs $50k-75k, 5.2% for AGIs $75k-100k, 5.6% for AGIs $100k-200k, 7.0% for AGIs over 200k)
Taxable individual retirement arrangement distribution: $18,759 (reported on 11.2% of returns)
93401:
$18,759
California:
$19,557
(% of AGI for various income ranges: 2.4% for AGIs below $25k, 2.0% for AGIs $25k-50k, 3.3% for AGIs $50k-75k, 4.0% for AGIs $75k-100k, 3.3% for AGIs $100k-200k, 2.2% for AGIs over 200k)
Self-employment retirement plans: $21,000 (reported on 1.9% of returns)
93401:
$21,000
California:
$24,530
(% of AGI for various income ranges: 0.4% for AGIs below $25k, 0.6% for AGIs $50k-75k, 0.6% for AGIs $100k-200k, 0.8% for AGIs over 200k)
Total itemized deductions: $33,802 (22% of AGI, reported on 35.6% of returns)
Here:
$33,802
State:
$34,004
Here:
21.7% of AGI
State:
22.7% of AGI
(% of AGI for various income ranges: 12.5% for AGIs below $25k, 9.7% for AGIs $25k-50k, 13.7% for AGIs $50k-75k, 17.0% for AGIs $75k-100k, 18.9% for AGIs $100k-200k, 16.3% for AGIs over 200k)
Charity contributions: $4,494 (reported on 29.9% of returns)
Here:
$4,494
State:
$4,659
(% of AGI for various income ranges: 0.6% for AGIs below $25k, 0.9% for AGIs $25k-50k, 1.5% for AGIs $50k-75k, 1.6% for AGIs $75k-100k, 2.2% for AGIs $100k-200k, 2.0% for AGIs over 200k)
Taxes paid: $14,637 (reported on 35.5% of returns)
93401:
$14,637
State:
$14,448
(% of AGI for various income ranges: 2.2% for AGIs below $25k, 2.0% for AGIs $25k-50k, 3.8% for AGIs $50k-75k, 5.7% for AGIs $75k-100k, 7.4% for AGIs $100k-200k, 9.7% for AGIs over 200k)
Earned income credit: $1,437 (reported on 10.0% of returns)
Here:
$1,437
State:
$2,286
(% of AGI for various income ranges: 2.5% for AGIs below $25k, 0.4% for AGIs $25k-50k)
Percentage of individuals using paid preparers for their 2012 taxes: 51.6%
Here:
52%
State:
64%
(% for various income ranges: 42.5% for AGIs below $25k, 43.6% for AGIs $25k-50k, 53.8% for AGIs $50k-75k, 60.3% for AGIs $75k-100k, 68.1% for AGIs $100k-200k, 81.1% for AGIs over 200k)
Averages for the 2004 tax year for zip code 93401, filed in 2005:
Average Adjusted Gross Income (AGI) in 2004: $58,894 (Individual Income Tax Returns)
Here:
$58,894
State:
$58,600
Salary/wage: $42,775 (reported on 78.4% of returns)
Here:
$42,775
State:
$49,455
(% of AGI for various income ranges: 2582.4% for AGIs below $10k, 73.6% for AGIs $10k-25k, 75.4% for AGIs $25k-50k, 66.1% for AGIs $50k-75k, 65.1% for AGIs $75k-100k, 44.6% for AGIs over 100k)
Taxable interest for individuals: $3,345 (reported on 54.2% of returns)
This zip code:
$3,345
California:
$2,365
(% of AGI for various income ranges: 357.0% for AGIs below $10k, 3.2% for AGIs $10k-25k, 2.6% for AGIs $25k-50k, 2.5% for AGIs $50k-75k, 2.9% for AGIs $75k-100k, 2.9% for AGIs over 100k)
Taxable dividends: $4,482 (reported on 33.9% of returns)
Here:
$4,482
State:
$4,746
(% of AGI for various income ranges: 166.3% for AGIs below $10k, 2.5% for AGIs $10k-25k, 1.8% for AGIs $25k-50k, 2.4% for AGIs $50k-75k, 2.3% for AGIs $75k-100k, 2.7% for AGIs over 100k)
Net capital gain/loss: +$27,330 (reported on 30.2% of returns)
Here:
+$27,330
State:
+$23,418
(% of AGI for various income ranges: 407.5% for AGIs below $10k, 0.1% for AGIs $10k-25k, 1.4% for AGIs $25k-50k, 2.1% for AGIs $50k-75k, 2.4% for AGIs $75k-100k, 22.5% for AGIs over 100k)
Profit/loss from business: +$23,644 (reported on 18.3% of returns)
Here:
+$23,644
State:
+$16,826
(% of AGI for various income ranges: 41.2% for AGIs below $10k, 8.2% for AGIs $10k-25k, 5.6% for AGIs $25k-50k, 6.7% for AGIs $50k-75k, 7.1% for AGIs $75k-100k, 7.8% for AGIs over 100k)
IRA payment deduction: $3,208 (reported on 3.4% of returns)
93401:
$3,208
California:
$3,192
(% of AGI for various income ranges: 10.4% for AGIs below $10k, 0.3% for AGIs $10k-25k, 0.3% for AGIs $25k-50k, 0.3% for AGIs $50k-75k, 0.3% for AGIs $75k-100k, 0.1% for AGIs over 100k)
Self-employed pension: $17,805 (reported on 2.6% of returns)
Here:
$17,805
California:
$17,688
(% of AGI for various income ranges: 0.3% for AGIs $10k-25k, 0.2% for AGIs $25k-50k, 0.4% for AGIs $50k-75k, 0.6% for AGIs $75k-100k, 1.1% for AGIs over 100k)
Total itemized deductions: $29,267 (24% of AGI, reported on 36.3% of returns)
Here:
$29,267
State:
$28,113
Here:
23.5% of AGI
State:
25.3% of AGI
(% of AGI for various income ranges: 403.1% for AGIs below $10k, 10.9% for AGIs $10k-25k, 13.7% for AGIs $25k-50k, 19.8% for AGIs $50k-75k, 22.2% for AGIs $75k-100k, 18.3% for AGIs over 100k)
Charity contributions deductions: $3,666 (3% of AGI, reported on 32.5% of returns)
Here:
$3,666
State:
$3,923
Here:
2.8% of AGI
State:
3.3% of AGI
(% of AGI for various income ranges: 15.0% for AGIs below $10k, 0.9% for AGIs $10k-25k, 1.3% for AGIs $25k-50k, 2.0% for AGIs $50k-75k, 2.4% for AGIs $75k-100k, 2.2% for AGIs over 100k)
Total tax: $10,754 (reported on 79.3% of returns)
93401:
$10,754
State:
$10,761
(% of AGI for various income ranges: 94.5% for AGIs below $10k, 5.5% for AGIs $10k-25k, 8.3% for AGIs $25k-50k, 10.2% for AGIs $50k-75k, 10.5% for AGIs $75k-100k, 18.4% for AGIs over 100k)
Earned income credit: $1,152 (reported on 8.6% of returns)
Here:
$1,152
State:
$1,763
Percentage of individuals using paid preparers for their 2004 taxes: 55.1%
Here:
55%
State:
66%
(% for various income ranges: 44.3% for AGIs below $10k, 50.1% for AGIs $10k-25k, 51.1% for AGIs $25k-50k, 61.2% for AGIs $50k-75k, 66.9% for AGIs $75k-100k, 75.6% for AGIs over 100k)
Likely homosexual households (counted as self-reported same-sex unmarried-partner households)
Lesbian couples: 0.1% of all households
Gay men: 0.3% of all households
Household received Food Stamps/SNAP in the past 12 months: 753 Household did not receive Food Stamps/SNAP in the past 12 months: 12,073
Women who had a birth in the past 12 months: 170 (143 now married, 26 unmarried) Women who did not have a birth in the past 12 months: 7,269 (2,359 now married, 4,932 unmarried)
Housing units in zip code 93401 with a mortgage: 3,553 (271 second mortgage, 274 both second mortgage and home equity loan) Median monthly owner costs for units with a mortgage: $2,999 Median monthly owner costs for units without a mortgage: $792
Residents with income below the poverty level in 2022:
This zip code:
15.0%
Whole state:
12.2%
Residents with income below 50% of the poverty level in 2022:
This zip code:
6.7%
Whole state:
6.2%
Median number of rooms in houses and condos:
Here:
5.9
State:
6.0
Median number of rooms in apartments:
Here:
3.8
State:
3.9
Notable locations in this zip code not listed on our city pages
Notable locations in zip code 93401: Edna Valley Winery (A), Cold Canyon Landfill (B), Upper Lopez Campground (C), San Luis Obispo Golf and Country Club (D), Dallidet Adobe (E), Veterans Memorial Building (F), Taylor Gymnasium (G), San Luis Obispo County Courthouse (H), San Luis Obispo Historical Museum (I), San Luis Obispo County Law Library (J), San Luis Obispo City Hall (K), Main Library San Luis Obispo City-County Library (L), San Luis Ambulance Service Headquarters (M), San Luis Obispo City Fire Department Station 3 (N), California Department of Forestry and Fire Protection Station 21 San Luis Obispo Airport (O), San Luis Obispo City Fire Department Station 1 (P). Display/hide their locations on the map
Churches in zip code 93401 include: The Church of Jesus Christ of Latter Day Saints (A), First Baptist Church (B), Grace Church (C), Meridian Fellowship Church (D), Unity Christ Church (E), Vineyard Christian Fellowship Church (F), Calvary Chapel (G), Church of Christ (H), Church of the Nazarene (I). Display/hide their locations on the map
Creeks: West Corral de Piedra Creek (A), Villa Creek (B), East Corral de Piedra Creek (C), Davenport Creek (D), Stenner Creek (E), Prefumo Creek (F). Display/hide their locations on the map
Parks in zip code 93401 include: Hawthorne Park (1), Johnson Park (2), Meadow Park (3), Mission Plaza (4), Mitchell Park (5), San Luis Obispo Baseball Stadium (6), Sinsheimer Park (7), Triangle Park (8), E A French Park (9). Display/hide their locations on the map
3,043 married couples with children.
832 single-parent households (206 men, 626 women).
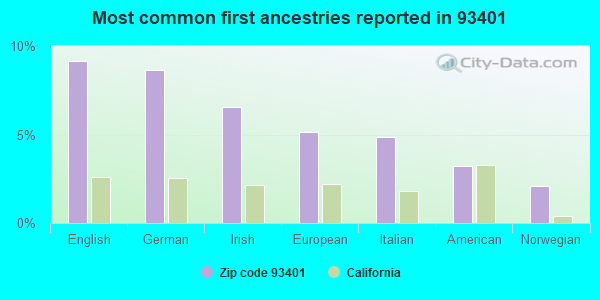
83.4% of residents of 93401 zip code speak English at home.
10.3% of residents speak Spanish at home (75% very well, 10% well, 13% not well, 3% not at all).
2.7% of residents speak other Indo-European language at home (87% very well, 8% well, 4% not well, 1% not at all).
2.6% of residents speak Asian or Pacific Island language at home (71% very well, 14% well, 14% not well, 1% not at all).
0.4% of residents speak other language at home (100% very well).
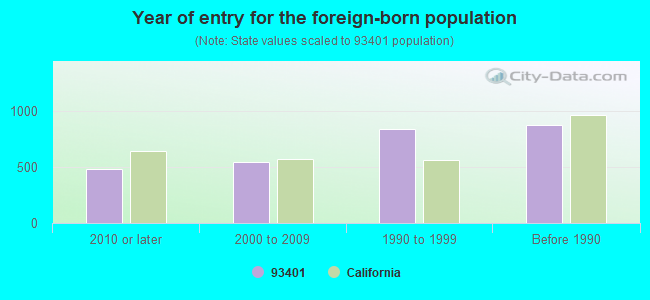
Foreign born population: 2,523 (8.8%) (55.4% of them are naturalized citizens)
Major facilities with environmental interests located in this zip code:
CALIFORNIA POLYTECHNIC STATE UNIVERSITY (1 GRAND AVENUE in SAN LUIS OBISPO, CA)
AIR SYNTHETIC MINOR (AIRS/AFS) STATE MASTER (California - Hazardous Waste Tracking) - HAZARDOU WASTE PROGRAM HAZARDOUS WASTE BIENNIAL REPORTER (Resource Conservation and Recovery Act (tracking hazardous waste)) - ICIS-, ENFORCEMENT/COMPLIANCE ACTIVITY Large Quantity Generators, more that 1000 kg of hazardous waste/month (Resource Conservation and Recovery Act (tracking hazardous waste)) - ICIS-, ENFORCEMENT/COMPLIANCE ACTIVITY Business SIC classification: COLLEGES, UNIVERSITIES, AND PROFESSIONAL SCHOOLS Organizations: STATE OF CALIFORNIA, CSU SYSTEM (CONTACT/OPERATOR)
, CHANCELLOR OF THE CSU SYSTEM (CONTACT/OWNER)
Alternative names: CA POLY STATE, CAL POLY STATE UNIVERSITY
CB&I CONSTRUCTORS, INC. (4388 SANTA FE RD in SAN LUIS OBISPO, CA) . Federal Facility
STATE MASTER (California - Hazardous Waste Tracking) - HAZARDOU WASTE PROGRAM CRITERIA AND HAZARDOUS AIR POLLUTANT INVENTORY (Inventory of air pollution sources) Large Quantity Generators, more that 1000 kg of hazardous waste/month (Resource Conservation and Recovery Act (tracking hazardous waste)) - ICIS-, ENFORCEMENT/COMPLIANCE ACTIVITY Business SIC classification: SHEET METALWORK Business NAICS classification: PLATE WORK MANUFACTURING. Organizations: ROY COFFMAN (CONTACT/OPERATOR)
, C B AND I CONSTRUCTORS (CONTACT/OWNER)
Alternative names: C B AND I TRUSCO TANK
CHEVRON STATION NO 90150 (328 MARSH ST in SAN LUIS OBISPO, CA)
STATE MASTER (California - Hazardous Waste Tracking) - HAZARDOU WASTE PROGRAM CRITERIA AND HAZARDOUS AIR POLLUTANT INVENTORY (Inventory of air pollution sources) Large Quantity Generators, more that 1000 kg of hazardous waste/month (Resource Conservation and Recovery Act (tracking hazardous waste)) Business SIC classification: GASOLINE SERVICE STATIONS Organizations: CHEVRON PRODUCTS CO. (CONTACT/OPERATOR)
Alternative names: CHEVRON STATION #90150
ERNIE BALL, INC (151 SUBURBAN ROAD in SAN LUIS OBISPO, CA)
STATE MASTER (California - Hazardous Waste Tracking) - HAZARDOU WASTE PROGRAM COMPLIANCE ACTIVITY (Tracking inspections of insecticide, fungicide, and rodenticide, and toxic substances) CRITERIA AND HAZARDOUS AIR POLLUTANT INVENTORY (Inventory of air pollution sources) Small Quantity Generators, between 100 kg and 1000 kg of hazardous waste/month (Resource Conservation and Recovery Act (tracking hazardous waste)) - notification Business SIC classification: MUSICAL INSTRUMENTS Business NAICS classification: MUSICAL INSTRUMENT MANUFACTURING. Organizations: ROLAND S. BALL (CONTACT/OWNER)
CHEVRON STATION 94453 (1525 CALLE JOAQUIN in SAN LUIS OBISPO, CA)
STATE MASTER (California - Hazardous Waste Tracking) - HAZARDOU WASTE PROGRAM Small Quantity Generators, between 100 kg and 1000 kg of hazardous waste/month (Resource Conservation and Recovery Act (tracking hazardous waste)) - notification Organizations: CHEVRON U S A PRODUCTS CO (CONTACT/OWNER)
Alternative names: CHEVRON 94453
GOLDEN STATE PROPELLER INC (981 AIRPORT DR in SAN LUIS OBISPO, CA)
STATE MASTER (California - Hazardous Waste Tracking) - HAZARDOU WASTE PROGRAM Small Quantity Generators, between 100 kg and 1000 kg of hazardous waste/month (Resource Conservation and Recovery Act (tracking hazardous waste)) - notification Organizations: ERIC STRUVE (CONTACT/OWNER)
EQUILON ENTERPRISES (1101 MONTEREY in SAN LUIS OBISPO, CA) . Federal Facility
STATE MASTER (California - Hazardous Waste Tracking) - HAZARDOU WASTE PROGRAM Small Quantity Generators, between 100 kg and 1000 kg of hazardous waste/month (Resource Conservation and Recovery Act (tracking hazardous waste)) - notification Organizations: EQUILON ENTERPRISES L L C (CONTACT/OWNER)
Alternative names: SHELL OIL CO
MAINLAND MACHINE (2930 MCMILLIAN RD UNIT E in SAN LUIS OBISPO, CA)
STATE MASTER (California - Hazardous Waste Tracking) - HAZARDOU WASTE PROGRAM Small Quantity Generators, between 100 kg and 1000 kg of hazardous waste/month (Resource Conservation and Recovery Act (tracking hazardous waste)) - notification Organizations: MARK W AMES (CONTACT/OWNER)
CALZYME LABS, INC (3443 MIGUELITO CT in SAN LUIS OBISPO, CA)
STATE MASTER (California - Hazardous Waste Tracking) - HAZARDOU WASTE PROGRAM Small Quantity Generators, between 100 kg and 1000 kg of hazardous waste/month (Resource Conservation and Recovery Act (tracking hazardous waste))
CHEVRON STATION NO 98169 (3180 BROAD ST in SAN LUIS OBISPO, CA)
STATE MASTER (California - Hazardous Waste Tracking) - HAZARDOU WASTE PROGRAM Small Quantity Generators, between 100 kg and 1000 kg of hazardous waste/month (Resource Conservation and Recovery Act (tracking hazardous waste)) - notification Organizations: CHEVRON PRODUCTS CO (CONTACT/OWNER)
LOS RANCHOS ELEMENTARY (5785 LOS RANCHOS ROAD in SAN LUIS OBISPO, CA)
(National Center for Education Statistics) - STATE ID-6043244 Organizations: SAN LUIS COASTAL UNIFIED (SCHOOL DISTRICT)
MOORE WALLACE NORTH AMERICA, INC. (3650 SACRAMENTO DR in SAN LUIS OBISPO, CA) . Federal Facility
STATE MASTER (California - Hazardous Waste Tracking) - HAZARDOU WASTE PROGRAM CRITERIA AND HAZARDOUS AIR POLLUTANT INVENTORY (Inventory of air pollution sources) Business SIC classification: COMMERCIAL PRINTING, LITHOGRAPHIC Alternative names: WALLACE COMPUTER SERVICES
HAWTHORNE ELEMENTARY (2125 STORY ST. in SAN LUIS OBISPO, CA)
(National Center for Education Statistics) - STATE ID-6043236 Organizations: SAN LUIS COASTAL UNIFIED (SCHOOL DISTRICT)
Housing units lacking complete plumbing facilities: 0.3% Housing units lacking complete kitchen facilities: 2.9%
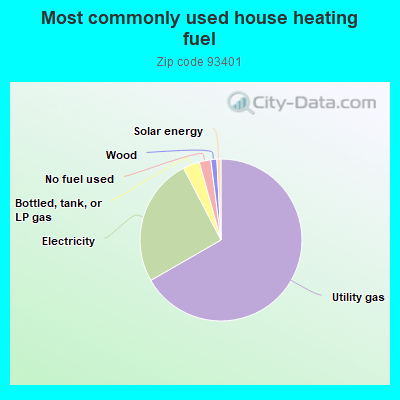
66.5%Utility gas
25.6%Electricity
3.3%Bottled, tank, or LP gas
2.3%No fuel used
1.2%Wood
0.8%Solar energy
Population in 1990: 24,638. Population change in the 1990s: +2,396 (+9.7%).
Place of birth for U.S.-born residents:
This state: 19,524
Northeast: 1,277
Midwest: 2,159
South: 1,379
West: 1,322
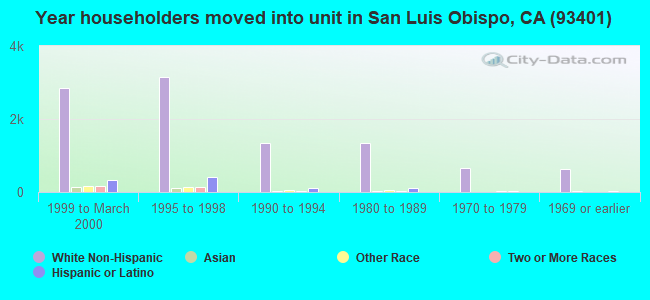
41% of the 93401 zip code residents lived in the same house 5 years ago. Out of people who lived in different houses, 47% lived in this county. Out of people who lived in different counties, 50% lived in California.
86% of the 93401 zip code residents lived in the same house 1 year ago. Out of people who lived in different houses, 51% moved from this county. Out of people who lived in different houses, 27% moved from different county within same state. Out of people who lived in different houses, 13% moved from different state. Out of people who lived in different houses, 7% moved from abroad.
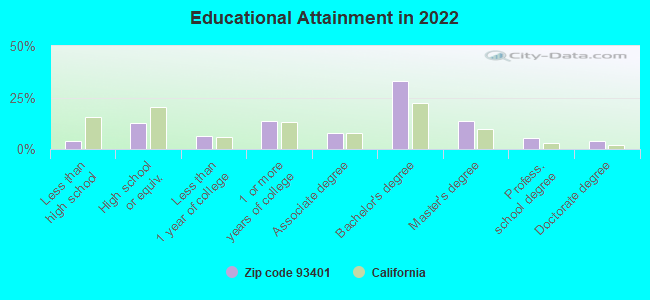
Private vs. public school enrollment:
Students in private schools in grades 1 to 8 (elementary and middle school): 139
Here:
7.5%
California:
10.5%
Students in private schools in grades 9 to 12 (high school): 91
Here:
10.3%
California:
8.5%
Students in private undergraduate colleges: 62
Here:
1.6%
California:
15.9%
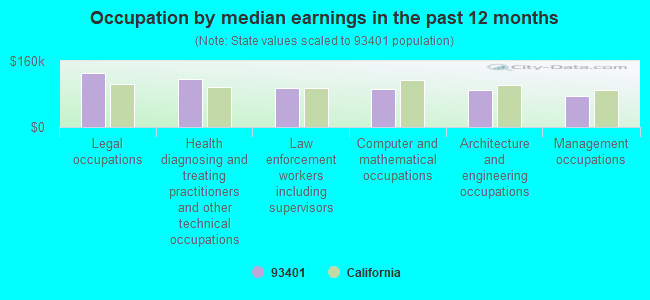
Occupation by median earnings in the past 12 months ($)
131,729Legal occupations
116,514Health diagnosing and treating practitioners and other technical occupations
94,372Law enforcement workers including supervisors
92,575Computer and mathematical occupations
89,192Architecture and engineering occupations
75,999Management occupations
Companies with biggest federal contracts located in this zip code (SAN LUIS OBISP, CA):
CDM TECHNOLOGIES, INC (2975 MCMILLAN AVE; small business) : $31,588,781 in 87 contractsfrom 1999 to 2006
Contracts for ADP Systems Development Services, Engineering -- Applied Research and Exploratory Development (R&D), Automated Information System Design and Integration Services, Other ADP and Telecommunications Services (includes data storage on tapes, compact disks, etc.), and moreby Army, Navy, Federal Technology Service, Department of Defense, and others Signed by year:2000: $1,604,333; 2001: $0; 2002: $5,921,669; 2003: $6,148,790; 2004: $5,730,399; 2005: $9,296,440; 2006: $2,237,150.
Biggest contracts:
$3,398,100 with Army for ADP Systems Development Services. Signed on 2005-09-27. Completion date: 2006-09-28.
$1,299,666 with Navy for Engineering -- Applied Research and Exploratory Development (R&D). Signed on 2004-05-11. Completion date: 2004-12-31.
$1,215,000 with Army for ADP Systems Development Services. Signed on 2005-03-11. Completion date: 2005-03-11.
$1,097,480, same as above.Signed on 2003-06-24. Completion date: 2004-04-15.
TETRA TECH INC ISG-1 (811 PALM ST) : $1,372,620 in 10 contractsfrom 2005 to 2006
Contracts for Architect - Engineer Services (including landscaping, interior layout, and designing) by Navy Signed by year:2000: $0; 2001: $0; 2002: $0; 2003: $0; 2004: $0; 2005: $1,158,837; 2006: $213,783.
Biggest contracts:
$567,870 with Navy for Architect - Engineer Services (including landscaping, interior layout, and designing). Signed on 2005-10-25. Completion date: 2007-01-23.
$233,274, same as above.Signed on 2005-12-22. Completion date: 2006-06-01.
$159,667, same as above.Signed on 2005-09-30. Completion date: 2007-01-23.
$153,715, same as above.Signed on 2006-03-09. Completion date: 2006-09-15.
GLACIER ICE CO (130 HIGH ST; small business) : $227,840 in 12 contractsfrom 2001 to 2005
Contracts for Food Services, Food Items For Resale, Condiments and Related Products, Miscellaneous Items, and moreby Army, Defense Commissary Agency Signed by year:2000: $0; 2001: $72,000; 2002: $0; 2003: $91,917; 2004: $59,941; 2005: $3,982; 2006: $0.
Biggest contracts:
$89,194 with Army for Food Services. Signed on 2003-05-06. Completion date: 2003-06-27.
$72,000, same as above.Signed on 2001-06-05. Completion date: 2001-08-11.
$24,198 with Army for Food Items For Resale. Signed on 2004-04-23. Completion date: 2004-05-08.
$20,869 with Army for Condiments and Related Products. Signed on 2004-05-28. Completion date: 2004-06-14.
ZYMAX ENVIROTECHNOLOGY, INC (71 ZACA LANE; small business) : $206,250 in 20 contractsfrom 1999 to 2004
Contracts for Equipment and Materials Testing -- Chemicals and Chemical Products, Purchase of Structures and Facilities -- Miscellaneous Buildings by Geological Survey, Army Signed by year:2000: $44,000; 2001: $47,000; 2002: $82,935; 2003: $25,560; 2004: -$5,245; 2005: $0; 2006: $0.
Biggest contracts:
$50,000 with Geological Survey for Equipment and Materials Testing -- Chemicals and Chemical Products. Signed on 2002-01-15. Completion date: 2003-01-15.
$45,000, same as above.Signed on 2001-02-15. Completion date: 2002-01-15.
$41,000, same as above.Signed on 2000-02-15. Completion date: 2002-12-15.
$20,000, same as above.Signed on 2002-08-15. Completion date: 2003-01-15.
THE ENVIRONMENTAL COLLABORATIV (3320 BULLOCK LN; small business) : $199,697 in 10 contractsfrom 2000 to 2005
Contracts for Other Architect and Engineering Services by Air Force Signed by year:2000: $82,809; 2001: $111,888; 2002: $0; 2003: $0; 2004: $0; 2005: $5,000; 2006: $0.
Biggest contracts:
$79,579 with Air Force for Other Architect and Engineering Services. Signed on 2001-02-28. Completion date: 2001-09-30.
$53,674, same as above.Signed on 2000-04-12. Completion date: 2000-08-04.
$26,360, same as above.Signed on 2001-03-23. Completion date: 2001-05-25.
$15,403, same as above.Signed on 2000-03-29. Completion date: 2000-07-27.
CRAVEN, MARTIN D DDS MD (1872 SAN LUIS DR; small business) : $163,200 in 7 contractsfrom 2000 to 2005
Contracts for Dentistry Services by Air Force Signed by year:2000: $25,200; 2001: $25,200; 2002: $26,400; 2003: $27,600; 2004: $27,600; 2005: $31,200; 2006: $0.
Biggest contracts:
$30,000 with Air Force for Dentistry Services. Signed on 2005-10-01. Completion date: 2006-09-30.
$27,600, same as above.Signed on 2004-10-01. Completion date: 2005-09-30.
$27,600, same as above.Signed on 2003-10-01. Completion date: 2004-09-30.
$26,400, same as above.Signed on 2002-10-01. Completion date: 2003-09-30.
KNECHT S PLUMBING & HEATING, I (60 ZACA LANE; small business) : $156,942 in 3 contractsfrom 2000 to 2003
$99,000 with Army for Maintenance, Repair or Alteration of Real Property -- Office Buildings. Signed on 2003-03-18. Completion date: 2003-05-29.
$54,996 with Army for Maintenance, Repair or Alteration of Real Property -- Other Non-Building Facilities. Signed on 2000-08-24. Completion date: 2000-12-02.
$2,946 with Army for Air Conditioning Equipment. Signed on 2003-06-09. Completion date: 2003-06-05.
FST CONSULTING INTERNATIONAL, (4175 SANTA FE RD; small business) : $152,000 in 4 contractsfrom 2002 to 2005
$65,000 with Navy for Miscellaneous Items. Signed on 2005-04-18. Completion date: 2005-05-26.
$58,000 with National Institute of Standards and Technology for Construction of Structures and Facilities -- Other Administrative Facilities and Service Buildings. Taking place in AZ. Signed on 2002-09-15. Completion date: 2002-09-15.
$23,000 with U.S. Fish and Wildlife Service for Telecommunications Network Management Services. Taking place in AZ. Signed on 2003-09-15. Completion date: 2003-10-15.
$6,000 with Navy for Maintenance, Repair and Rebuilding of Equipment -- Communication, Detection, and Coherent Radiation Equipment. Signed on 2005-01-20. Completion date: 2005-02-10.
DAVID DUBBINK ASSOC (864 OSOS STREET; small business) : $133,367 in 5 contractsfrom 2003 to 2006
Contracts for Other Defense -- Applied Research and Exploratory Development (R&D), Maintenance, Repair and Rebuilding of Equipment -- Automatic Data Processing Equipment (Including Firmware), Software, Supplies and Support Equipment, ADP Software by Air Force, Army, Federal Highway Administration Signed by year:2000: $0; 2001: $0; 2002: $0; 2003: $61,137; 2004: $0; 2005: $72,230; 2006: $0.
Biggest contracts:
$61,137 with Air Force for Other Defense -- Applied Research and Exploratory Development (R&D). Signed on 2003-02-05. Completion date: 1999-09-03.
$54,330 with Army for Maintenance, Repair and Rebuilding of Equipment -- Automatic Data Processing Equipment (Including Firmware), Software, Supplies and Support Equipment. Taking place in MD. Signed on 2005-09-23. Completion date: 2005-12-31.
$17,900 with Federal Highway Administration for ADP Software. Taking place in VA. Signed on 2005-02-17. Completion date: 2005-06-10.
$0 with Army for Maintenance, Repair and Rebuilding of Equipment -- Automatic Data Processing Equipment (Including Firmware), Software, Supplies and Support Equipment. Signed on 2006-05-23. Completion date: 2006-09-30.
RJI SOLUTIONS, INC (1635 KNOLL DRIVE; small business)
$114,900 with Air Force for Navigational Instruments. Signed on 2003-09-26. Completion date: 2003-12-31.
Top industries in this zip code by the number of employees in 2005:
Utilities: Electric Power Distribution (over 1000 employees: 1 establishment)
Health Care and Social Assistance: General Medical and Surgical Hospitals (500-999: 1, 250-499: 2)
2005 - 2018 National Fire Incident Reporting System (NFIRS) incidents
According to the data from the years 2005 - 2018 the average number of fire incidents per year is 51. The highest number of fire incidents - 113 took place in 2018, and the least - 20 in 2012. The data has a rising trend.
When looking into fire subcategories, the most incidents belonged to: Outside Fires (42.1%), and Structure Fires (33.9%).
Fire incident types reported to NFIRS in Zip Code 93401


 Nearest zip codes: 93410, 93449, 93433, 93424, 93405, 93420.
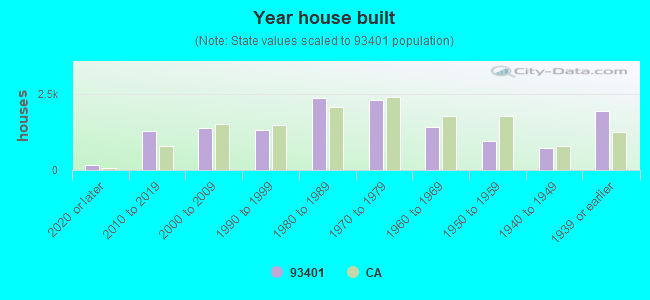


 According to the data from the years 2005 - 2018 the average number of fire incidents per year is 51. The highest number of fire incidents - 113 took place in 2018, and the least - 20 in 2012. The data has a rising trend.
 When looking into fire subcategories, the most incidents belonged to: Outside Fires (42.1%), and Structure Fires (33.9%).