Estimated zip code population in 2022: 59,292 Zip code population in 2010: 55,431 Zip code population in 2000: 43,676
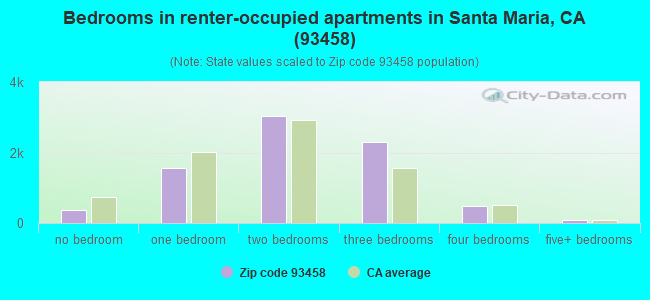
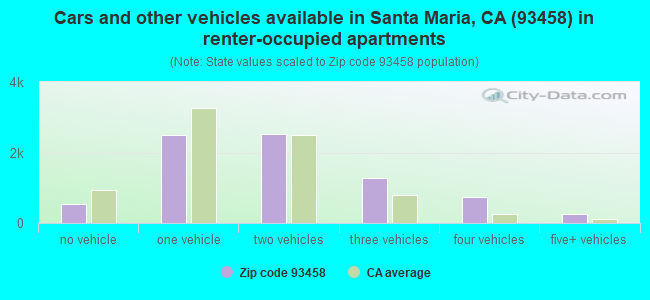
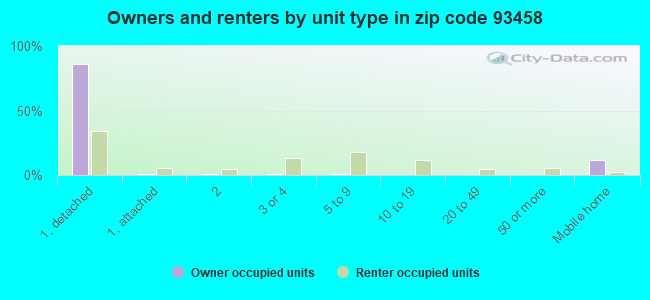
Houses and condos: 14,505 Renter-occupied apartments: 7,856
% of renters here:
56%
State:
44%
March 2022 cost of living index in zip code 93458: 109.6 (more than average, U.S. average is 100)
Land area: 27.4 sq. mi. Water area: 0.5 sq. mi.
Population density: 2,166 people per square mile
(low).
OSM Map
General Map
Google Map
MSN Map
OSM Map
General Map
Google Map
MSN Map
OSM Map
General Map
Google Map
MSN Map
OSM Map
General Map
Google Map
MSN Map
Please wait while loading the map...
Real estate property taxes paid for housing units in 2022:
This zip code:
0.6% ($2,646)
California:
0.7% ($4,831)
Median real estate property taxes paid for housing units with mortgages in 2022: $2,985 (0.6%) Median real estate property taxes paid for housing units with no mortgage in 2022: $1,958 (0.5%)
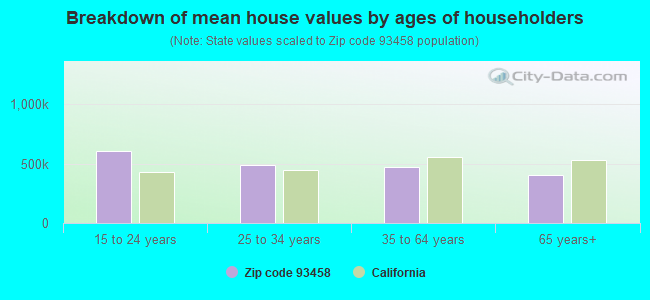
Estimated median house/condo value in 2022: $458,011
93458:
$458,011
California:
$715,900
According to our research of California and other state lists, there were 60 registered sex offenders living in 93458 zip code as of April 27, 2024. The ratio of all residents to sex offenders in zip code 93458 is 959 to 1. The ratio of registered sex offenders to all residents in this zip code is lower than the state average.
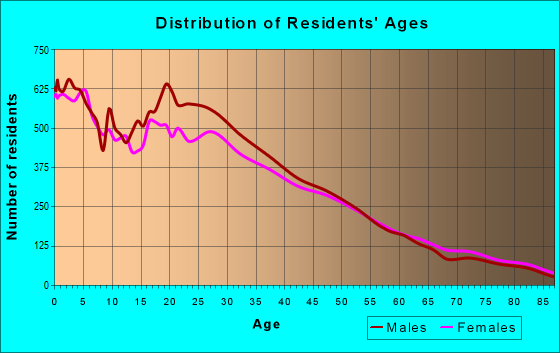
Median resident age:
This zip code:
26.8 years
California median age:
37.9 years
Average household size:
This zip code:
4.2 people
California:
2.8 people
Averages for the 2020 tax year for zip code 93458, filed in 2021:
Average Adjusted Gross Income (AGI) in 2020: $39,373 (Individual Income Tax Returns)
Here:
$39,373
State:
$95,910
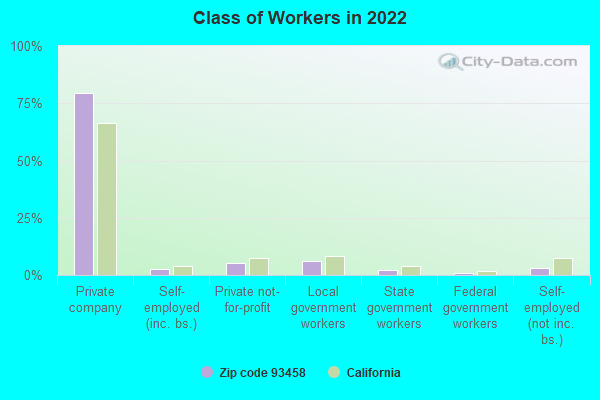
Salary/wage: $36,261 (reported on 91.8% of returns)
Here:
$36,261
State:
$77,331
(% of AGI for various income ranges: 2142.7% for AGIs below $25k, 5293.5% for AGIs $25k-50k, 8828.3% for AGIs $50k-75k, 12012.6% for AGIs $75k-100k, 19566.2% for AGIs $100k-200k, 60013.3% for AGIs over 200k)
Taxable interest for individuals: $299 (reported on 17.2% of returns)
This zip code:
$299
California:
$2,294
(% of AGI for various income ranges: 4.4% for AGIs below $25k, 3.2% for AGIs $25k-50k, 14.3% for AGIs $50k-75k, 17.2% for AGIs $75k-100k, 59.7% for AGIs $100k-200k, 206.7% for AGIs over 200k)
Ordinary dividends: $1,680 (reported on 3.1% of returns)
Here:
$1,680
State:
$10,949
(% of AGI for various income ranges: 5.2% for AGIs below $25k, 3.9% for AGIs $25k-50k, 14.1% for AGIs $50k-75k, 27.8% for AGIs $75k-100k, 36.8% for AGIs $100k-200k, 283.3% for AGIs over 200k)
Net capital gain/loss in AGI: +$4,038 (reported on 3.5% of returns)
Here:
+$4,038
State:
+$49,306
(% of AGI for various income ranges: 2.4% for AGIs below $25k, 0.7% for AGIs $25k-50k, 9.9% for AGIs $50k-75k, 29.0% for AGIs $75k-100k, 209.0% for AGIs $100k-200k, 5650.0% for AGIs over 200k)
Profit/loss from business: +$11,960 (reported on 8.0% of returns)
Here:
+$11,960
State:
+$15,671
(% of AGI for various income ranges: 102.1% for AGIs below $25k, 90.1% for AGIs $25k-50k, 205.0% for AGIs $50k-75k, 487.0% for AGIs $75k-100k, 834.9% for AGIs $100k-200k)
Taxable individual retirement arrangement distribution: $12,709 (reported on 1.7% of returns)
93458:
$12,709
California:
$23,505
(% of AGI for various income ranges: 14.5% for AGIs below $25k, 14.2% for AGIs $25k-50k, 45.1% for AGIs $50k-75k, 106.5% for AGIs $75k-100k, 320.6% for AGIs $100k-200k)
Total itemized deductions: $26,776 (reported on 5.1% of returns)
Here:
$26,776
State:
$39,517
(% of AGI for various income ranges: 38.7% for AGIs below $25k, 123.8% for AGIs $25k-50k, 338.3% for AGIs $50k-75k, 767.9% for AGIs $75k-100k, 1565.4% for AGIs $100k-200k, 5890.0% for AGIs over 200k)
Charity contributions: $5,041 (reported on 3.6% of returns)
Here:
$5,041
State:
$12,598
(% of AGI for various income ranges: 2.4% for AGIs below $25k, 20.1% for AGIs $25k-50k, 39.2% for AGIs $50k-75k, 83.5% for AGIs $75k-100k, 223.7% for AGIs $100k-200k, 1060.0% for AGIs over 200k)
Taxes paid: $6,637 (reported on 5.1% of returns)
93458:
$6,637
State:
$8,807
(% of AGI for various income ranges: 5.6% for AGIs below $25k, 19.9% for AGIs $25k-50k, 80.0% for AGIs $50k-75k, 218.7% for AGIs $75k-100k, 490.1% for AGIs $100k-200k, 1453.3% for AGIs over 200k)
Earned income credit: $2,334 (reported on 18.4% of returns)
Here:
$2,334
State:
$2,074
(% of AGI for various income ranges: 114.8% for AGIs below $25k, 85.5% for AGIs $25k-50k, 2.2% for AGIs $50k-75k)
Percentage of individuals using paid preparers for their 2020 taxes: 87.7%
Here:
88%
State:
92%
(% for various income ranges: 86.3% for AGIs below $25k, 87.0% for AGIs $25k-50k, 89.7% for AGIs $50k-75k, 91.7% for AGIs $75k-100k, 92.9% for AGIs $100k-200k, 100.0% for AGIs over 200k)
Averages for the 2012 tax year for zip code 93458, filed in 2013:
Average Adjusted Gross Income (AGI) in 2012: $29,597 (Individual Income Tax Returns)
Here:
$29,597
State:
$72,726
Salary/wage: $27,707 (reported on 93.7% of returns)
Here:
$27,707
State:
$59,079
(% of AGI for various income ranges: 90.5% for AGIs below $25k, 90.7% for AGIs $25k-50k, 86.6% for AGIs $50k-75k, 83.9% for AGIs $75k-100k, 81.0% for AGIs $100k-200k, 33.7% for AGIs over 200k)
Taxable interest for individuals: $512 (reported on 14.2% of returns)
This zip code:
$512
California:
$2,146
(% of AGI for various income ranges: 0.1% for AGIs below $25k, 0.2% for AGIs $25k-50k, 0.3% for AGIs $50k-75k, 0.3% for AGIs $75k-100k, 0.4% for AGIs $100k-200k, 2.7% for AGIs over 200k)
Ordinary dividends: $3,258 (reported on 2.9% of returns)
Here:
$3,258
State:
$9,308
(% of AGI for various income ranges: 0.2% for AGIs below $25k, 0.2% for AGIs $25k-50k, 0.4% for AGIs $50k-75k, 0.5% for AGIs $75k-100k, 0.8% for AGIs $100k-200k)
Net capital gain/loss in AGI: +$2,475 (reported on 2.4% of returns)
Here:
+$2,475
State:
+$30,460
(% of AGI for various income ranges: 0.2% for AGIs $50k-75k, 0.2% for AGIs $75k-100k, 2.0% for AGIs $100k-200k)
Profit/loss from business: +$10,382 (reported on 7.0% of returns)
Here:
+$10,382
State:
+$17,064
(% of AGI for various income ranges: 3.1% for AGIs below $25k, 1.9% for AGIs $25k-50k, 2.1% for AGIs $50k-75k, 2.2% for AGIs $75k-100k, 3.6% for AGIs $100k-200k)
Taxable individual retirement arrangement distribution: $10,164 (reported on 2.3% of returns)
93458:
$10,164
California:
$19,557
(% of AGI for various income ranges: 0.4% for AGIs below $25k, 0.5% for AGIs $25k-50k, 0.9% for AGIs $50k-75k, 1.6% for AGIs $75k-100k, 2.1% for AGIs $100k-200k)
Total itemized deductions: $19,442 (31% of AGI, reported on 13.6% of returns)
Here:
$19,442
State:
$34,004
Here:
30.5% of AGI
State:
22.7% of AGI
(% of AGI for various income ranges: 2.8% for AGIs below $25k, 6.2% for AGIs $25k-50k, 14.7% for AGIs $50k-75k, 18.2% for AGIs $75k-100k, 18.4% for AGIs $100k-200k, 15.7% for AGIs over 200k)
Charity contributions: $1,973 (reported on 10.2% of returns)
Here:
$1,973
State:
$4,659
(% of AGI for various income ranges: 0.1% for AGIs below $25k, 0.4% for AGIs $25k-50k, 1.1% for AGIs $50k-75k, 1.5% for AGIs $75k-100k, 1.9% for AGIs $100k-200k, 1.5% for AGIs over 200k)
Taxes paid: $4,954 (reported on 13.6% of returns)
93458:
$4,954
State:
$14,448
(% of AGI for various income ranges: 0.5% for AGIs below $25k, 1.3% for AGIs $25k-50k, 3.5% for AGIs $50k-75k, 4.9% for AGIs $75k-100k, 6.2% for AGIs $100k-200k, 8.1% for AGIs over 200k)
Earned income credit: $2,631 (reported on 23.3% of returns)
Here:
$2,631
State:
$2,286
(% of AGI for various income ranges: 5.2% for AGIs below $25k, 1.6% for AGIs $25k-50k)
Percentage of individuals using paid preparers for their 2012 taxes: 76.9%
Here:
77%
State:
64%
(% for various income ranges: 77.0% for AGIs below $25k, 79.6% for AGIs $25k-50k, 71.7% for AGIs $50k-75k, 68.8% for AGIs $75k-100k, 66.7% for AGIs $100k-200k, 100.0% for AGIs over 200k)
Averages for the 2004 tax year for zip code 93458, filed in 2005:
Average Adjusted Gross Income (AGI) in 2004: $27,530 (Individual Income Tax Returns)
Here:
$27,530
State:
$58,600
Salary/wage: $25,432 (reported on 91.5% of returns)
Here:
$25,432
State:
$49,455
(% of AGI for various income ranges: 101.6% for AGIs below $10k, 87.9% for AGIs $10k-25k, 88.2% for AGIs $25k-50k, 86.6% for AGIs $50k-75k, 84.7% for AGIs $75k-100k, 53.8% for AGIs over 100k)
Taxable interest for individuals: $927 (reported on 24.7% of returns)
This zip code:
$927
California:
$2,365
(% of AGI for various income ranges: 1.5% for AGIs below $10k, 0.6% for AGIs $10k-25k, 0.4% for AGIs $25k-50k, 0.6% for AGIs $50k-75k, 0.8% for AGIs $75k-100k, 3.1% for AGIs over 100k)
Taxable dividends: $2,259 (reported on 6.0% of returns)
Here:
$2,259
State:
$4,746
(% of AGI for various income ranges: 1.2% for AGIs below $10k, 0.4% for AGIs $10k-25k, 0.3% for AGIs $25k-50k, 0.3% for AGIs $50k-75k, 0.5% for AGIs $75k-100k, 1.6% for AGIs over 100k)
Net capital gain/loss: +$13,146 (reported on 4.8% of returns)
Here:
+$13,146
State:
+$23,418
(% of AGI for various income ranges: -0.5% for AGIs below $10k, -0.0% for AGIs $10k-25k, 0.1% for AGIs $25k-50k, 0.3% for AGIs $50k-75k, 1.0% for AGIs $75k-100k, 20.9% for AGIs over 100k)
Profit/loss from business: +$9,033 (reported on 9.0% of returns)
Here:
+$9,033
State:
+$16,826
(% of AGI for various income ranges: 2.8% for AGIs below $10k, 3.3% for AGIs $10k-25k, 3.1% for AGIs $25k-50k, 2.5% for AGIs $50k-75k, 2.6% for AGIs $75k-100k, 2.8% for AGIs over 100k)
Profit/loss from farming: +$5,788 (reported on 0.6% of returns)
Here:
+$5,788
State:
-$7,562
IRA payment deduction: $2,481 (reported on 1.0% of returns)
93458:
$2,481
California:
$3,192
(% of AGI for various income ranges: 0.1% for AGIs $10k-25k, 0.1% for AGIs $25k-50k, 0.1% for AGIs $50k-75k, 0.1% for AGIs $75k-100k, 0.1% for AGIs over 100k)
Self-employed pension: $11,800 (reported on 0.1% of returns)
Here:
$11,800
California:
$17,688
Total itemized deductions: $18,763 (34% of AGI, reported on 21.3% of returns)
Here:
$18,763
State:
$28,113
Here:
34.5% of AGI
State:
25.3% of AGI
(% of AGI for various income ranges: 6.3% for AGIs below $10k, 5.5% for AGIs $10k-25k, 15.3% for AGIs $25k-50k, 22.1% for AGIs $50k-75k, 22.0% for AGIs $75k-100k, 17.2% for AGIs over 100k)
Charity contributions deductions: $1,724 (3% of AGI, reported on 17.0% of returns)
Here:
$1,724
State:
$3,923
Here:
3.0% of AGI
State:
3.3% of AGI
(% of AGI for various income ranges: 0.3% for AGIs below $10k, 0.4% for AGIs $10k-25k, 0.8% for AGIs $25k-50k, 1.6% for AGIs $50k-75k, 2.0% for AGIs $75k-100k, 1.9% for AGIs over 100k)
Total tax: $2,939 (reported on 49.7% of returns)
93458:
$2,939
State:
$10,761
(% of AGI for various income ranges: 2.0% for AGIs below $10k, 2.2% for AGIs $10k-25k, 3.7% for AGIs $25k-50k, 6.4% for AGIs $50k-75k, 8.7% for AGIs $75k-100k, 14.5% for AGIs over 100k)
Earned income credit: $2,033 (reported on 31.1% of returns)
Here:
$2,033
State:
$1,763
Percentage of individuals using paid preparers for their 2004 taxes: 79.9%
Here:
80%
State:
66%
(% for various income ranges: 73.9% for AGIs below $10k, 84.7% for AGIs $10k-25k, 80.5% for AGIs $25k-50k, 73.5% for AGIs $50k-75k, 67.2% for AGIs $75k-100k, 74.3% for AGIs over 100k)
Likely homosexual households (counted as self-reported same-sex unmarried-partner households)
Lesbian couples: 0.3% of all households
Gay men: 0.0% of all households
Household received Food Stamps/SNAP in the past 12 months: 2,923 Household did not receive Food Stamps/SNAP in the past 12 months: 11,453
Women who had a birth in the past 12 months: 1,100 (594 now married, 509 unmarried) Women who did not have a birth in the past 12 months: 13,911 (4,661 now married, 9,285 unmarried)
Housing units in zip code 93458 with a mortgage: 4,085 (198 second mortgage, 14 home equity loan, 114 both second mortgage and home equity loan) Houses without a mortgage: 68
Median monthly owner costs for units with a mortgage: $1,963 Median monthly owner costs for units without a mortgage: $551
Residents with income below the poverty level in 2022:
This zip code:
16.2%
Whole state:
12.2%
Residents with income below 50% of the poverty level in 2022:
This zip code:
9.1%
Whole state:
6.2%
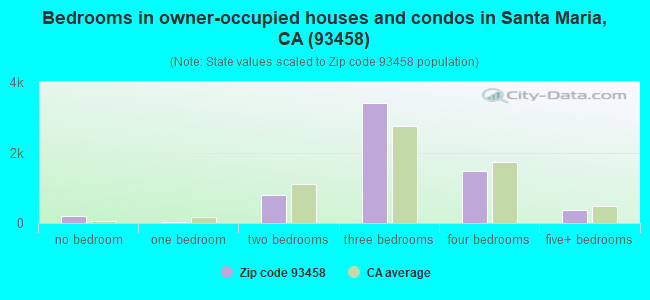
Median number of rooms in houses and condos:
Here:
5.5
State:
6.0
Median number of rooms in apartments:
Here:
4.2
State:
3.9
Notable locations in this zip code not listed on our city pages
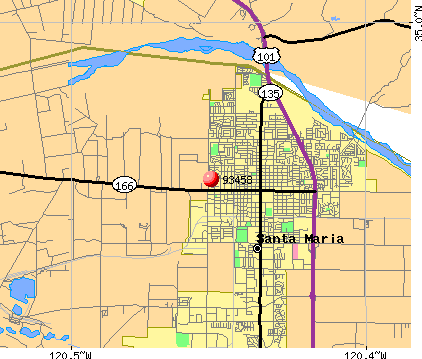
Notable locations in zip code 93458: Carr Scale (A), Betteravia Storage (B), Betteravia Stockyards (C), Veterans Memorial Hall (D), Santa Maria Fire Department Station 2 (E), Santa Maria Fire Department Station 1 (F). Display/hide their locations on the map
Shopping Centers: Town Center West Shopping Center (1), Town and Country Shopping Center (2), La Joya Plaza Shopping Center (3), Western Village Shopping Center (4), Santa Maria Shopping Center (5), Pepper Tree Plaza Shopping Center (6). Display/hide their locations on the map
Churches in zip code 93458 include: Church of Christ (A), El Camino Park Four Square Church (B), First Methodist Episcopal Church (C), First Presbyterian Church (D), Foursquare Church of Santa Maria (E), Kingdom Hall of Jehovahs Witnesses (F), Saint Peters Episcopal Church (G), Seventh Day Adventist Church (H), Christ United Methodist Church (I). Display/hide their locations on the map
Parks in zip code 93458 include: Adam Park (1), Atkinson Park (2), Buena Vista Park (3), Grogan Park (4), Memorial Park (5), Miname Community Park (6), Oakley Park (7), Russell Park (8), Santa Barbara County Fairgrounds and Convention Center (9). Display/hide their locations on the map
7,281 married couples with children.
7,519 single-parent households (2,658 men, 4,861 women).
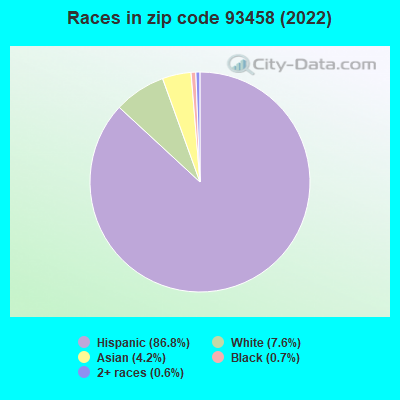
21.7% of residents of 93458 zip code speak English at home.
73.5% of residents speak Spanish at home (47% very well, 12% well, 13% not well, 28% not at all).
0.2% of residents speak other Indo-European language at home (79% very well, 21% well).
3.6% of residents speak Asian or Pacific Island language at home (48% very well, 31% well, 18% not well, 4% not at all).
1.8% of residents speak other language at home (38% very well, 16% well, 6% not well, 40% not at all).
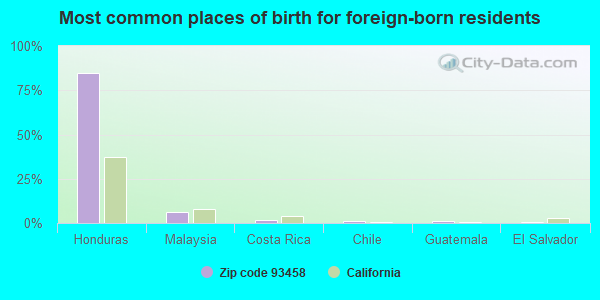
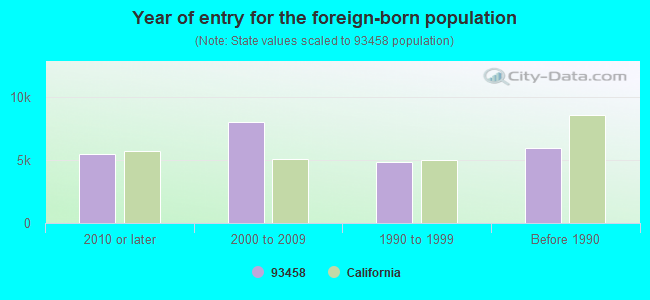
Foreign born population: 23,574 (39.8%) (27.0% of them are naturalized citizens)
Facilities with environmental interests located in this zip code:
NH3 SERVICE CAMPANY (609 S. DEPOT ST. in SANTA MARIA, CA)
STATE MASTER (California - Hazardous Waste Tracking) - HAZARDOU WASTE PROGRAM Small Quantity Generators, between 100 kg and 1000 kg of hazardous waste/month (Resource Conservation and Recovery Act (tracking hazardous waste)) Alternative names: NH3 SERVICE COMPANY, NH3 SERVICE COMPANYOF SANTA MARIA
CAMACHO TRANSPORTATION (1858 N CURRYER in SANTA MARIA, CA)
STATE MASTER (California - Hazardous Waste Tracking) - HAZARDOU WASTE PROGRAM TRANSPORTER (Resource Conservation and Recovery Act (tracking hazardous waste)) - notification Organizations: CARLOS CAMACHO (CONTACT/OWNER)
F SALAS TRUCKING (340 W DONOVAN RD in SANTA MARIA, CA)
TRANSPORTER (Resource Conservation and Recovery Act (tracking hazardous waste))
CERTIFIED FREIGHT LINES INC (1344 WHITE CT in SANTA MARIA, CA)
Small Quantity Generators, between 100 kg and 1000 kg of hazardous waste/month (Resource Conservation and Recovery Act (tracking hazardous waste)) Business NAICS classification: GENERAL AUTOMOTIVE REPAIR.
Housing units lacking complete plumbing facilities: 0.1% Housing units lacking complete kitchen facilities: 0.8%
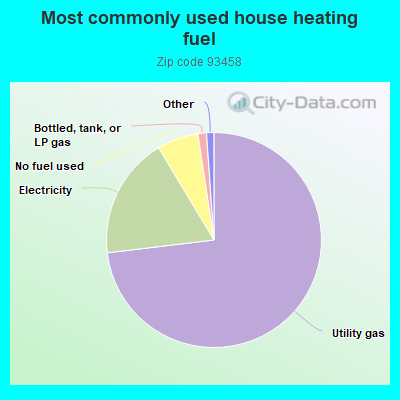
73.1%Utility gas
18.3%Electricity
6.2%No fuel used
1.3%Bottled, tank, or LP gas
Place of birth for U.S.-born residents:
This state: 32,649
Northeast: 342
Midwest: 529
South: 851
West: 913
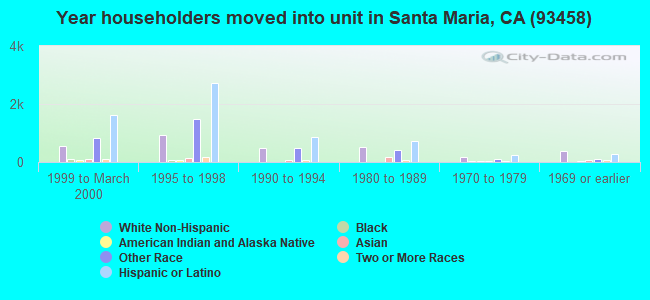
45% of the 93458 zip code residents lived in the same house 5 years ago. Out of people who lived in different houses, 81% lived in this county. Out of people who lived in different counties, 50% lived in California.
92% of the 93458 zip code residents lived in the same house 1 year ago. Out of people who lived in different houses, 66% moved from this county. Out of people who lived in different houses, 17% moved from different county within same state. Out of people who lived in different houses, 6% moved from different state. Out of people who lived in different houses, 14% moved from abroad.
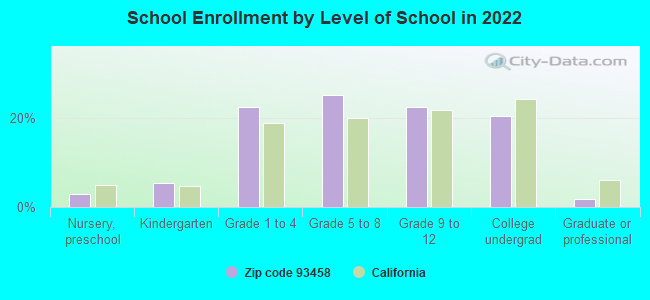
Private vs. public school enrollment:
Students in private schools in grades 1 to 8 (elementary and middle school): 230
Here:
2.8%
California:
10.5%
Students in private schools in grades 9 to 12 (high school): 78
Here:
2.0%
California:
8.5%
Students in private undergraduate colleges: 132
Here:
3.7%
California:
15.9%
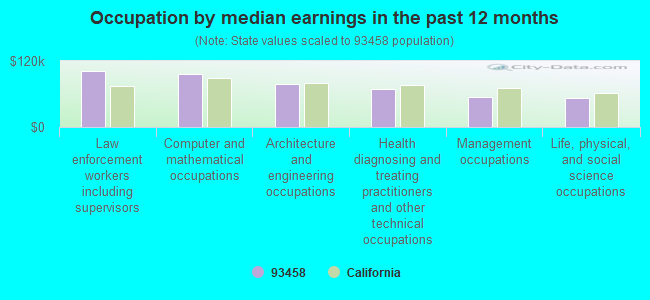
Occupation by median earnings in the past 12 months ($)
101,903Law enforcement workers including supervisors
97,150Computer and mathematical occupations
78,124Architecture and engineering occupations
69,046Health diagnosing and treating practitioners and other technical occupations
54,922Management occupations
52,814Life, physical, and social science occupations
Companies with federal contracts located in this zip code (SANTA MARIA, CA):
QUINTRON SYSTEMS, INC (2105 S BLOSSER RD; small business) : $10,364,362 in 44 contractsfrom 1999 to 2006
Contracts for Maintenance, Repair and Rebuilding of Equipment -- Alarm, Signal, and Security Detection Systems, Programming Services, Miscellaneous Electrical and Electronic Components, Communications Security Equipment and Components, and moreby Defense Intelligence Agency, NASA, Virginia Contracting Activity, Army, and others Signed by year:2000: $334,640; 2001: $182,081; 2002: $454,428; 2003: $533,250; 2004: $603,133; 2005: $7,565,430; 2006: $692,400.
Biggest contracts:
$6,380,500 with Defense Intelligence Agency for Maintenance, Repair and Rebuilding of Equipment -- Alarm, Signal, and Security Detection Systems. Taking place in DC. Signed on 2005-03-03. Completion date: 2004-12-12.
$705,255, same as above.Signed on 2005-09-09. Completion date: 2004-12-12.
$468,354 with Defense Intelligence Agency for Programming Services. Signed on 2006-04-04. Completion date: 2006-09-09.
$279,865 with NASA for Miscellaneous Electrical and Electronic Components. Signed on 2003-02-15. Completion date: 2003-08-15.
LOCKHEED MARTIN CORPORATION (2050 S BLOSSER ROAD, LOCA) : $2,060,723 in 5 contractsin 2006
Contracts for Other Defense -- Advanced Development (R&D) by Air Force Signed by year:2000: $0; 2001: $0; 2002: $0; 2003: $0; 2004: $0; 2005: $0; 2006: $2,060,723.
Biggest contracts:
$687,072 with Air Force for Other Defense -- Advanced Development (R&D). Signed on 2006-04-12. Completion date: 2006-12-31.
$556,792, same as above.Signed on 2006-06-30. Completion date: 2007-01-31.
$388,830, same as above.Signed on 2006-05-11. Completion date: 2006-12-31.
$351,594, same as above.Signed on 2006-07-12. Completion date: 2016-01-31.
B & B SERVICES INC (2065 S BLOSSER ROAD; small business) : $723,684 in 6 contractsfrom 2001 to 2003
Contracts for Landscaping/Groundskeeping Services by Air Force Signed by year:2000: $0; 2001: $547,026; 2002: $122,066; 2003: $54,592; 2004: $0; 2005: $0; 2006: $0.
Biggest contracts:
$312,828 with Air Force for Landscaping/Groundskeeping Services. Signed on 2001-10-12. Completion date: 2002-09-30.
$234,198, same as above.Signed on 2001-09-20. Completion date: 2001-09-30.
$87,318, same as above.Signed on 2003-01-03. Completion date: 2003-03-31.
$87,318, same as above.Signed on 2002-11-05. Completion date: 2002-12-31.
NISHINO & TANIGUCHI PRODUCE CO (415 S RUSSELL AVE; small business) : $109,956 in 3 contractsfrom 2004 to 2005
$42,066 with Defense Commissary Agency for Food Items For Resale. Signed on 2005-04-01. Completion date: 2005-08-31.
$40,012, same as above.Signed on 2004-10-01. Completion date: 2005-09-30.
$27,878, same as above.Signed on 2005-01-01. Completion date: 2005-03-31.
INTERNATIONAL VAN LINES (708 W MORRISON AVE; small business) : $38,788 in 3 contractsfrom 2005 to 2006
$19,840 with Air Force for Packing/Crating Services. Signed on 2005-09-15. Completion date: 2005-10-31.
$15,940 with Air Force for Relocation Services. Signed on 2006-03-31. Completion date: 2006-04-30.
$3,008, same as above.Signed on 2005-08-22. Completion date: 2005-09-30.
VALDEMAR, GLORIA M (1927 N DEJOY)
$30,000 with Air Force for Personal Services Contracts. Signed on 2003-10-01. Completion date: 2008-09-30.
NTD DESIGN & TOOL (406 WEST BOONE; small business)
$25,636 with Navy for Aircraft Landing Equipment. Signed on 2003-06-17. Completion date: 2003-07-09.
MEDICAL WASTE ENVIRONMENTAL EN (702 B SOUTH DEPOT STREET; small business) : $20,000 in 4 contractsfrom 2004 to 2006
$7,000 with Air Force for Waste Treatment and Storage. Signed on 2005-10-01. Completion date: 2006-09-30.
$7,000, same as above.Signed on 2004-10-01. Completion date: 2005-09-30.
$3,000, same as above.Signed on 2006-07-12. Completion date: 2006-09-30.
$3,000, same as above.Signed on 2005-09-28. Completion date: 2005-09-30.
ATLAS WASTE MANAGEMENT INC (1306 WHITE CT; small business) : $17,590 in 3 contractsfrom 2005 to 2006
$8,000 with Bureau of Land Management for Trash/Garbage Collection Services - Including Portable Sanitation Services. Signed on 2005-06-06. Effective on 2005-06-03. Completion date: 2005-09-30.
$7,590 with Navy for Trash/Garbage Collection Services - Including Portable Sanitation Services. Signed on 2006-04-21. Completion date: 2006-05-09.
$2,000 with Bureau of Land Management for Trash/Garbage Collection Services - Including Portable Sanitation Services. Signed on 2005-06-28. Completion date: 2005-09-30.
santa maria tool (2326 SOUTH AOKLEY; small business)
$3,000 with Bureau of Prisoners/Federal Prison System for Miscellaneous Items. Signed on 2005-08-24. Completion date: 2005-09-12.
Top industries in this zip code by the number of employees in 2005:
Construction: Commercial and Institutional Building Construction (100-249 employees: 1 establishment, 20-49 employees: 1 establishment)
Other Services (except Public Administration): Labor Unions and Similar Labor Organizations (100-249: 1, 5-9: 1, 1-4: 1)
2005 - 2018 National Fire Incident Reporting System (NFIRS) incidents
According to the data from the years 2005 - 2018 the average number of fire incidents per year is 87. The highest number of reported fire incidents - 140 took place in 2015, and the least - 48 in 2009. The data has a growing trend.
When looking into fire subcategories, the most reports belonged to: Outside Fires (45.3%), and Structure Fires (32.5%).
Fire incident types reported to NFIRS in Zip Code 93458


+$5,788
-$7,562
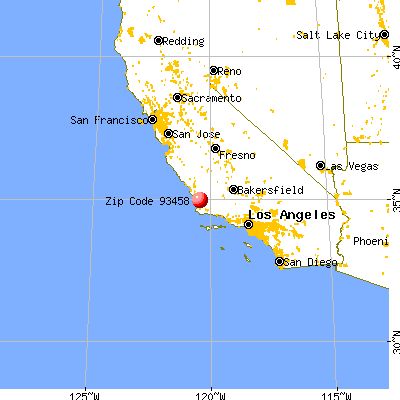
 Nearest zip codes: 93444, 93429, 93434, 93455, 93445, 93433.
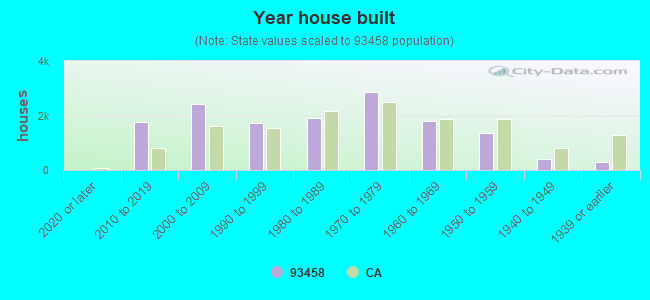


 According to the data from the years 2005 - 2018 the average number of fire incidents per year is 87. The highest number of reported fire incidents - 140 took place in 2015, and the least - 48 in 2009. The data has a growing trend.
 When looking into fire subcategories, the most reports belonged to: Outside Fires (45.3%), and Structure Fires (32.5%).