Estimated zip code population in 2022: 8,326 Zip code population in 2010: 7,313 Zip code population in 2000: 5,616
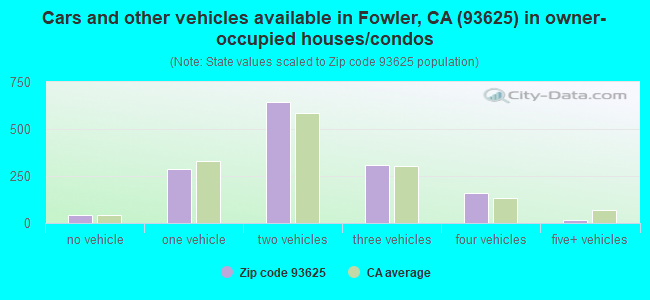
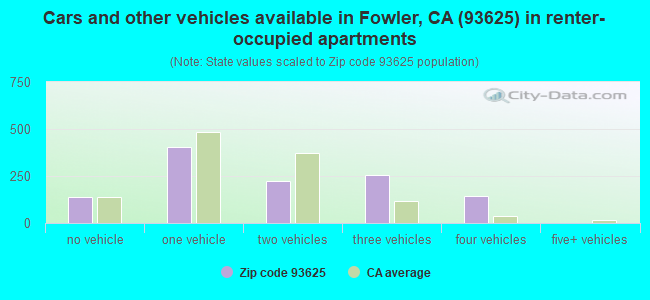
Houses and condos: 2,723 Renter-occupied apartments: 1,164
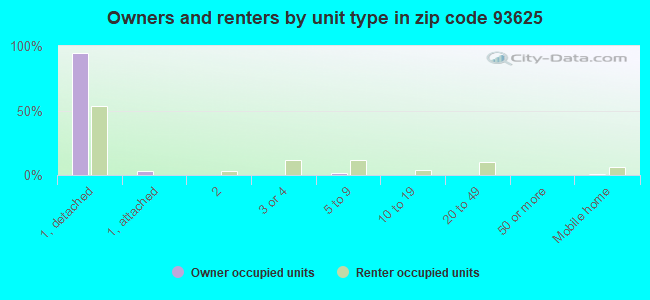
% of renters here:
44%
State:
44%
March 2022 cost of living index in zip code 93625: 97.0 (near average, U.S. average is 100)
Land area: 24.7 sq. mi. Water area: 0.0 sq. mi.
Population density: 337 people per square mile
(very low).
OSM Map
General Map
Google Map
MSN Map
OSM Map
General Map
Google Map
MSN Map
OSM Map
General Map
Google Map
MSN Map
OSM Map
General Map
Google Map
MSN Map
Please wait while loading the map...
Real estate property taxes paid for housing units in 2022:
This zip code:
0.7% ($2,803)
California:
0.7% ($4,831)
Median real estate property taxes paid for housing units with mortgages in 2022: $3,386 (0.8%) Median real estate property taxes paid for housing units with no mortgage in 2022: $1,936 (0.6%)
Business Search- 14 Million verified businesses
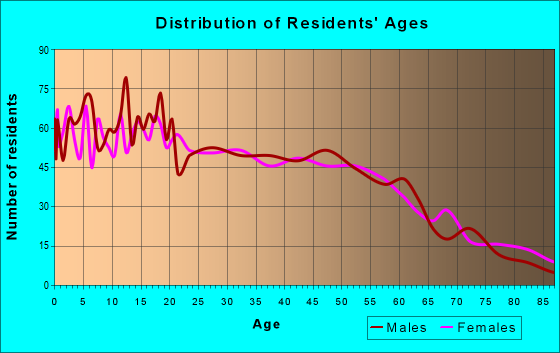
Males: 3,899
(46.8%)
Females: 4,426
(53.2%)
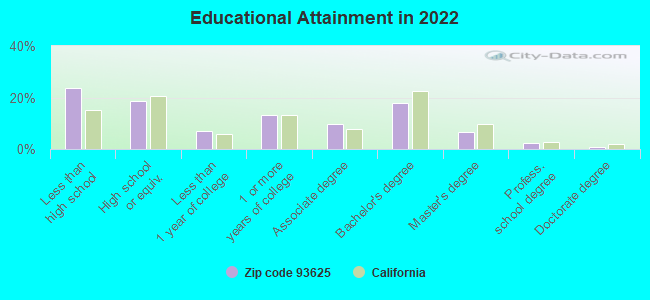
For population 25 years and over in 93625:
High school or higher: 75.6%
Bachelor's degree or higher: 27.5%
Graduate or professional degree: 9.6%
Unemployed: 5.8%
Mean travel time to work (commute): 20.8 minutes
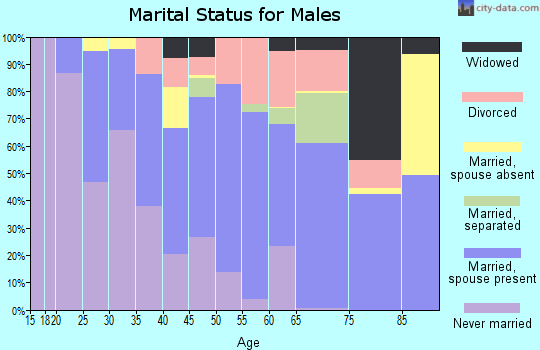
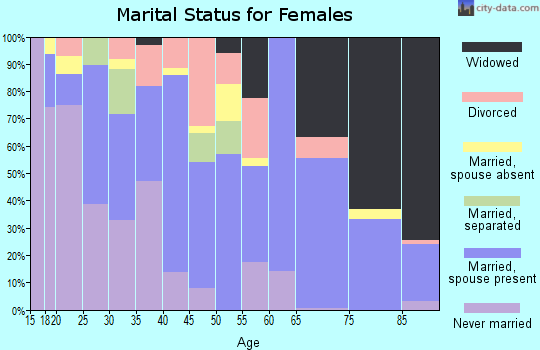
For population 15 years and over in 93625:
Never married: 33.3%
Now married: 50.0%
Separated: 4.8%
Widowed: 4.4%
Divorced: 7.4%
Zip code 93625 compared to state average:
Median household income below state average.
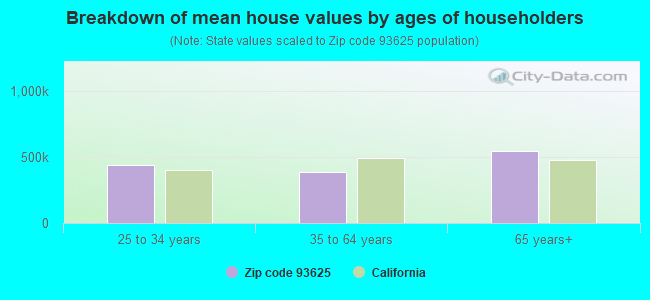
Median house value below state average.
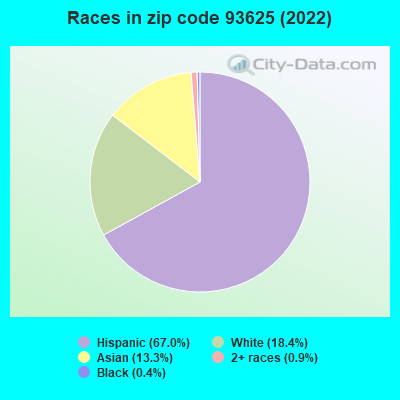
Black race population percentage significantly below state average.
Percentage of population with a bachelor's degree or higher below state average.
Averages for the 2020 tax year for zip code 93625, filed in 2021:
Average Adjusted Gross Income (AGI) in 2020: $58,895 (Individual Income Tax Returns)
Here:
$58,895
State:
$95,910
Salary/wage: $49,674 (reported on 86.3% of returns)
Here:
$49,674
State:
$77,331
(% of AGI for various income ranges: 1505.6% for AGIs below $25k, 4306.6% for AGIs $25k-50k, 7937.9% for AGIs $50k-75k, 11111.9% for AGIs $75k-100k, 22724.5% for AGIs $100k-200k, 65736.7% for AGIs over 200k)
Taxable interest for individuals: $1,028 (reported on 31.1% of returns)
This zip code:
$1,028
California:
$2,294
(% of AGI for various income ranges: 8.5% for AGIs below $25k, 13.4% for AGIs $25k-50k, 27.1% for AGIs $50k-75k, 71.9% for AGIs $75k-100k, 121.8% for AGIs $100k-200k, 1833.3% for AGIs over 200k)
Ordinary dividends: $5,100 (reported on 8.0% of returns)
Here:
$5,100
State:
$10,949
(% of AGI for various income ranges: 12.3% for AGIs below $25k, 8.0% for AGIs $25k-50k, 30.9% for AGIs $50k-75k, 83.8% for AGIs $75k-100k, 328.6% for AGIs $100k-200k, 1376.7% for AGIs over 200k)
Net capital gain/loss in AGI: +$22,500 (reported on 8.8% of returns)
Here:
+$22,500
State:
+$49,306
(% of AGI for various income ranges: 4.0% for AGIs below $25k, 12.0% for AGIs $25k-50k, 75.3% for AGIs $50k-75k, 136.7% for AGIs $75k-100k, 683.2% for AGIs $100k-200k, 18263.3% for AGIs over 200k)
Profit/loss from business: +$13,862 (reported on 14.2% of returns)
Here:
+$13,862
State:
+$15,671
(% of AGI for various income ranges: 137.0% for AGIs below $25k, 344.9% for AGIs $25k-50k, 478.5% for AGIs $50k-75k, 152.4% for AGIs $75k-100k, 586.4% for AGIs $100k-200k, 2050.0% for AGIs over 200k)
Taxable individual retirement arrangement distribution: $15,393 (reported on 3.6% of returns)
93625:
$15,393
California:
$23,505
(% of AGI for various income ranges: 21.3% for AGIs below $25k, 34.3% for AGIs $25k-50k, 63.8% for AGIs $50k-75k, 254.3% for AGIs $75k-100k, 438.2% for AGIs $100k-200k)
Total itemized deductions: $31,164 (reported on 8.5% of returns)
Here:
$31,164
State:
$39,517
(% of AGI for various income ranges: 126.7% for AGIs $25k-50k, 398.5% for AGIs $50k-75k, 1026.2% for AGIs $75k-100k, 1781.8% for AGIs $100k-200k, 6303.3% for AGIs over 200k)
Charity contributions: $7,185 (reported on 7.0% of returns)
Here:
$7,185
State:
$12,598
(% of AGI for various income ranges: 11.9% for AGIs below $25k, 49.1% for AGIs $50k-75k, 116.2% for AGIs $75k-100k, 418.2% for AGIs $100k-200k, 1696.7% for AGIs over 200k)
Taxes paid: $8,397 (reported on 8.5% of returns)
93625:
$8,397
State:
$8,807
(% of AGI for various income ranges: 29.2% for AGIs $25k-50k, 110.0% for AGIs $50k-75k, 301.0% for AGIs $75k-100k, 509.1% for AGIs $100k-200k, 1410.0% for AGIs over 200k)
Earned income credit: $2,295 (reported on 19.7% of returns)
Here:
$2,295
State:
$2,074
(% of AGI for various income ranges: 108.6% for AGIs below $25k, 109.5% for AGIs $25k-50k)
Percentage of individuals using paid preparers for their 2020 taxes: 92.2%
Here:
92%
State:
92%
(% for various income ranges: 90.6% for AGIs below $25k, 91.2% for AGIs $25k-50k, 94.6% for AGIs $50k-75k, 94.1% for AGIs $75k-100k, 93.3% for AGIs $100k-200k, 100.0% for AGIs over 200k)
Averages for the 2012 tax year for zip code 93625, filed in 2013:
Average Adjusted Gross Income (AGI) in 2012: $46,948 (Individual Income Tax Returns)
Here:
$46,948
State:
$72,726
Salary/wage: $39,855 (reported on 87.1% of returns)
Here:
$39,855
State:
$59,079
(% of AGI for various income ranges: 78.7% for AGIs below $25k, 81.6% for AGIs $25k-50k, 82.3% for AGIs $50k-75k, 78.1% for AGIs $75k-100k, 76.4% for AGIs $100k-200k, 43.7% for AGIs over 200k)
Taxable interest for individuals: $1,411 (reported on 30.3% of returns)
This zip code:
$1,411
California:
$2,146
(% of AGI for various income ranges: 0.9% for AGIs below $25k, 0.4% for AGIs $25k-50k, 0.5% for AGIs $50k-75k, 0.8% for AGIs $75k-100k, 0.4% for AGIs $100k-200k, 2.9% for AGIs over 200k)
Ordinary dividends: $3,938 (reported on 10.3% of returns)
Here:
$3,938
State:
$9,308
(% of AGI for various income ranges: 0.9% for AGIs below $25k, 0.4% for AGIs $25k-50k, 0.6% for AGIs $50k-75k, 1.3% for AGIs $75k-100k, 0.6% for AGIs $100k-200k, 1.7% for AGIs over 200k)
Net capital gain/loss in AGI: +$3,838 (reported on 8.4% of returns)
Here:
+$3,838
State:
+$30,460
(% of AGI for various income ranges: 0.1% for AGIs $50k-75k, 0.3% for AGIs $100k-200k, 4.2% for AGIs over 200k)
Profit/loss from business: +$12,927 (reported on 13.2% of returns)
Here:
+$12,927
State:
+$17,064
(% of AGI for various income ranges: 7.3% for AGIs below $25k, 5.6% for AGIs $25k-50k, 3.9% for AGIs $50k-75k, 0.4% for AGIs $75k-100k, 4.0% for AGIs $100k-200k)
Taxable individual retirement arrangement distribution: $10,761 (reported on 5.8% of returns)
93625:
$10,761
California:
$19,557
(% of AGI for various income ranges: 1.1% for AGIs below $25k, 1.1% for AGIs $25k-50k, 1.4% for AGIs $50k-75k, 2.9% for AGIs $75k-100k, 1.5% for AGIs $100k-200k)
Total itemized deductions: $22,755 (24% of AGI, reported on 27.4% of returns)
Here:
$22,755
State:
$34,004
Here:
23.5% of AGI
State:
22.7% of AGI
(% of AGI for various income ranges: 4.3% for AGIs below $25k, 8.8% for AGIs $25k-50k, 15.1% for AGIs $50k-75k, 17.2% for AGIs $75k-100k, 17.6% for AGIs $100k-200k, 15.2% for AGIs over 200k)
Charity contributions: $3,203 (reported on 22.3% of returns)
Here:
$3,203
State:
$4,659
(% of AGI for various income ranges: 0.2% for AGIs below $25k, 0.7% for AGIs $25k-50k, 1.5% for AGIs $50k-75k, 1.9% for AGIs $75k-100k, 2.1% for AGIs $100k-200k, 2.7% for AGIs over 200k)
Taxes paid: $7,379 (reported on 27.4% of returns)
93625:
$7,379
State:
$14,448
(% of AGI for various income ranges: 0.8% for AGIs below $25k, 1.9% for AGIs $25k-50k, 3.9% for AGIs $50k-75k, 4.6% for AGIs $75k-100k, 6.2% for AGIs $100k-200k, 7.9% for AGIs over 200k)
Earned income credit: $2,416 (reported on 27.7% of returns)
Here:
$2,416
State:
$2,286
(% of AGI for various income ranges: 8.1% for AGIs below $25k, 2.1% for AGIs $25k-50k)
Percentage of individuals using paid preparers for their 2012 taxes: 63.5%
Here:
64%
State:
64%
(% for various income ranges: 58.6% for AGIs below $25k, 64.7% for AGIs $25k-50k, 65.0% for AGIs $50k-75k, 68.2% for AGIs $75k-100k, 75.0% for AGIs $100k-200k, 83.3% for AGIs over 200k)
Averages for the 2004 tax year for zip code 93625, filed in 2005:
Average Adjusted Gross Income (AGI) in 2004: $37,230 (Individual Income Tax Returns)
Here:
$37,230
State:
$58,600
Salary/wage: $33,835 (reported on 84.6% of returns)
Here:
$33,835
State:
$49,455
(% of AGI for various income ranges: 390.7% for AGIs below $10k, 81.3% for AGIs $10k-25k, 82.5% for AGIs $25k-50k, 82.2% for AGIs $50k-75k, 82.3% for AGIs $75k-100k, 57.1% for AGIs over 100k)
Taxable interest for individuals: $1,861 (reported on 38.5% of returns)
This zip code:
$1,861
California:
$2,365
(% of AGI for various income ranges: 18.0% for AGIs below $10k, 1.0% for AGIs $10k-25k, 1.4% for AGIs $25k-50k, 1.3% for AGIs $50k-75k, 0.8% for AGIs $75k-100k, 3.4% for AGIs over 100k)
Taxable dividends: $2,844 (reported on 15.5% of returns)
Here:
$2,844
State:
$4,746
(% of AGI for various income ranges: 26.9% for AGIs below $10k, 0.7% for AGIs $10k-25k, 0.8% for AGIs $25k-50k, 1.0% for AGIs $50k-75k, 0.5% for AGIs $75k-100k, 1.7% for AGIs over 100k)
Net capital gain/loss: +$9,253 (reported on 14.1% of returns)
Here:
+$9,253
State:
+$23,418
(% of AGI for various income ranges: 10.7% for AGIs below $10k, -0.0% for AGIs $10k-25k, 0.5% for AGIs $25k-50k, 1.3% for AGIs $50k-75k, 2.7% for AGIs $75k-100k, 9.6% for AGIs over 100k)
Profit/loss from business: +$12,832 (reported on 11.8% of returns)
Here:
+$12,832
State:
+$16,826
(% of AGI for various income ranges: 35.9% for AGIs below $10k, 6.7% for AGIs $10k-25k, 4.8% for AGIs $25k-50k, 2.6% for AGIs $50k-75k, -0.0% for AGIs $75k-100k, 4.2% for AGIs over 100k)
Profit/loss from farming: +$2,557 (reported on 4.7% of returns)
Here:
+$2,557
State:
-$7,562
(% of AGI for various income ranges: 22.6% for AGIs below $10k, 0.9% for AGIs $10k-25k, -1.3% for AGIs $25k-50k, 0.4% for AGIs $50k-75k, 1.0% for AGIs over 100k)
IRA payment deduction: $3,371 (reported on 1.4% of returns)
93625:
$3,371
California:
$3,192
Total itemized deductions: $19,133 (23% of AGI, reported on 24.0% of returns)
Here:
$19,133
State:
$28,113
Here:
22.9% of AGI
State:
25.3% of AGI
(% of AGI for various income ranges: 34.3% for AGIs below $10k, 3.6% for AGIs $10k-25k, 8.7% for AGIs $25k-50k, 14.9% for AGIs $50k-75k, 15.5% for AGIs $75k-100k, 16.2% for AGIs over 100k)
Charity contributions deductions: $3,252 (4% of AGI, reported on 21.0% of returns)
Here:
$3,252
State:
$3,923
Here:
3.7% of AGI
State:
3.3% of AGI
(% of AGI for various income ranges: 2.5% for AGIs below $10k, 0.3% for AGIs $10k-25k, 1.0% for AGIs $25k-50k, 2.1% for AGIs $50k-75k, 2.0% for AGIs $75k-100k, 3.0% for AGIs over 100k)
Total tax: $5,554 (reported on 66.8% of returns)
93625:
$5,554
State:
$10,761
(% of AGI for various income ranges: 21.7% for AGIs below $10k, 3.5% for AGIs $10k-25k, 6.0% for AGIs $25k-50k, 7.8% for AGIs $50k-75k, 9.7% for AGIs $75k-100k, 18.0% for AGIs over 100k)
Earned income credit: $1,987 (reported on 27.1% of returns)
Here:
$1,987
State:
$1,763
Percentage of individuals using paid preparers for their 2004 taxes: 68.2%
Here:
68%
State:
66%
(% for various income ranges: 64.3% for AGIs below $10k, 65.7% for AGIs $10k-25k, 67.2% for AGIs $25k-50k, 68.6% for AGIs $50k-75k, 80.0% for AGIs $75k-100k, 87.6% for AGIs over 100k)
Likely homosexual households (counted as self-reported same-sex unmarried-partner households)
Lesbian couples: 0.3% of all households
Gay men: 0.3% of all households
Household received Food Stamps/SNAP in the past 12 months: 569 Household did not receive Food Stamps/SNAP in the past 12 months: 2,104
Women who had a birth in the past 12 months: 183 (150 now married, 32 unmarried) Women who did not have a birth in the past 12 months: 1,859 (720 now married, 1,140 unmarried)
Housing units in zip code 93625 with a mortgage: 963 (89 second mortgage, 30 both second mortgage and home equity loan) Median monthly owner costs for units with a mortgage: $1,988 Median monthly owner costs for units without a mortgage: $533
Residents with income below the poverty level in 2022:
This zip code:
19.5%
Whole state:
12.2%
Residents with income below 50% of the poverty level in 2022:
This zip code:
8.8%
Whole state:
6.2%
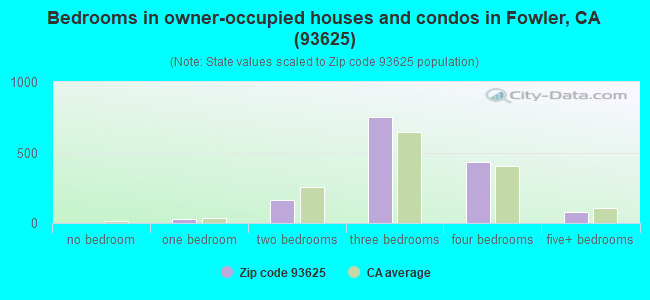
Median number of rooms in houses and condos:
Here:
6.2
State:
6.0
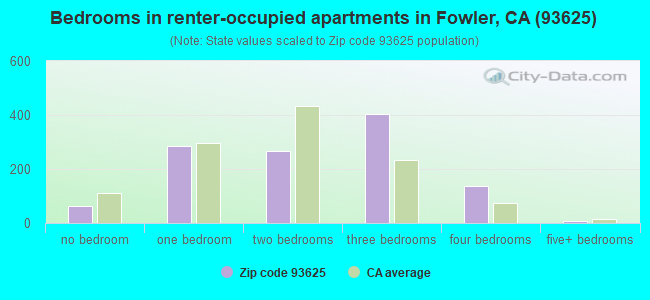
Median number of rooms in apartments:
Here:
4.7
State:
3.9
Notable locations in this zip code not listed on our city pages
Notable locations in zip code 93625: Circle K Ranch (A), McCall Substation (B), Fowler City Hall (C), Fowler Fire Department (D). Display/hide their locations on the map
Churches in zip code 93625 include: Fowler Baptist Church (A), Fowler Christian Church (B), Saint Gregory the Illuminator Armenian Church (C), Saint Lucys Catholic Church (D), Second Baptist Church (E), The Presbyterian Church of Fowler (F). Display/hide their locations on the map
In group quarters: 108 (-1 institutionalized population)
Size of family households: 587 2-persons, 366 3-persons, 477 4-persons, 299 5-persons, 137 6-persons, 97 7-or-more-persons
Size of nonfamily households: 614 1-person, 27 2-persons
1,632 married couples with children.
631 single-parent households (294 men, 337 women).
52.1% of residents of 93625 zip code speak English at home.
37.6% of residents speak Spanish at home (63% very well, 14% well, 15% not well, 8% not at all).
9.5% of residents speak other Indo-European language at home (60% very well, 12% well, 18% not well, 10% not at all).
0.9% of residents speak Asian or Pacific Island language at home (48% very well, 20% well, 32% not well).
0.1% of residents speak other language at home (100% very well).
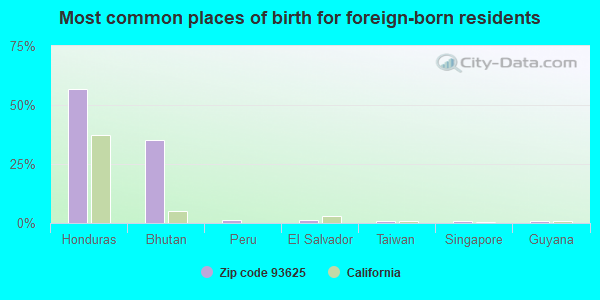
Foreign born population: 1,685 (20.2%) (68.2% of them are naturalized citizens)
This zip code:
20.2%
Whole state:
26.7%
57%Honduras
35%Bhutan
1%Peru
1%El Salvador
1%Taiwan
1%Singapore
1%Guyana
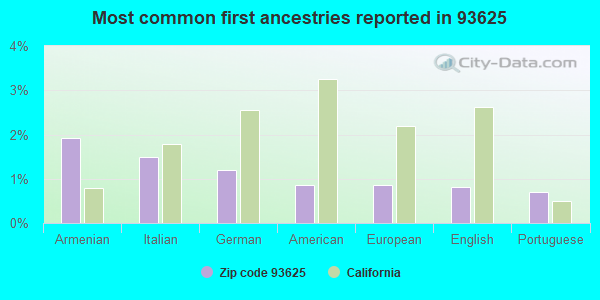
2%Armenian
1%Italian
1%German
1%American
1%European
1%English
1%Portuguese
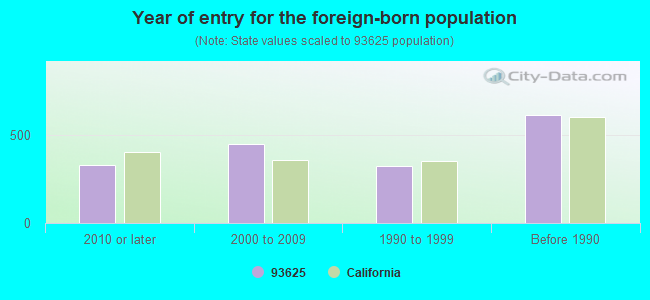
Year of entry for the foreign-born population
3272010 or later
4502000 to 2009
3231990 to 1999
612Before 1990
Facilities with environmental interests located in this zip code:
EMPIRE EQUIPMENT CO (3000 SANANTONIO DR in FOWLER, CA)
STATE MASTER (California - Hazardous Waste Tracking) - HAZARDOU WASTE PROGRAM Small Quantity Generators, between 100 kg and 1000 kg of hazardous waste/month (Resource Conservation and Recovery Act (tracking hazardous waste)) - notification Organizations: BEUZEKOM OF CA INC (CONTACT/OWNER)
JACOBSEN TRAILER INC (1128 E SOUTH AVE in FOWLER, CA)
STATE MASTER (California - Hazardous Waste Tracking) - HAZARDOU WASTE PROGRAM Small Quantity Generators, between 100 kg and 1000 kg of hazardous waste/month (Resource Conservation and Recovery Act (tracking hazardous waste)) - notification Business NAICS classification: TRUCK TRAILER MANUFACTURING. Alternative names: ERIC JACOBSEN GEN MGR
FOWLER HIGH (701 E. MAIN ST. in FOWLER, CA)
(National Center for Education Statistics) - STATE ID-1032150 Organizations: FOWLER UNIFIED (SCHOOL DISTRICT)
FREMONT ELEMENTARY (306 E. TUOLUMNE ST. in FOWLER, CA)
(National Center for Education Statistics) - STATE ID-6006027 Organizations: FOWLER UNIFIED (SCHOOL DISTRICT)
MARSHALL ELEMENTARY (142 N. ARMSTRONG AVE. in FOWLER, CA)
(National Center for Education Statistics) - STATE ID-6006050 Organizations: FOWLER UNIFIED (SCHOOL DISTRICT)
CASA BLANCA CONTINUATION (658 E. ADAMS AVE. in FOWLER, CA)
(National Center for Education Statistics) - STATE ID-1031954 Organizations: FOWLER UNIFIED (SCHOOL DISTRICT)
MAC MANAGEMENT CORPORATION (7323 EAST MANNING AVE in FOWLER, CA)
Small Quantity Generators, between 100 kg and 1000 kg of hazardous waste/month (Resource Conservation and Recovery Act (tracking hazardous waste)) - notification
MANLIFT INC DIV KIDDE INC (8510 GOLDEN STATE BLVD in FOWLER, CA)
Small Quantity Generators, between 100 kg and 1000 kg of hazardous waste/month (Resource Conservation and Recovery Act (tracking hazardous waste))
FOWLER CITY DISPOSAL SITE (W COR STANFORD ST/10TH ST, NE/ in FOWLER, CA)
CRITERIA AND HAZARDOUS AIR POLLUTANT INVENTORY (Inventory of air pollution sources) Business SIC classification: REFUSE SYSTEMS Business NAICS classification: SOLID WASTE LANDFILL.
FOWLER DEHYDRATOR (726 SOUTH 8TH STREET in FOWLER, CA)
CRITERIA AND HAZARDOUS AIR POLLUTANT INVENTORY (Inventory of air pollution sources) Alternative names: FOWLER DEHYORATOR
Housing units lacking complete plumbing facilities: 2.3% Housing units lacking complete kitchen facilities: 4.4%
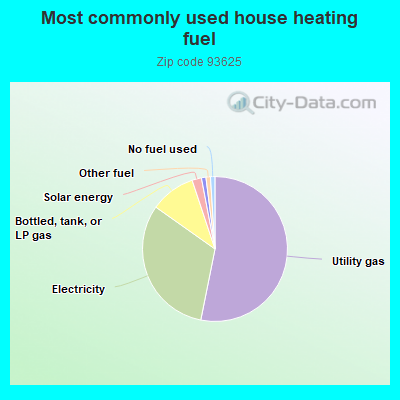
53.2%Utility gas
31.7%Electricity
10.1%Bottled, tank, or LP gas
2.1%Solar energy
1.0%Wood
1.0%Other fuel
1.0%No fuel used
Population in 1990: 5,290. Population change in the 1990s: +326 (+6.2%).
Place of birth for U.S.-born residents:
This state: 6,025
Northeast: 105
Midwest: 30
South: 280
West: 184
67% of the 93625 zip code residents lived in the same house 5 years ago. Out of people who lived in different houses, 85% lived in this county. Out of people who lived in different counties, 50% lived in California.
94% of the 93625 zip code residents lived in the same house 1 year ago. Out of people who lived in different houses, 78% moved from this county. Out of people who lived in different houses, 12% moved from different county within same state. Out of people who lived in different houses, 12% moved from abroad.
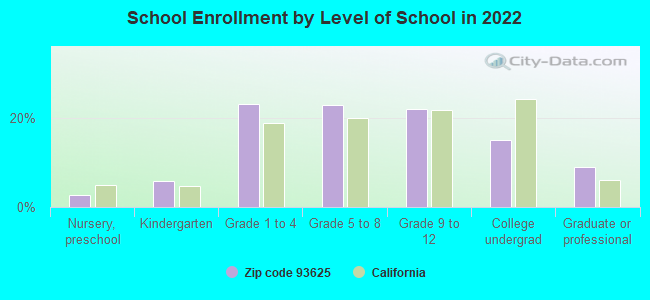
Private vs. public school enrollment:
Students in private schools in grades 1 to 8 (elementary and middle school): 36
Here:
3.3%
California:
10.5%
Students in private schools in grades 9 to 12 (high school): 35
Here:
6.5%
California:
8.5%
Students in private undergraduate colleges: 103
Here:
27.7%
California:
15.9%
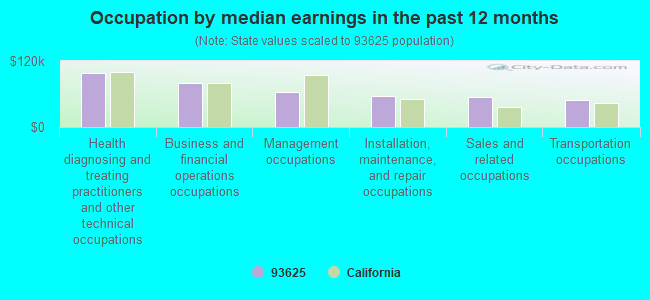
Occupation by median earnings in the past 12 months ($)
98,358Health diagnosing and treating practitioners and other technical occupations
80,331Business and financial operations occupations
64,209Management occupations
56,590Installation, maintenance, and repair occupations
55,062Sales and related occupations
49,883Transportation occupations
Top industries in this zip code by the number of employees in 2005:
Construction: Plumbing, Heating, and Air-Conditioning Contractors (50-99 employees: 1 establishment)
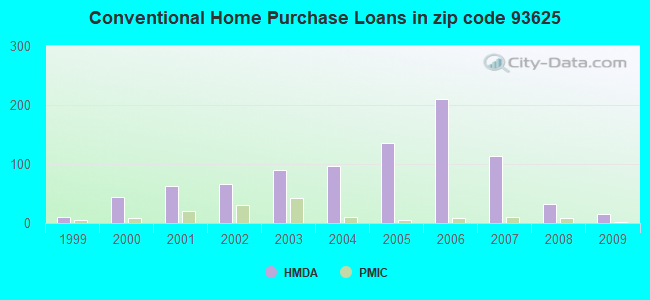
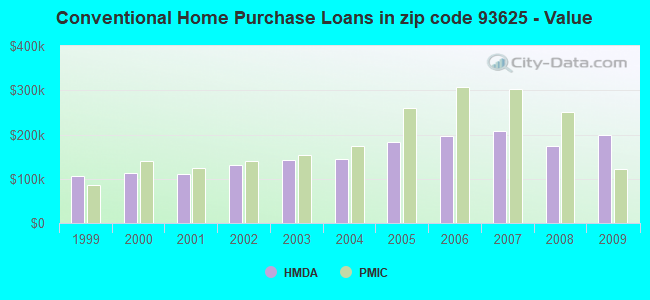
Detailed PMIC statistics for the following Tracts:0016.00
, 0017.00
2005 - 2018 National Fire Incident Reporting System (NFIRS) incidents
According to the data from the years 2005 - 2018 the average number of fires per year is 23. The highest number of fires - 51 took place in 2017, and the least - 2 in 2006. The data has a growing trend.
When looking into fire subcategories, the most reports belonged to: Outside Fires (50.0%), and Mobile Property/Vehicle Fires (32.1%).
Fire incident types reported to NFIRS in Zip Code 93625


+$2,557
-$7,562
(% of AGI for various income ranges: 22.6% for AGIs below $10k, 0.9% for AGIs $10k-25k, -1.3% for AGIs $25k-50k, 0.4% for AGIs $50k-75k, 1.0% for AGIs over 100k) Nearest zip codes: 93725, 93616, 93662, 93727, 93702, 93648.
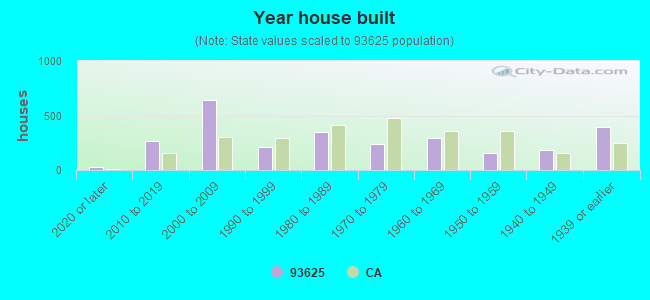


 According to the data from the years 2005 - 2018 the average number of fires per year is 23. The highest number of fires - 51 took place in 2017, and the least - 2 in 2006. The data has a growing trend.
 When looking into fire subcategories, the most reports belonged to: Outside Fires (50.0%), and Mobile Property/Vehicle Fires (32.1%).