Estimated zip code population in 2022: 17,743
Zip code population in 2010: 15,743
Zip code population in 2000: 16,339
Houses and condos: 6,881
Renter-occupied apartments: 4,103
% of renters here:
63%State:
44%
March 2022 cost of living index in zip code 93728: 95.6
(near average, U.S. average is 100)
Land area: 3.1
sq. mi.
Water area: 0.0
sq. mi.
Population density: 5,800 people per square mile (average).
OSM Map
General Map
Google Map
MSN Map
OSM Map
General Map
Google Map
MSN Map
OSM Map
General Map
Google Map
MSN Map
OSM Map
General Map
Google Map
MSN Map
Please wait while loading the map...
Real estate property taxes paid for housing units in 2022:
This zip code:
0.7% ($1,703)California:
0.7% ($4,831)
Median real estate property taxes paid for housing units with mortgages in 2022: $2,085 (0.8%)
Median real estate property taxes paid for housing units with no mortgage in 2022: $1,175 (0.7%)
Profiles of local businesses
Business Search - 14 Million verified businesses
Males: 9,165 Females: 8,578
For population 25 years and over in 93728:
High school or higher: 77.3%Bachelor's degree or higher: 18.4%Graduate or professional degree: 5.6%Unemployed: 9.4%Mean travel time to work (commute): 20.4 minutes
For population 15 years and over in 93728:
Never married: 44.7%Now married: 33.9%Separated: 2.5%Widowed: 5.6%Divorced: 13.3%
Zip code 93728 compared to state average:
Median household income below state average. Median house value significantly below state average. Unemployed percentage above state average. Black race population percentage below state average. Foreign-born population percentage below state average. Length of stay since moving in above state average. House age above state average. Percentage of population with a bachelor's degree or higher below state average. 11,791 66.5% Hispanic or Latino 4,250 24.0% White 778 4.4% Asian 461 2.6% Two or more races 435 2.5% Black 16 0.09% American Indian 9 0.05% Native Hawaiian and Other
Data:
Median household income ($)
Median household income (% change since 2000)
Household income diversity
Ratio of average income to average house value (%)
Ratio of average income to average rent
Median household income ($) - White
Median household income ($) - Black or African American
Median household income ($) - Asian
Median household income ($) - Hispanic or Latino
Median household income ($) - American Indian and Alaska Native
Median household income ($) - Multirace
Median household income ($) - Other Race
Median household income for houses/condos with a mortgage ($)
Median household income for apartments without a mortgage ($)
Races - White alone (%)
Races - White alone (% change since 2000)
Races - Black alone (%)
Races - Black alone (% change since 2000)
Races - American Indian alone (%)
Races - American Indian alone (% change since 2000)
Races - Asian alone (%)
Races - Asian alone (% change since 2000)
Races - Hispanic (%)
Races - Hispanic (% change since 2000)
Races - Native Hawaiian and Other Pacific Islander alone (%)
Races - Native Hawaiian and Other Pacific Islander alone (% change since 2000)
Races - Two or more races (%)
Races - Two or more races (% change since 2000)
Races - Other race alone (%)
Races - Other race alone (% change since 2000)
Racial diversity
Unemployment (%)
Unemployment (% change since 2000)
Unemployment (%) - White
Unemployment (%) - Black or African American
Unemployment (%) - Asian
Unemployment (%) - Hispanic or Latino
Unemployment (%) - American Indian and Alaska Native
Unemployment (%) - Multirace
Unemployment (%) - Other Race
Population density (people per square mile)
Population - Males (%)
Population - Females (%)
Population - Males (%) - White
Population - Males (%) - Black or African American
Population - Males (%) - Asian
Population - Males (%) - Hispanic or Latino
Population - Males (%) - American Indian and Alaska Native
Population - Males (%) - Multirace
Population - Males (%) - Other Race
Population - Females (%) - White
Population - Females (%) - Black or African American
Population - Females (%) - Asian
Population - Females (%) - Hispanic or Latino
Population - Females (%) - American Indian and Alaska Native
Population - Females (%) - Multirace
Population - Females (%) - Other Race
Coronavirus confirmed cases (Apr 27, 2024)
Deaths caused by coronavirus (Apr 27, 2024)
Coronavirus confirmed cases (per 100k population) (Apr 27, 2024)
Deaths caused by coronavirus (per 100k population) (Apr 27, 2024)
Daily increase in number of cases (Apr 27, 2024)
Weekly increase in number of cases (Apr 27, 2024)
Cases doubled (in days) (Apr 27, 2024)
Hospitalized patients (Apr 18, 2022)
Negative test results (Apr 18, 2022)
Total test results (Apr 18, 2022)
COVID Vaccine doses distributed (per 100k population) (Sep 19, 2023)
COVID Vaccine doses administered (per 100k population) (Sep 19, 2023)
COVID Vaccine doses distributed (Sep 19, 2023)
COVID Vaccine doses administered (Sep 19, 2023)
Likely homosexual households (%)
Likely homosexual households (% change since 2000)
Likely homosexual households - Lesbian couples (%)
Likely homosexual households - Lesbian couples (% change since 2000)
Likely homosexual households - Gay men (%)
Likely homosexual households - Gay men (% change since 2000)
Cost of living index
Median gross rent ($)
Median contract rent ($)
Median monthly housing costs ($)
Median house or condo value ($)
Median house or condo value ($ change since 2000)
Mean house or condo value by units in structure - 1, detached ($)
Mean house or condo value by units in structure - 1, attached ($)
Mean house or condo value by units in structure - 2 ($)
Mean house or condo value by units in structure by units in structure - 3 or 4 ($)
Mean house or condo value by units in structure - 5 or more ($)
Mean house or condo value by units in structure - Boat, RV, van, etc. ($)
Mean house or condo value by units in structure - Mobile home ($)
Median house or condo value ($) - White
Median house or condo value ($) - Black or African American
Median house or condo value ($) - Asian
Median house or condo value ($) - Hispanic or Latino
Median house or condo value ($) - American Indian and Alaska Native
Median house or condo value ($) - Multirace
Median house or condo value ($) - Other Race
Median resident age
Resident age diversity
Median resident age - Males
Median resident age - Females
Median resident age - White
Median resident age - Black or African American
Median resident age - Asian
Median resident age - Hispanic or Latino
Median resident age - American Indian and Alaska Native
Median resident age - Multirace
Median resident age - Other Race
Median resident age - Males - White
Median resident age - Males - Black or African American
Median resident age - Males - Asian
Median resident age - Males - Hispanic or Latino
Median resident age - Males - American Indian and Alaska Native
Median resident age - Males - Multirace
Median resident age - Males - Other Race
Median resident age - Females - White
Median resident age - Females - Black or African American
Median resident age - Females - Asian
Median resident age - Females - Hispanic or Latino
Median resident age - Females - American Indian and Alaska Native
Median resident age - Females - Multirace
Median resident age - Females - Other Race
Commute - mean travel time to work (minutes)
Travel time to work - Less than 5 minutes (%)
Travel time to work - Less than 5 minutes (% change since 2000)
Travel time to work - 5 to 9 minutes (%)
Travel time to work - 5 to 9 minutes (% change since 2000)
Travel time to work - 10 to 19 minutes (%)
Travel time to work - 10 to 19 minutes (% change since 2000)
Travel time to work - 20 to 29 minutes (%)
Travel time to work - 20 to 29 minutes (% change since 2000)
Travel time to work - 30 to 39 minutes (%)
Travel time to work - 30 to 39 minutes (% change since 2000)
Travel time to work - 40 to 59 minutes (%)
Travel time to work - 40 to 59 minutes (% change since 2000)
Travel time to work - 60 to 89 minutes (%)
Travel time to work - 60 to 89 minutes (% change since 2000)
Travel time to work - 90 or more minutes (%)
Travel time to work - 90 or more minutes (% change since 2000)
Marital status - Never married (%)
Marital status - Now married (%)
Marital status - Separated (%)
Marital status - Widowed (%)
Marital status - Divorced (%)
Median family income ($)
Median family income (% change since 2000)
Median non-family income ($)
Median non-family income (% change since 2000)
Median per capita income ($)
Median per capita income (% change since 2000)
Median family income ($) - White
Median family income ($) - Black or African American
Median family income ($) - Asian
Median family income ($) - Hispanic or Latino
Median family income ($) - American Indian and Alaska Native
Median family income ($) - Multirace
Median family income ($) - Other Race
Median year house/condo built
Median year apartment built
Year house built - Built 2005 or later (%)
Year house built - Built 2000 to 2004 (%)
Year house built - Built 1990 to 1999 (%)
Year house built - Built 1980 to 1989 (%)
Year house built - Built 1970 to 1979 (%)
Year house built - Built 1960 to 1969 (%)
Year house built - Built 1950 to 1959 (%)
Year house built - Built 1940 to 1949 (%)
Year house built - Built 1939 or earlier (%)
Average household size
Household density (households per square mile)
Average household size - White
Average household size - Black or African American
Average household size - Asian
Average household size - Hispanic or Latino
Average household size - American Indian and Alaska Native
Average household size - Multirace
Average household size - Other Race
Occupied housing units (%)
Vacant housing units (%)
Owner occupied housing units (%)
Renter occupied housing units (%)
Vacancy status - For rent (%)
Vacancy status - For sale only (%)
Vacancy status - Rented or sold, not occupied (%)
Vacancy status - For seasonal, recreational, or occasional use (%)
Vacancy status - For migrant workers (%)
Vacancy status - Other vacant (%)
Residents with income below the poverty level (%)
Residents with income below 50% of the poverty level (%)
Children below poverty level (%)
Poor families by family type - Married-couple family (%)
Poor families by family type - Male, no wife present (%)
Poor families by family type - Female, no husband present (%)
Poverty status for native-born residents (%)
Poverty status for foreign-born residents (%)
Poverty among high school graduates not in families (%)
Poverty among people who did not graduate high school not in families (%)
Residents with income below the poverty level (%) - White
Residents with income below the poverty level (%) - Black or African American
Residents with income below the poverty level (%) - Asian
Residents with income below the poverty level (%) - Hispanic or Latino
Residents with income below the poverty level (%) - American Indian and Alaska Native
Residents with income below the poverty level (%) - Multirace
Residents with income below the poverty level (%) - Other Race
Air pollution - Air Quality Index (AQI)
Air pollution - CO
Air pollution - NO2
Air pollution - SO2
Air pollution - Ozone
Air pollution - PM10
Air pollution - PM25
Air pollution - Pb
Crime - Murders per 100,000 population
Crime - Rapes per 100,000 population
Crime - Robberies per 100,000 population
Crime - Assaults per 100,000 population
Crime - Burglaries per 100,000 population
Crime - Thefts per 100,000 population
Crime - Auto thefts per 100,000 population
Crime - Arson per 100,000 population
Crime - City-data.com crime index
Crime - Violent crime index
Crime - Property crime index
Crime - Murders per 100,000 population (5 year average)
Crime - Rapes per 100,000 population (5 year average)
Crime - Robberies per 100,000 population (5 year average)
Crime - Assaults per 100,000 population (5 year average)
Crime - Burglaries per 100,000 population (5 year average)
Crime - Thefts per 100,000 population (5 year average)
Crime - Auto thefts per 100,000 population (5 year average)
Crime - Arson per 100,000 population (5 year average)
Crime - City-data.com crime index (5 year average)
Crime - Violent crime index (5 year average)
Crime - Property crime index (5 year average)
1996 Presidential Elections Results (%) - Democratic Party (Clinton)
1996 Presidential Elections Results (%) - Republican Party (Dole)
1996 Presidential Elections Results (%) - Other
2000 Presidential Elections Results (%) - Democratic Party (Gore)
2000 Presidential Elections Results (%) - Republican Party (Bush)
2000 Presidential Elections Results (%) - Other
2004 Presidential Elections Results (%) - Democratic Party (Kerry)
2004 Presidential Elections Results (%) - Republican Party (Bush)
2004 Presidential Elections Results (%) - Other
2008 Presidential Elections Results (%) - Democratic Party (Obama)
2008 Presidential Elections Results (%) - Republican Party (McCain)
2008 Presidential Elections Results (%) - Other
2012 Presidential Elections Results (%) - Democratic Party (Obama)
2012 Presidential Elections Results (%) - Republican Party (Romney)
2012 Presidential Elections Results (%) - Other
2016 Presidential Elections Results (%) - Democratic Party (Clinton)
2016 Presidential Elections Results (%) - Republican Party (Trump)
2016 Presidential Elections Results (%) - Other
2020 Presidential Elections Results (%) - Democratic Party (Biden)
2020 Presidential Elections Results (%) - Republican Party (Trump)
2020 Presidential Elections Results (%) - Other
Ancestries Reported - Arab (%)
Ancestries Reported - Czech (%)
Ancestries Reported - Danish (%)
Ancestries Reported - Dutch (%)
Ancestries Reported - English (%)
Ancestries Reported - French (%)
Ancestries Reported - French Canadian (%)
Ancestries Reported - German (%)
Ancestries Reported - Greek (%)
Ancestries Reported - Hungarian (%)
Ancestries Reported - Irish (%)
Ancestries Reported - Italian (%)
Ancestries Reported - Lithuanian (%)
Ancestries Reported - Norwegian (%)
Ancestries Reported - Polish (%)
Ancestries Reported - Portuguese (%)
Ancestries Reported - Russian (%)
Ancestries Reported - Scotch-Irish (%)
Ancestries Reported - Scottish (%)
Ancestries Reported - Slovak (%)
Ancestries Reported - Subsaharan African (%)
Ancestries Reported - Swedish (%)
Ancestries Reported - Swiss (%)
Ancestries Reported - Ukrainian (%)
Ancestries Reported - United States (%)
Ancestries Reported - Welsh (%)
Ancestries Reported - West Indian (%)
Ancestries Reported - Other (%)
Educational Attainment - No schooling completed (%)
Educational Attainment - Less than high school (%)
Educational Attainment - High school or equivalent (%)
Educational Attainment - Less than 1 year of college (%)
Educational Attainment - 1 or more years of college (%)
Educational Attainment - Associate degree (%)
Educational Attainment - Bachelor's degree (%)
Educational Attainment - Master's degree (%)
Educational Attainment - Professional school degree (%)
Educational Attainment - Doctorate degree (%)
School Enrollment - Nursery, preschool (%)
School Enrollment - Kindergarten (%)
School Enrollment - Grade 1 to 4 (%)
School Enrollment - Grade 5 to 8 (%)
School Enrollment - Grade 9 to 12 (%)
School Enrollment - College undergrad (%)
School Enrollment - Graduate or professional (%)
School Enrollment - Not enrolled in school (%)
School enrollment - Public schools (%)
School enrollment - Private schools (%)
School enrollment - Not enrolled (%)
Median number of rooms in houses and condos
Median number of rooms in apartments
Housing units lacking complete plumbing facilities (%)
Housing units lacking complete kitchen facilities (%)
Density of houses
Urban houses (%)
Rural houses (%)
Households with people 60 years and over (%)
Households with people 65 years and over (%)
Households with people 75 years and over (%)
Households with one or more nonrelatives (%)
Households with no nonrelatives (%)
Population in households (%)
Family households (%)
Nonfamily households (%)
Population in families (%)
Family households with own children (%)
Median number of bedrooms in owner occupied houses
Mean number of bedrooms in owner occupied houses
Median number of bedrooms in renter occupied houses
Mean number of bedrooms in renter occupied houses
Median number of vehichles in owner occupied houses
Mean number of vehichles in owner occupied houses
Median number of vehichles in renter occupied houses
Mean number of vehichles in renter occupied houses
Mortgage status - with mortgage (%)
Mortgage status - with second mortgage (%)
Mortgage status - with home equity loan (%)
Mortgage status - with both second mortgage and home equity loan (%)
Mortgage status - without a mortgage (%)
Average family size
Average family size - White
Average family size - Black or African American
Average family size - Asian
Average family size - Hispanic or Latino
Average family size - American Indian and Alaska Native
Average family size - Multirace
Average family size - Other Race
Geographical mobility - Same house 1 year ago (%)
Geographical mobility - Moved within same county (%)
Geographical mobility - Moved from different county within same state (%)
Geographical mobility - Moved from different state (%)
Geographical mobility - Moved from abroad (%)
Place of birth - Born in state of residence (%)
Place of birth - Born in other state (%)
Place of birth - Native, outside of US (%)
Place of birth - Foreign born (%)
Housing units in structures - 1, detached (%)
Housing units in structures - 1, attached (%)
Housing units in structures - 2 (%)
Housing units in structures - 3 or 4 (%)
Housing units in structures - 5 to 9 (%)
Housing units in structures - 10 to 19 (%)
Housing units in structures - 20 to 49 (%)
Housing units in structures - 50 or more (%)
Housing units in structures - Mobile home (%)
Housing units in structures - Boat, RV, van, etc. (%)
House/condo owner moved in on average (years ago)
Renter moved in on average (years ago)
Year householder moved into unit - Moved in 1999 to March 2000 (%)
Year householder moved into unit - Moved in 1995 to 1998 (%)
Year householder moved into unit - Moved in 1990 to 1994 (%)
Year householder moved into unit - Moved in 1980 to 1989 (%)
Year householder moved into unit - Moved in 1970 to 1979 (%)
Year householder moved into unit - Moved in 1969 or earlier (%)
Means of transportation to work - Drove car alone (%)
Means of transportation to work - Carpooled (%)
Means of transportation to work - Public transportation (%)
Means of transportation to work - Bus or trolley bus (%)
Means of transportation to work - Streetcar or trolley car (%)
Means of transportation to work - Subway or elevated (%)
Means of transportation to work - Railroad (%)
Means of transportation to work - Ferryboat (%)
Means of transportation to work - Taxicab (%)
Means of transportation to work - Motorcycle (%)
Means of transportation to work - Bicycle (%)
Means of transportation to work - Walked (%)
Means of transportation to work - Other means (%)
Working at home (%)
Industry diversity
Most Common Industries - Agriculture, forestry, fishing and hunting, and mining (%)
Most Common Industries - Agriculture, forestry, fishing and hunting (%)
Most Common Industries - Mining, quarrying, and oil and gas extraction (%)
Most Common Industries - Construction (%)
Most Common Industries - Manufacturing (%)
Most Common Industries - Wholesale trade (%)
Most Common Industries - Retail trade (%)
Most Common Industries - Transportation and warehousing, and utilities (%)
Most Common Industries - Transportation and warehousing (%)
Most Common Industries - Utilities (%)
Most Common Industries - Information (%)
Most Common Industries - Finance and insurance, and real estate and rental and leasing (%)
Most Common Industries - Finance and insurance (%)
Most Common Industries - Real estate and rental and leasing (%)
Most Common Industries - Professional, scientific, and management, and administrative and waste management services (%)
Most Common Industries - Professional, scientific, and technical services (%)
Most Common Industries - Management of companies and enterprises (%)
Most Common Industries - Administrative and support and waste management services (%)
Most Common Industries - Educational services, and health care and social assistance (%)
Most Common Industries - Educational services (%)
Most Common Industries - Health care and social assistance (%)
Most Common Industries - Arts, entertainment, and recreation, and accommodation and food services (%)
Most Common Industries - Arts, entertainment, and recreation (%)
Most Common Industries - Accommodation and food services (%)
Most Common Industries - Other services, except public administration (%)
Most Common Industries - Public administration (%)
Occupation diversity
Most Common Occupations - Management, business, science, and arts occupations (%)
Most Common Occupations - Management, business, and financial occupations (%)
Most Common Occupations - Management occupations (%)
Most Common Occupations - Business and financial operations occupations (%)
Most Common Occupations - Computer, engineering, and science occupations (%)
Most Common Occupations - Computer and mathematical occupations (%)
Most Common Occupations - Architecture and engineering occupations (%)
Most Common Occupations - Life, physical, and social science occupations (%)
Most Common Occupations - Education, legal, community service, arts, and media occupations (%)
Most Common Occupations - Community and social service occupations (%)
Most Common Occupations - Legal occupations (%)
Most Common Occupations - Education, training, and library occupations (%)
Most Common Occupations - Arts, design, entertainment, sports, and media occupations (%)
Most Common Occupations - Healthcare practitioners and technical occupations (%)
Most Common Occupations - Health diagnosing and treating practitioners and other technical occupations (%)
Most Common Occupations - Health technologists and technicians (%)
Most Common Occupations - Service occupations (%)
Most Common Occupations - Healthcare support occupations (%)
Most Common Occupations - Protective service occupations (%)
Most Common Occupations - Fire fighting and prevention, and other protective service workers including supervisors (%)
Most Common Occupations - Law enforcement workers including supervisors (%)
Most Common Occupations - Food preparation and serving related occupations (%)
Most Common Occupations - Building and grounds cleaning and maintenance occupations (%)
Most Common Occupations - Personal care and service occupations (%)
Most Common Occupations - Sales and office occupations (%)
Most Common Occupations - Sales and related occupations (%)
Most Common Occupations - Office and administrative support occupations (%)
Most Common Occupations - Natural resources, construction, and maintenance occupations (%)
Most Common Occupations - Farming, fishing, and forestry occupations (%)
Most Common Occupations - Construction and extraction occupations (%)
Most Common Occupations - Installation, maintenance, and repair occupations (%)
Most Common Occupations - Production, transportation, and material moving occupations (%)
Most Common Occupations - Production occupations (%)
Most Common Occupations - Transportation occupations (%)
Most Common Occupations - Material moving occupations (%)
People in Group quarters - Institutionalized population (%)
People in Group quarters - Correctional institutions (%)
People in Group quarters - Federal prisons and detention centers (%)
People in Group quarters - Halfway houses (%)
People in Group quarters - Local jails and other confinement facilities (including police lockups) (%)
People in Group quarters - Military disciplinary barracks (%)
People in Group quarters - State prisons (%)
People in Group quarters - Other types of correctional institutions (%)
People in Group quarters - Nursing homes (%)
People in Group quarters - Hospitals/wards, hospices, and schools for the handicapped (%)
People in Group quarters - Hospitals/wards and hospices for chronically ill (%)
People in Group quarters - Hospices or homes for chronically ill (%)
People in Group quarters - Military hospitals or wards for chronically ill (%)
People in Group quarters - Other hospitals or wards for chronically ill (%)
People in Group quarters - Hospitals or wards for drug/alcohol abuse (%)
People in Group quarters - Mental (Psychiatric) hospitals or wards (%)
People in Group quarters - Schools, hospitals, or wards for the mentally retarded (%)
People in Group quarters - Schools, hospitals, or wards for the physically handicapped (%)
People in Group quarters - Institutions for the deaf (%)
People in Group quarters - Institutions for the blind (%)
People in Group quarters - Orthopedic wards and institutions for the physically handicapped (%)
People in Group quarters - Wards in general hospitals for patients who have no usual home elsewhere (%)
People in Group quarters - Wards in military hospitals for patients who have no usual home elsewhere (%)
People in Group quarters - Juvenile institutions (%)
People in Group quarters - Long-term care (%)
People in Group quarters - Homes for abused, dependent, and neglected children (%)
People in Group quarters - Residential treatment centers for emotionally disturbed children (%)
People in Group quarters - Training schools for juvenile delinquents (%)
People in Group quarters - Short-term care, detention or diagnostic centers for delinquent children (%)
People in Group quarters - Type of juvenile institution unknown (%)
People in Group quarters - Noninstitutionalized population (%)
People in Group quarters - College dormitories (includes college quarters off campus) (%)
People in Group quarters - Military quarters (%)
People in Group quarters - On base (%)
People in Group quarters - Barracks, unaccompanied personnel housing (UPH), (Enlisted/Officer), ;and similar group living quarters for military personnel (%)
People in Group quarters - Transient quarters for temporary residents (%)
People in Group quarters - Military ships (%)
People in Group quarters - Group homes (%)
People in Group quarters - Homes or halfway houses for drug/alcohol abuse (%)
People in Group quarters - Homes for the mentally ill (%)
People in Group quarters - Homes for the mentally retarded (%)
People in Group quarters - Homes for the physically handicapped (%)
People in Group quarters - Other group homes (%)
People in Group quarters - Religious group quarters (%)
People in Group quarters - Dormitories (%)
People in Group quarters - Agriculture workers' dormitories on farms (%)
People in Group quarters - Job Corps and vocational training facilities (%)
People in Group quarters - Other workers' dormitories (%)
People in Group quarters - Crews of maritime vessels (%)
People in Group quarters - Other nonhousehold living situations (%)
People in Group quarters - Other noninstitutional group quarters (%)
Residents speaking English at home (%)
Residents speaking English at home - Born in the United States (%)
Residents speaking English at home - Native, born elsewhere (%)
Residents speaking English at home - Foreign born (%)
Residents speaking Spanish at home (%)
Residents speaking Spanish at home - Born in the United States (%)
Residents speaking Spanish at home - Native, born elsewhere (%)
Residents speaking Spanish at home - Foreign born (%)
Residents speaking other language at home (%)
Residents speaking other language at home - Born in the United States (%)
Residents speaking other language at home - Native, born elsewhere (%)
Residents speaking other language at home - Foreign born (%)
Class of Workers - Employee of private company (%)
Class of Workers - Self-employed in own incorporated business (%)
Class of Workers - Private not-for-profit wage and salary workers (%)
Class of Workers - Local government workers (%)
Class of Workers - State government workers (%)
Class of Workers - Federal government workers (%)
Class of Workers - Self-employed workers in own not incorporated business and Unpaid family workers (%)
House heating fuel used in houses and condos - Utility gas (%)
House heating fuel used in houses and condos - Bottled, tank, or LP gas (%)
House heating fuel used in houses and condos - Electricity (%)
House heating fuel used in houses and condos - Fuel oil, kerosene, etc. (%)
House heating fuel used in houses and condos - Coal or coke (%)
House heating fuel used in houses and condos - Wood (%)
House heating fuel used in houses and condos - Solar energy (%)
House heating fuel used in houses and condos - Other fuel (%)
House heating fuel used in houses and condos - No fuel used (%)
House heating fuel used in apartments - Utility gas (%)
House heating fuel used in apartments - Bottled, tank, or LP gas (%)
House heating fuel used in apartments - Electricity (%)
House heating fuel used in apartments - Fuel oil, kerosene, etc. (%)
House heating fuel used in apartments - Coal or coke (%)
House heating fuel used in apartments - Wood (%)
House heating fuel used in apartments - Solar energy (%)
House heating fuel used in apartments - Other fuel (%)
House heating fuel used in apartments - No fuel used (%)
Armed forces status - In Armed Forces (%)
Armed forces status - Civilian (%)
Armed forces status - Civilian - Veteran (%)
Armed forces status - Civilian - Nonveteran (%)
Fatal accidents locations in years 2005-2021
Fatal accidents locations in 2005
Fatal accidents locations in 2006
Fatal accidents locations in 2007
Fatal accidents locations in 2008
Fatal accidents locations in 2009
Fatal accidents locations in 2010
Fatal accidents locations in 2011
Fatal accidents locations in 2012
Fatal accidents locations in 2013
Fatal accidents locations in 2014
Fatal accidents locations in 2015
Fatal accidents locations in 2016
Fatal accidents locations in 2017
Fatal accidents locations in 2018
Fatal accidents locations in 2019
Fatal accidents locations in 2020
Fatal accidents locations in 2021
Alcohol use - People drinking some alcohol every month (%)
Alcohol use - People not drinking at all (%)
Alcohol use - Average days/month drinking alcohol
Alcohol use - Average drinks/week
Alcohol use - Average days/year people drink much
Audiometry - Average condition of hearing (%)
Audiometry - People that can hear a whisper from across a quiet room (%)
Audiometry - People that can hear normal voice from across a quiet room (%)
Audiometry - Ears ringing, roaring, buzzing (%)
Audiometry - Had a job exposure to loud noise (%)
Audiometry - Had off-work exposure to loud noise (%)
Blood Pressure & Cholesterol - Has high blood pressure (%)
Blood Pressure & Cholesterol - Checking blood pressure at home (%)
Blood Pressure & Cholesterol - Frequently checking blood cholesterol (%)
Blood Pressure & Cholesterol - Has high cholesterol level (%)
Consumer Behavior - Money monthly spent on food at supermarket/grocery store
Consumer Behavior - Money monthly spent on food at other stores
Consumer Behavior - Money monthly spent on eating out
Consumer Behavior - Money monthly spent on carryout/delivered foods
Consumer Behavior - Income spent on food at supermarket/grocery store (%)
Consumer Behavior - Income spent on food at other stores (%)
Consumer Behavior - Income spent on eating out (%)
Consumer Behavior - Income spent on carryout/delivered foods (%)
Current Health Status - General health condition (%)
Current Health Status - Blood donors (%)
Current Health Status - Has blood ever tested for HIV virus (%)
Current Health Status - Left-handed people (%)
Dermatology - People using sunscreen (%)
Diabetes - Diabetics (%)
Diabetes - Had a blood test for high blood sugar (%)
Diabetes - People taking insulin (%)
Diet Behavior & Nutrition - Diet health (%)
Diet Behavior & Nutrition - Milk product consumption (# of products/month)
Diet Behavior & Nutrition - Meals not home prepared (#/week)
Diet Behavior & Nutrition - Meals from fast food or pizza place (#/week)
Diet Behavior & Nutrition - Ready-to-eat foods (#/month)
Diet Behavior & Nutrition - Frozen meals/pizza (#/month)
Drug Use - People that ever used marijuana or hashish (%)
Drug Use - Ever used hard drugs (%)
Drug Use - Ever used any form of cocaine (%)
Drug Use - Ever used heroin (%)
Drug Use - Ever used methamphetamine (%)
Health Insurance - People covered by health insurance (%)
Kidney Conditions-Urology - Avg. # of times urinating at night
Medical Conditions - People with asthma (%)
Medical Conditions - People with anemia (%)
Medical Conditions - People with psoriasis (%)
Medical Conditions - People with overweight (%)
Medical Conditions - Elderly people having difficulties in thinking or remembering (%)
Medical Conditions - People who ever received blood transfusion (%)
Medical Conditions - People having trouble seeing even with glass/contacts (%)
Medical Conditions - People with arthritis (%)
Medical Conditions - People with gout (%)
Medical Conditions - People with congestive heart failure (%)
Medical Conditions - People with coronary heart disease (%)
Medical Conditions - People with angina pectoris (%)
Medical Conditions - People who ever had heart attack (%)
Medical Conditions - People who ever had stroke (%)
Medical Conditions - People with emphysema (%)
Medical Conditions - People with thyroid problem (%)
Medical Conditions - People with chronic bronchitis (%)
Medical Conditions - People with any liver condition (%)
Medical Conditions - People who ever had cancer or malignancy (%)
Mental Health - People who have little interest in doing things (%)
Mental Health - People feeling down, depressed, or hopeless (%)
Mental Health - People who have trouble sleeping or sleeping too much (%)
Mental Health - People feeling tired or having little energy (%)
Mental Health - People with poor appetite or overeating (%)
Mental Health - People feeling bad about themself (%)
Mental Health - People who have trouble concentrating on things (%)
Mental Health - People moving or speaking slowly or too fast (%)
Mental Health - People having thoughts they would be better off dead (%)
Oral Health - Average years since last visit a dentist
Oral Health - People embarrassed because of mouth (%)
Oral Health - People with gum disease (%)
Oral Health - General health of teeth and gums (%)
Oral Health - Average days a week using dental floss/device
Oral Health - Average days a week using mouthwash for dental problem
Oral Health - Average number of teeth
Pesticide Use - Households using pesticides to control insects (%)
Pesticide Use - Households using pesticides to kill weeds (%)
Physical Activity - People doing vigorous-intensity work activities (%)
Physical Activity - People doing moderate-intensity work activities (%)
Physical Activity - People walking or bicycling (%)
Physical Activity - People doing vigorous-intensity recreational activities (%)
Physical Activity - People doing moderate-intensity recreational activities (%)
Physical Activity - Average hours a day doing sedentary activities
Physical Activity - Average hours a day watching TV or videos
Physical Activity - Average hours a day using computer
Physical Functioning - People having limitations keeping them from working (%)
Physical Functioning - People limited in amount of work they can do (%)
Physical Functioning - People that need special equipment to walk (%)
Physical Functioning - People experiencing confusion/memory problems (%)
Physical Functioning - People requiring special healthcare equipment (%)
Prescription Medications - Average number of prescription medicines taking
Preventive Aspirin Use - Adults 40+ taking low-dose aspirin (%)
Reproductive Health - Vaginal deliveries (%)
Reproductive Health - Cesarean deliveries (%)
Reproductive Health - Deliveries resulted in a live birth (%)
Reproductive Health - Pregnancies resulted in a delivery (%)
Reproductive Health - Women breastfeeding newborns (%)
Reproductive Health - Women that had a hysterectomy (%)
Reproductive Health - Women that had both ovaries removed (%)
Reproductive Health - Women that have ever taken birth control pills (%)
Reproductive Health - Women taking birth control pills (%)
Reproductive Health - Women that have ever used Depo-Provera or injectables (%)
Reproductive Health - Women that have ever used female hormones (%)
Sexual Behavior - People 18+ that ever had sex (vaginal, anal, or oral) (%)
Sexual Behavior - Males 18+ that ever had vaginal sex with a woman (%)
Sexual Behavior - Males 18+ that ever performed oral sex on a woman (%)
Sexual Behavior - Males 18+ that ever had anal sex with a woman (%)
Sexual Behavior - Males 18+ that ever had any sex with a man (%)
Sexual Behavior - Females 18+ that ever had vaginal sex with a man (%)
Sexual Behavior - Females 18+ that ever performed oral sex on a man (%)
Sexual Behavior - Females 18+ that ever had anal sex with a man (%)
Sexual Behavior - Females 18+ that ever had any kind of sex with a woman (%)
Sexual Behavior - Average age people first had sex
Sexual Behavior - Average number of female sex partners in lifetime (males 18+)
Sexual Behavior - Average number of female vaginal sex partners in lifetime (males 18+)
Sexual Behavior - Average age people first performed oral sex on a woman (18+)
Sexual Behavior - Average number of woman performed oral sex on in lifetime (18+)
Sexual Behavior - Average number of male sex partners in lifetime (males 18+)
Sexual Behavior - Average number of male anal sex partners in lifetime (males 18+)
Sexual Behavior - Average age people first performed oral sex on a man (18+)
Sexual Behavior - Average number of male oral sex partners in lifetime (18+)
Sexual Behavior - People using protection when performing oral sex (%)
Sexual Behavior - Average number of times people have vaginal or anal sex a year
Sexual Behavior - People having sex without condom (%)
Sexual Behavior - Average number of male sex partners in lifetime (females 18+)
Sexual Behavior - Average number of male vaginal sex partners in lifetime (females 18+)
Sexual Behavior - Average number of female sex partners in lifetime (females 18+)
Sexual Behavior - Circumcised males 18+ (%)
Sleep Disorders - Average hours sleeping at night
Sleep Disorders - People that has trouble sleeping (%)
Smoking-Cigarette Use - People smoking cigarettes (%)
Taste & Smell - People 40+ having problems with smell (%)
Taste & Smell - People 40+ having problems with taste (%)
Taste & Smell - People 40+ that ever had wisdom teeth removed (%)
Taste & Smell - People 40+ that ever had tonsils teeth removed (%)
Taste & Smell - People 40+ that ever had a loss of consciousness because of a head injury (%)
Taste & Smell - People 40+ that ever had a broken nose or other serious injury to face or skull (%)
Taste & Smell - People 40+ that ever had two or more sinus infections (%)
Weight - Average height (inches)
Weight - Average weight (pounds)
Weight - Average BMI
Weight - People that are obese (%)
Weight - People that ever were obese (%)
Weight - People trying to lose weight (%)
100%
urban population.
Estimated median house/condo value in 2022: $253,003
93728:
$253,003California:
$715,900
Median resident age: This zip code:
34.0 yearsCalifornia median age:
37.9 years
Average household size: This zip code:
2.7 peopleCalifornia:
2.8 people
Averages for the 2020 tax year for zip code 93728, filed in 2021:
Average Adjusted Gross Income (AGI) in 2020: $38,385 (Individual Income Tax Returns) Here:
$38,385State:
$95,910
Salary/wage: $35,437 (reported on 84.9% of returns )Here:
$35,437State:
$77,331
(% of AGI for various income ranges: 1273.1% for AGIs below $25k , 3990.4% for AGIs $25k-50k , 7370.4% for AGIs $50k-75k , 10757.0% for AGIs $75k-100k , 17140.6% for AGIs $100k-200k ) Taxable interest for individuals: $332 (reported on 18.2% of returns )This zip code:
$332California:
$2,294
(% of AGI for various income ranges: 4.1% for AGIs below $25k , 2.5% for AGIs $25k-50k , 10.0% for AGIs $50k-75k , 17.4% for AGIs $75k-100k , 86.7% for AGIs $100k-200k ) Ordinary dividends: $2,152 (reported on 4.6% of returns )(% of AGI for various income ranges: 2.6% for AGIs below $25k , 4.9% for AGIs $25k-50k , 10.0% for AGIs $50k-75k , 66.7% for AGIs $75k-100k , 177.8% for AGIs $100k-200k ) Net capital gain/loss in AGI: +$6,006 (reported on 4.6% of returns )Here:
+$6,006State:
+$49,306
(% of AGI for various income ranges: 1.0% for AGIs below $25k , 8.0% for AGIs $25k-50k , 5.8% for AGIs $50k-75k , 89.3% for AGIs $75k-100k , 855.0% for AGIs $100k-200k ) Profit/loss from business: +$8,239 (reported on 13.4% of returns )Here:
+$8,239State:
+$15,671
(% of AGI for various income ranges: 127.0% for AGIs below $25k , 93.6% for AGIs $25k-50k , 155.8% for AGIs $50k-75k , 60.7% for AGIs $75k-100k , 1276.1% for AGIs $100k-200k ) Taxable individual retirement arrangement distribution: $14,694 (reported on 2.5% of returns )93728:
$14,694California:
$23,505
(% of AGI for various income ranges: 12.4% for AGIs below $25k , 22.2% for AGIs $25k-50k , 67.2% for AGIs $50k-75k , 285.2% for AGIs $75k-100k , 425.0% for AGIs $100k-200k ) Total itemized deductions: $22,559 (reported on 4.5% of returns )Here:
$22,559State:
$39,517
(% of AGI for various income ranges: 62.0% for AGIs $25k-50k , 309.6% for AGIs $50k-75k , 652.6% for AGIs $75k-100k , 1273.3% for AGIs $100k-200k ) Charity contributions: $4,630 (reported on 2.8% of returns )(% of AGI for various income ranges: 3.7% for AGIs $25k-50k , 32.5% for AGIs $50k-75k , 62.6% for AGIs $75k-100k , 263.3% for AGIs $100k-200k ) Taxes paid: $6,462 (reported on 4.5% of returns )(% of AGI for various income ranges: 10.5% for AGIs $25k-50k , 91.5% for AGIs $50k-75k , 213.0% for AGIs $75k-100k , 386.1% for AGIs $100k-200k ) Earned income credit: $2,441 (reported on 27.4% of returns )(% of AGI for various income ranges: 140.8% for AGIs below $25k , 97.7% for AGIs $25k-50k , 1.5% for AGIs $50k-75k ) Percentage of individuals using paid preparers for their 2020 taxes: 91.2%(% for various income ranges: 90.1% for AGIs below $25k , 91.9% for AGIs $25k-50k , 92.8% for AGIs $50k-75k , 93.0% for AGIs $75k-100k , 90.9% for AGIs $100k-200k , 80.0% for AGIs over 200k )
Averages for the 2012 tax year for zip code 93728, filed in 2013:
Average Adjusted Gross Income (AGI) in 2012: $30,767 (Individual Income Tax Returns) Here:
$30,767State:
$72,726
Salary/wage: $28,168 (reported on 86.0% of returns )Here:
$28,168State:
$59,079
(% of AGI for various income ranges: 77.5% for AGIs below $25k , 85.3% for AGIs $25k-50k , 81.7% for AGIs $50k-75k , 74.6% for AGIs $75k-100k , 87.0% for AGIs $100k-200k ) Taxable interest for individuals: $635 (reported on 18.5% of returns )This zip code:
$635California:
$2,146
(% of AGI for various income ranges: 0.2% for AGIs below $25k , 0.2% for AGIs $25k-50k , 0.3% for AGIs $50k-75k , 0.7% for AGIs $75k-100k , 0.3% for AGIs $100k-200k , 3.0% for AGIs over 200k ) Ordinary dividends: $1,892 (reported on 6.3% of returns )(% of AGI for various income ranges: 0.3% for AGIs below $25k , 0.4% for AGIs $25k-50k , 0.5% for AGIs $50k-75k , 0.3% for AGIs $75k-100k , 0.6% for AGIs $100k-200k ) Net capital gain/loss in AGI: +$326 (reported on 4.5% of returns )(% of AGI for various income ranges: 0.4% for AGIs $75k-100k ) Profit/loss from business: +$10,620 (reported on 14.7% of returns )Here:
+$10,620State:
+$17,064
(% of AGI for various income ranges: 9.9% for AGIs below $25k , 3.1% for AGIs $25k-50k , 1.9% for AGIs $50k-75k , 4.3% for AGIs $75k-100k , 8.1% for AGIs $100k-200k ) Taxable individual retirement arrangement distribution: $9,657 (reported on 3.5% of returns )93728:
$9,657California:
$19,557
(% of AGI for various income ranges: 0.7% for AGIs below $25k , 0.8% for AGIs $25k-50k , 0.9% for AGIs $50k-75k , 2.4% for AGIs $75k-100k , 2.1% for AGIs $100k-200k ) Total itemized deductions: $17,426 (26% of AGI, reported on 15.2% of returns )Here:
$17,426State:
$34,004
Here:
25.6% of AGIState:
22.7% of AGI
(% of AGI for various income ranges: 3.7% for AGIs below $25k , 5.9% for AGIs $25k-50k , 11.1% for AGIs $50k-75k , 13.3% for AGIs $75k-100k , 15.7% for AGIs $100k-200k , 16.4% for AGIs over 200k ) Charity contributions: $2,348 (reported on 11.2% of returns )(% of AGI for various income ranges: 0.2% for AGIs below $25k , 0.6% for AGIs $25k-50k , 1.1% for AGIs $50k-75k , 1.5% for AGIs $75k-100k , 1.6% for AGIs $100k-200k , 2.0% for AGIs over 200k ) Taxes paid: $5,054 (reported on 15.0% of returns )93728:
$5,054State:
$14,448
(% of AGI for various income ranges: 0.5% for AGIs below $25k , 1.2% for AGIs $25k-50k , 3.0% for AGIs $50k-75k , 4.2% for AGIs $75k-100k , 5.8% for AGIs $100k-200k , 8.9% for AGIs over 200k ) Earned income credit: $2,485 (reported on 37.0% of returns )(% of AGI for various income ranges: 10.3% for AGIs below $25k , 1.7% for AGIs $25k-50k ) Percentage of individuals using paid preparers for their 2012 taxes: 50.8%(% for various income ranges: 50.5% for AGIs below $25k , 49.4% for AGIs $25k-50k , 50.0% for AGIs $50k-75k , 56.0% for AGIs $75k-100k , 66.7% for AGIs $100k-200k , 66.7% for AGIs over 200k )
Averages for the 2004 tax year for zip code 93728, filed in 2005:
Average Adjusted Gross Income (AGI) in 2004: $28,342 (Individual Income Tax Returns) Here:
$28,342State:
$58,600
Salary/wage: $26,132 (reported on 88.8% of returns )Here:
$26,132State:
$49,455
(% of AGI for various income ranges: 82.2% for AGIs below $10k , 85.5% for AGIs $10k-25k , 88.1% for AGIs $25k-50k , 83.5% for AGIs $50k-75k , 84.1% for AGIs $75k-100k , 51.2% for AGIs over 100k ) Taxable interest for individuals: $1,044 (reported on 26.6% of returns )This zip code:
$1,044California:
$2,365
(% of AGI for various income ranges: 1.7% for AGIs below $10k , 0.5% for AGIs $10k-25k , 0.8% for AGIs $25k-50k , 0.7% for AGIs $50k-75k , 0.4% for AGIs $75k-100k , 3.1% for AGIs over 100k ) Taxable dividends: $2,021 (reported on 8.3% of returns )(% of AGI for various income ranges: 0.7% for AGIs below $10k , 0.4% for AGIs $10k-25k , 0.3% for AGIs $25k-50k , 0.4% for AGIs $50k-75k , 0.3% for AGIs $75k-100k , 2.4% for AGIs over 100k ) Net capital gain/loss: +$9,327 (reported on 7.0% of returns )Here:
+$9,327State:
+$23,418
(% of AGI for various income ranges: 0.1% for AGIs below $10k , 0.0% for AGIs $10k-25k , 0.4% for AGIs $25k-50k , 0.8% for AGIs $50k-75k , 1.7% for AGIs $75k-100k , 16.2% for AGIs over 100k ) Profit/loss from business: +$9,470 (reported on 12.5% of returns )Here:
+$9,470State:
+$16,826
(% of AGI for various income ranges: 7.8% for AGIs below $10k , 5.1% for AGIs $10k-25k , 2.4% for AGIs $25k-50k , 2.9% for AGIs $50k-75k , 5.1% for AGIs $75k-100k , 8.4% for AGIs over 100k ) IRA payment deduction: $2,092 (reported on 1.5% of returns )93728:
$2,092California:
$3,192
(% of AGI for various income ranges: 0.1% for AGIs $10k-25k , 0.1% for AGIs $25k-50k , 0.1% for AGIs $50k-75k , 0.3% for AGIs $75k-100k ) Total itemized deductions: $14,533 (25% of AGI, reported on 18.6% of returns )Here:
$14,533State:
$28,113
Here:
25.2% of AGIState:
25.3% of AGI
(% of AGI for various income ranges: 5.5% for AGIs below $10k , 4.5% for AGIs $10k-25k , 8.4% for AGIs $25k-50k , 13.0% for AGIs $50k-75k , 14.2% for AGIs $75k-100k , 15.6% for AGIs over 100k ) Charity contributions deductions: $2,308 (4% of AGI, reported on 15.3% of returns )Here:
3.9% of AGIState:
3.3% of AGI
(% of AGI for various income ranges: 0.3% for AGIs below $10k , 0.4% for AGIs $10k-25k , 0.8% for AGIs $25k-50k , 1.7% for AGIs $50k-75k , 1.7% for AGIs $75k-100k , 3.5% for AGIs over 100k ) Total tax: $3,516 (reported on 64.4% of returns )93728:
$3,516State:
$10,761
(% of AGI for various income ranges: 2.0% for AGIs below $10k , 3.5% for AGIs $10k-25k , 6.6% for AGIs $25k-50k , 9.7% for AGIs $50k-75k , 11.8% for AGIs $75k-100k , 17.7% for AGIs over 100k ) Earned income credit: $1,847 (reported on 31.5% of returns )Percentage of individuals using paid preparers for their 2004 taxes: 57.3%(% for various income ranges: 51.1% for AGIs below $10k , 59.0% for AGIs $10k-25k , 56.6% for AGIs $25k-50k , 59.9% for AGIs $50k-75k , 66.4% for AGIs $75k-100k , 84.4% for AGIs over 100k )
Estimated median household income in 2022: This zip code:
$48,011California:
$91,551
Nearest zip codes: 93705 ,
93701 ,
93721 ,
93704 ,
93703 ,
93702 .
Fresno Zip Code Map
Percentage of family households: This zip code:
45.4%California:
46.8%
Percentage of households with unmarried partners: This zip code:
12.5%California:
48.1%
Likely homosexual households (counted as self-reported same-sex unmarried-partner households)
Lesbian couples: 0.5% of all households Gay men: 0.5% of all households
Household received Food Stamps/SNAP in the past 12 months: 2,382Household did not receive Food Stamps/SNAP in the past 12 months: 4,437
Women who had a birth in the past 12 months: 300 (114 now married , 188 unmarried) Women who did not have a birth in the past 12 months: 3,633 (1,025 now married , 2,625 unmarried)
Housing units in zip code 93728 with a mortgage: 1,543 (75
second mortgage , 78
both second mortgage and home equity loan )
Median monthly owner costs for units with a mortgage: $1,624
Median monthly owner costs for units without a mortgage: $493
Residents with income below the poverty level in 2022:
This zip code:
21.5%Whole state:
12.2%
Residents with income below 50% of the poverty level in 2022:
This zip code:
10.1%Whole state:
6.2%
Median number of rooms in houses and condos: Median number of rooms in apartments: Notable locations in this zip code not listed on our city pages
Click to draw/clear zip code borders Notable locations in zip code 93728: (A) , Willis Community Center (B) . Display/hide their locations on the map
Churches in zip code 93728 include: (A) , Fresno Christian Fellowship United Methodist Church (B) , Iglesia Evangelica Rio De Agua Viva (C) , La Nueva Iglesia (D) , Metropolitan Community Church of the Vineyard (E) , Palm Avenue Church of Christ (F) , Praise Chapel Foursquare Church (G) , Saint Therese Roman Catholic Church (H) , Unity Church of Fresno (I) . Display/hide their locations on the map
Cemeteries: (1) , Holy Cross Cemetery (2) , Fresno County Cemetery (3) . Display/hide their locations on the map
Park in zip code 93728: (1) . Display/hide its location on the map
Year house built (houses)
0 2020 or later75 2010 to 2019312 2000 to 200988 1990 to 1999228 1980 to 1989637 1970 to 1979691 1960 to 1969892 1950 to 19591,152 1940 to 19492,712 1939 or earlier
Zip code 93728 household income distribution in 2022 697 Less than $10,000291 $10,000 to $14,999395 $15,000 to $19,999400 $20,000 to $24,999252 $25,000 to $29,999339 $30,000 to $34,999531 $35,000 to $39,999289 $40,000 to $44,999162 $45,000 to $49,999308 $50,000 to $59,999531 $60,000 to $74,999725 $75,000 to $99,999574 $100,000 to $124,999356 $125,000 to $149,999234 $150,000 to $199,999420 $200,000 or moreEstimate of home value of owner-occupied houses/condos in 2022 in zip code 93728 77 Less than $10,00038 $20,000 to $24,9995 $25,000 to $29,99937 $40,000 to $49,99911 $50,000 to $59,99922 $70,000 to $79,99924 $80,000 to $89,9993 $90,000 to $99,999155 $100,000 to $124,99953 $125,000 to $149,99993 $150,000 to $174,99958 $175,000 to $199,999568 $200,000 to $249,999229 $250,000 to $299,999200 $300,000 to $399,999194 $400,000 to $499,99955 $500,000 to $749,99917 $750,000 to $999,99912 $1,000,000 to $1,499,99920 $1,500,000 to $1,999,999Rent paid by renters in 2022 in zip code 93728 44 $100 to $14952 $200 to $249160 $250 to $29935 $350 to $399107 $400 to $449140 $450 to $499148 $500 to $54938 $550 to $599207 $600 to $649118 $650 to $699126 $700 to $749123 $750 to $799618 $800 to $899405 $900 to $999818 $1,000 to $1,249284 $1,250 to $1,499542 $1,500 to $1,99990 No cash rent
Median gross rent in 2022: $1,160.
Median price asked for vacant for-sale houses and condos in 2022: $480,785.
Estimated median house (or condo) value in 2022 for: White Non-Hispanic householders: $276,644Black or African American householders: $233,948American Indian or Alaska Native householders: $296,757Asian householders: $335,219Some other race householders: $241,005Two or more races householders: $264,647Hispanic or Latino householders: $253,002Estimated median house or condo value in 2022: $253,003
93728:
$253,003California:
$715,900
Lower value quartile - upper value quartile: $205,497 - $322,368
Mean price in 2022: Detached houses: $404,942Here:
$404,942State:
$988,808
Townhouses or other attached units: $321,089Here:
$321,089State:
$838,546
In 2-unit structures: $201,640Here:
$201,640State:
$1,138,100
In 3-to-4-unit structures: $256,694Here:
$256,694State:
$824,253
In 5-or-more-unit structures: $149,910Here:
$149,910State:
$730,996
Mobile homes: $117,052Here:
$117,052State:
$184,506
Housing units in structures:
One, detached: 4,423One, attached: 228Two: 2693 or 4: 3105 to 9: 54110 to 19: 23120 to 49: 7650 or more: 250Mobile homes: 453Boats, RVs, vans, etc.: 74Unemployment : 9.4%
Means of transportation to work in zip code 93728 69.9% 5,689 Drove a car alone8.9% 726 Carpooled0.3% 21 Bus or trolley bus1.1% 88 Motorcycle1.1% 88 Bicycle4.2% 341 Walked0.4% 35 Other means14.1% 1,149 Worked at homeTravel time to work (commute) in zip code 93728 280 Less than 5 minutes549 5 to 9 minutes1,362 10 to 14 minutes1,906 15 to 19 minutes1,041 20 to 24 minutes240 25 to 29 minutes663 30 to 34 minutes312 35 to 39 minutes167 40 to 44 minutes168 45 to 59 minutes149 60 to 89 minutes91 90 or more minutes
Neighborhoods in zip code 93728: Percentage of zip code residents living and working in this county: 96.0%
Household type by relationship:
Households: 17,743
Male householders: 2,791 (863 living alone ), Female householders: 3,707 (1,204 living alone )1,955 spouses (1,933 opposite-sex spouses ), 938 unmarried partners , (924 opposite-sex unmarried partners ), 5,567 children (5,295 natural , 41 adopted , 229 stepchildren ), 773 grandchildren , 394 brothers or sisters , 335 parents , 33 foster children , 437 other relatives , 697 non-relatives In group quarters: 144 (-1 institutionalized population )
Size of family households: 1,254 2-persons , 935 3-persons , 419 4-persons , 697 5-persons , 226 6-persons , 204 7-or-more-persons
Size of nonfamily households: 2,069 1-person , 586 2-persons , 107 3-persons , 18 4-persons
1,828 married couples with children. single-parent households (326 men , 1,263 women ).
55.2% of residents of 93728 zip code speak English at home. of residents speak Spanish at home (74% very well, 9% well, 10% not well, 7% not at all ).of residents speak other Indo-European language at home (58% very well, 42% not at all ).of residents speak Asian or Pacific Island language at home (69% very well, 3% well, 21% not well, 7% not at all ).
Foreign born population: 2,275 (12.8%)
(46.3%
of them are naturalized citizens )
This zip code:
12.8%Whole state:
26.7%
81% Honduras 5% Indonesia 3% Poland 3% Malaysia 2% Guyana 1% France 1% Sweden 3% German 2% Irish 1% Portuguese 1% English 1% Italian 1% European 1% Armenian
Year of entry for the foreign-born population
141 2010 or later 389 2000 to 2009 636 1990 to 1999 1,140 Before 1990
There are
92 Medical Specialists in Zip Code 93728 .
Facilities with environmental interests located in this zip code:
ADDAMS ELEMENTARY SCHOOL (2117 W. MCKINLEY in FRESNO, CA)
(Geographic Names Information System) (National Center for Education Statistics) - STATE ID-6006068 Small Quantity Generators, between 100 kg and 1000 kg of hazardous waste/month (Resource Conservation and Recovery Act (tracking hazardous waste)) - notification Organizations: FRESNO UNIF SCHL DIST (CONTACT/OWNER)
, FRESNO UNIFIED (SCHOOL DISTRICT)
Alternative names: FRESNO USD ADDAMS ELEM
MUIR ELEMENTARY (410 E. DENNETT in FRESNO, CA)
(National Center for Education Statistics) - STATE ID-6006415 Small Quantity Generators, between 100 kg and 1000 kg of hazardous waste/month (Resource Conservation and Recovery Act (tracking hazardous waste)) - notification Organizations: FRESNO UNIF SCHOOL DIST (CONTACT/OWNER)
, FRESNO UNIFIED (SCHOOL DISTRICT)
Alternative names: FRESNO USD MUIR ELEM
FRESNO USD HEATON ELEMENTARY SCH (1533 N SAN PABLO in FRESNO, CA)
(National Center for Education Statistics) - STATE ID-6006274 Small Quantity Generators, between 100 kg and 1000 kg of hazardous waste/month (Resource Conservation and Recovery Act (tracking hazardous waste)) Organizations: FRESNO UNIFIED (SCHOOL DISTRICT)
ANTHONY (SUSAN B.) ELEMENTARY (1050 N. GLENN AVE. in FRESNO, CA)
(National Center for Education Statistics) - STATE ID-6111231 Organizations: FRESNO UNIFIED (SCHOOL DISTRICT)
FLASH FOTO (1444 N VAN NESS in FRESNO, CA)
Small Quantity Generators, between 100 kg and 1000 kg of hazardous waste/month (Resource Conservation and Recovery Act (tracking hazardous waste)) - notification Organizations: TIM FLEMING (CONTACT/OWNER)
INTERSTATE WATER TREATMENT INC (1433 W PINE AVE in FRESNO, CA)
Small Quantity Generators, between 100 kg and 1000 kg of hazardous waste/month (Resource Conservation and Recovery Act (tracking hazardous waste)) Business NAICS classification: ALL OTHER BUSINESS SUPPORT SERVICES.
CHAPEL OF LIGHT (1620 W. BELMONT in FRESNO, CA)
CRITERIA AND HAZARDOUS AIR POLLUTANT INVENTORY (Inventory of air pollution sources) Business SIC classification: FUNERAL SERVICE AND CREMATORIES
Housing units lacking complete plumbing facilities: 0.6%
Housing units lacking complete kitchen facilities: 1.4%
58.0% Utility gas 37.9% Electricity 1.3% No fuel used 1.2% Solar energy 0.7% Bottled, tank, or LP gas 0.7% Fuel oil, kerosene, etc.
Population in 1990: 15,386. Population change in the 1990s: +953 (+6.2%).
Place of birth for U.S.-born residents:
This state: 13,972Northeast: 98Midwest: 481South: 406West: 425
49% of the 93728 zip code residents lived in the same house 5 years ago.
Out of people who lived in different houses, 79% lived in this county.
Out of people who lived in different counties, 50% lived in California.
91% of the 93728 zip code residents lived in the same house 1 year ago.
Out of people who lived in different houses, 75% moved from this county.
Out of people who lived in different houses, 22% moved from different county within same state.
Out of people who lived in different houses, 1% moved from different state.
Private vs. public school enrollment:
Students in private schools in grades 1 to 8 (elementary and middle school): 85
Here:
4.5%California:
10.5%
Students in private schools in grades 9 to 12 (high school): 26
Students in private undergraduate colleges: 104
Here:
10.7%California:
15.9%
Occupation by median earnings in the past 12 months ($)
121,259 Health diagnosing and treating practitioners and other technical occupations 116,437 Life, physical, and social science occupations 78,518 Community and social service occupations 68,940 Legal occupations 60,559 Management occupations 57,716 Computer and mathematical occupations
Companies with federal contracts located in this zip code:
SIERRA TRIBAL CONSORTIUM (610 WEST MCKINLEY AVE in FRESNO, CA) in 4 contracts from 2002 to 2004
$855,504 with Public Health Service for Other Social Services. Signed on 2004-02-17. Effective on 2004-03-01. Completion date: 2005-02-28.
, same as above. Signed on 2004-02-17. Effective on 2004-03-01. Completion date: 2005-02-28.
, same as above. Signed on 2002-07-10. Completion date: 1995-02-28.
, same as above. Signed on 2002-07-10. Completion date: 1995-02-28.
PAUL J HOLCOMB & SON INC (1420 N HUGHES AVE in FRESNO, CA; small business)
$20,764 with U.S. Army Corps of Engineers - civil program financing only for Generators and Generators Sets, Electrical. Signed on 2001-09-20. Completion date: 2001-11-30.
SAN JOAQUIN FILTER RECYCLING & (1922 W BELMONT AVE in FRESNO, CA; small business) in 3 contracts from 2001 to 2003
$10,000 with Navy for Solid Fuel Handling Services. Signed on 2003-05-01. Completion date: 2004-04-30.
with Navy for Oil Spill Response including Cleanup, Removal, Disposal and Operational Support. Signed on 2001-10-01. Completion date: 2002-01-09.
, same as above. Signed on 2002-06-25. Completion date: 2002-01-09.
Top industries in this zip code by the number of employees in 2005:
Administrative and Support and Waste Management and Remediation Services: Temporary Help Services (250-499 employees: 1 establishment, 20-49 employees: 1 establishment)Accommodation and Food Services: Full-Service Restaurants (50-99: 1, 20-49: 4, 10-19: 4, 5-9: 4, 1-4: 4)Accommodation and Food Services: Limited-Service Restaurants (20-49: 3, 10-19: 4, 5-9: 2, 1-4: 4)Construction: Framing Contractors (100-249: 1, 1-4: 1)Accommodation and Food Services: Drinking Places (Alcoholic Beverages) (20-49: 2, 10-19: 1, 5-9: 1, 1-4: 1)Arts, Entertainment, and Recreation: Theater Companies and Dinner Theaters (20-49: 2, 10-19: 1)Construction: Painting and Wall Covering Contractors (50-99: 1, 5-9: 1)Construction: New Single-Family Housing Construction (except Operative Builders) (50-99: 1, 1-4: 1)
People in group quarters in 2010:
74 people in other noninstitutional facilities
29 people in residential treatment centers for adults
20 people in group homes intended for adults
9 people in workers' group living quarters and job corps centers
6 people in correctional residential facilities
6 people in group homes for juveniles (non-correctional)
People in group quarters in 2000:
93 people in other noninstitutional group quarters
65 people in homes or halfway houses for drug/alcohol abuse
18 people in halfway houses
12 people in homes for the mentally ill
Fatal accident statistics in 2014:
Fatal accident count: 2Vehicles involved in fatal accidents: 3Fatal accidents caused by drunken drivers: 1Fatalities: 2Persons involved in fatal accidents: 3Pedestrians involved in fatal accidents: 1
Fatal accident statistics in 2013:
Fatal accident count: 1Vehicles involved in fatal accidents: 1Fatal accidents caused by drunken drivers: 1Fatalities: 1Persons involved in fatal accidents: 2Pedestrians involved in fatal accidents: 0
Home Mortgage Disclosure Act Aggregated Statistics For Year 2009(Based on 4 full and 4 partial tracts) A) FHA, FSA/RHS & VA B) Conventional C) Refinancings D) Home Improvement Loans E) Loans on Dwellings For 5+ Families F) Non-occupant Loans on G) Loans On Manufactured Number Average Value Number Average Value Number Average Value Number Average Value Number Average Value Number Average Value Number Average Value
LOANS ORIGINATED 100 $119,565 80 $83,769 115 $144,108 7 $43,051 4 $557,322 63 $84,206 0 $0 APPLICATIONS APPROVED, NOT ACCEPTED 14 $90,403 11 $70,876 28 $128,654 4 $13,955 0 $0 13 $77,860 0 $0 APPLICATIONS DENIED 21 $91,016 33 $83,195 120 $129,410 14 $54,120 2 $204,145 32 $92,075 6 $13,717 APPLICATIONS WITHDRAWN 15 $103,854 25 $85,984 45 $126,352 0 $0 4 $473,378 17 $101,848 0 $0 FILES CLOSED FOR INCOMPLETENESS 2 $53,795 2 $35,670 14 $99,359 0 $0 0 $0 3 $40,980 0 $0
Aggregated Statistics For Year 2008(Based on 4 full and 4 partial tracts) A) FHA, FSA/RHS & VA B) Conventional C) Refinancings D) Home Improvement Loans E) Loans on Dwellings For 5+ Families F) Non-occupant Loans on G) Loans On Manufactured Number Average Value Number Average Value Number Average Value Number Average Value Number Average Value Number Average Value Number Average Value
LOANS ORIGINATED 107 $146,937 101 $130,266 152 $142,356 28 $51,817 5 $1,867,402 85 $119,168 4 $23,425 APPLICATIONS APPROVED, NOT ACCEPTED 11 $161,531 38 $124,280 50 $157,221 8 $31,756 0 $0 17 $85,352 1 $39,250 APPLICATIONS DENIED 17 $125,064 45 $108,194 275 $176,292 57 $75,117 4 $309,778 85 $142,584 10 $35,074 APPLICATIONS WITHDRAWN 11 $146,644 16 $134,953 75 $154,037 11 $39,847 0 $0 12 $116,826 0 $0 FILES CLOSED FOR INCOMPLETENESS 0 $0 2 $197,250 32 $179,507 0 $0 0 $0 5 $145,238 0 $0
Aggregated Statistics For Year 2007(Based on 4 full and 4 partial tracts) A) FHA, FSA/RHS & VA B) Conventional C) Refinancings D) Home Improvement Loans E) Loans on Dwellings For 5+ Families F) Non-occupant Loans on G) Loans On Manufactured Number Average Value Number Average Value Number Average Value Number Average Value Number Average Value Number Average Value Number Average Value
LOANS ORIGINATED 2 $68,740 291 $151,257 610 $158,895 74 $103,012 8 $1,679,780 229 $156,055 14 $39,614 APPLICATIONS APPROVED, NOT ACCEPTED 0 $0 99 $168,520 215 $155,211 19 $66,525 0 $0 59 $174,103 6 $34,063 APPLICATIONS DENIED 0 $0 144 $189,370 570 $181,747 86 $115,118 7 $303,076 145 $186,150 8 $80,015 APPLICATIONS WITHDRAWN 0 $0 45 $161,264 217 $179,165 29 $113,834 2 $618,140 69 $156,627 3 $46,850 FILES CLOSED FOR INCOMPLETENESS 0 $0 10 $178,193 89 $188,261 3 $94,543 0 $0 15 $185,812 0 $0
Aggregated Statistics For Year 2006(Based on 4 full and 4 partial tracts) A) FHA, FSA/RHS & VA B) Conventional C) Refinancings D) Home Improvement Loans E) Loans on Dwellings For 5+ Families F) Non-occupant Loans on G) Loans On Manufactured Number Average Value Number Average Value Number Average Value Number Average Value Number Average Value Number Average Value Number Average Value
LOANS ORIGINATED 7 $238,444 573 $147,088 915 $165,724 119 $108,457 19 $682,143 356 $158,124 3 $41,363 APPLICATIONS APPROVED, NOT ACCEPTED 0 $0 130 $142,881 261 $157,589 29 $111,158 0 $0 85 $155,808 1 $40,520 APPLICATIONS DENIED 1 $206,390 274 $154,620 692 $174,763 126 $81,204 3 $478,107 201 $156,389 5 $39,758 APPLICATIONS WITHDRAWN 1 $206,390 125 $144,523 406 $177,121 26 $72,316 0 $0 65 $168,006 0 $0 FILES CLOSED FOR INCOMPLETENESS 0 $0 45 $167,660 107 $170,944 6 $62,812 3 $485,377 22 $181,320 0 $0
Aggregated Statistics For Year 2005(Based on 4 full and 4 partial tracts) A) FHA, FSA/RHS & VA B) Conventional C) Refinancings D) Home Improvement Loans E) Loans on Dwellings For 5+ Families F) Non-occupant Loans on G) Loans On Manufactured Number Average Value Number Average Value Number Average Value Number Average Value Number Average Value Number Average Value Number Average Value
LOANS ORIGINATED 4 $134,525 781 $142,668 1,219 $149,262 172 $101,676 17 $1,245,490 483 $152,063 0 $0 APPLICATIONS APPROVED, NOT ACCEPTED 0 $0 128 $134,939 177 $145,423 33 $135,902 0 $0 86 $160,717 2 $75,710 APPLICATIONS DENIED 0 $0 287 $141,380 536 $144,203 143 $74,464 1 $443,170 121 $143,457 10 $72,167 APPLICATIONS WITHDRAWN 0 $0 154 $139,290 531 $151,759 72 $138,356 2 $197,315 68 $159,151 0 $0 FILES CLOSED FOR INCOMPLETENESS 0 $0 29 $131,156 111 $143,410 6 $102,842 0 $0 19 $118,348 0 $0
Aggregated Statistics For Year 2004(Based on 4 full and 4 partial tracts) A) FHA, FSA/RHS & VA B) Conventional C) Refinancings D) Home Improvement Loans E) Loans on Dwellings For 5+ Families F) Non-occupant Loans on G) Loans On Manufactured Number Average Value Number Average Value Number Average Value Number Average Value Number Average Value Number Average Value Number Average Value
LOANS ORIGINATED 17 $127,755 678 $127,102 1,117 $114,228 93 $85,772 19 $428,207 475 $117,135 7 $68,581 APPLICATIONS APPROVED, NOT ACCEPTED 0 $0 133 $125,154 220 $111,940 20 $76,120 2 $597,720 68 $123,176 6 $71,482 APPLICATIONS DENIED 9 $113,029 278 $127,587 545 $112,036 155 $71,507 8 $549,135 131 $116,870 11 $71,263 APPLICATIONS WITHDRAWN 4 $73,720 110 $120,573 505 $108,715 24 $69,642 0 $0 68 $103,885 0 $0 FILES CLOSED FOR INCOMPLETENESS 0 $0 20 $117,453 91 $119,110 9 $57,111 0 $0 23 $115,627 0 $0
Aggregated Statistics For Year 2003(Based on 4 full and 4 partial tracts) A) FHA, FSA/RHS & VA B) Conventional C) Refinancings D) Home Improvement Loans E) Loans on Dwellings For 5+ Families F) Non-occupant Loans on Number Average Value Number Average Value Number Average Value Number Average Value Number Average Value Number Average Value
LOANS ORIGINATED 64 $106,428 564 $95,304 1,315 $88,999 49 $35,000 3 $394,700 454 $86,095 APPLICATIONS APPROVED, NOT ACCEPTED 7 $102,987 77 $94,642 185 $88,296 11 $40,497 0 $0 65 $88,065 APPLICATIONS DENIED 11 $96,067 117 $90,776 523 $87,980 57 $30,824 2 $796,845 119 $89,251 APPLICATIONS WITHDRAWN 17 $97,376 65 $115,249 339 $91,306 12 $29,255 0 $0 49 $90,841 FILES CLOSED FOR INCOMPLETENESS 3 $83,147 19 $77,175 74 $78,611 2 $39,850 0 $0 15 $74,023
Aggregated Statistics For Year 2002(Based on 4 full and 4 partial tracts) A) FHA, FSA/RHS & VA B) Conventional C) Refinancings D) Home Improvement Loans E) Loans on Dwellings For 5+ Families F) Non-occupant Loans on Number Average Value Number Average Value Number Average Value Number Average Value Number Average Value Number Average Value
LOANS ORIGINATED 122 $90,306 380 $80,185 689 $75,999 24 $27,217 11 $319,897 266 $68,044 APPLICATIONS APPROVED, NOT ACCEPTED 7 $71,271 41 $96,155 116 $73,436 7 $21,617 0 $0 22 $96,632 APPLICATIONS DENIED 28 $80,886 85 $72,002 352 $71,638 35 $18,524 2 $398,800 61 $66,155 APPLICATIONS WITHDRAWN 10 $78,711 71 $82,134 270 $85,545 11 $34,965 0 $0 47 $68,187 FILES CLOSED FOR INCOMPLETENESS 0 $0 17 $102,494 64 $73,051 0 $0 0 $0 21 $71,111
Aggregated Statistics For Year 2001(Based on 4 full and 4 partial tracts) A) FHA, FSA/RHS & VA B) Conventional C) Refinancings D) Home Improvement Loans E) Loans on Dwellings For 5+ Families F) Non-occupant Loans on Number Average Value Number Average Value Number Average Value Number Average Value Number Average Value Number Average Value
LOANS ORIGINATED 166 $76,822 212 $68,853 398 $71,402 19 $44,999 3 $2,262,400 157 $61,889 APPLICATIONS APPROVED, NOT ACCEPTED 17 $85,464 41 $70,829 82 $64,151 3 $11,830 0 $0 25 $70,862 APPLICATIONS DENIED 21 $77,463 73 $55,744 322 $66,807 48 $24,001 0 $0 60 $63,284 APPLICATIONS WITHDRAWN 22 $78,644 42 $103,364 182 $73,591 11 $19,293 0 $0 27 $95,106 FILES CLOSED FOR INCOMPLETENESS 4 $56,302 6 $76,540 58 $63,382 3 $4,643 0 $0 8 $61,536
Aggregated Statistics For Year 2000(Based on 4 full and 4 partial tracts) A) FHA, FSA/RHS & VA B) Conventional C) Refinancings D) Home Improvement Loans E) Loans on Dwellings For 5+ Families F) Non-occupant Loans on Number Average Value Number Average Value Number Average Value Number Average Value Number Average Value Number Average Value
LOANS ORIGINATED 224 $70,885 232 $59,674 184 $49,599 40 $19,247 0 $0 118 $54,173 APPLICATIONS APPROVED, NOT ACCEPTED 7 $52,163 29 $62,436 53 $55,774 24 $25,472 0 $0 15 $56,159 APPLICATIONS DENIED 38 $66,987 82 $54,392 273 $56,500 71 $18,549 0 $0 41 $59,967 APPLICATIONS WITHDRAWN 34 $65,177 42 $71,893 117 $65,079 17 $15,852 3 $225,140 29 $69,286 FILES CLOSED FOR INCOMPLETENESS 7 $49,654 9 $67,121 32 $59,178 2 $18,975 0 $0 5 $49,612
Aggregated Statistics For Year 1999(Based on 2 full and 2 partial tracts) A) FHA, FSA/RHS & VA B) Conventional C) Refinancings D) Home Improvement Loans E) Loans on Dwellings For 5+ Families F) Non-occupant Loans on Number Average Value Number Average Value Number Average Value Number Average Value Number Average Value Number Average Value
LOANS ORIGINATED 96 $65,306 89 $52,858 148 $55,140 9 $14,718 2 $222,420 78 $47,552 APPLICATIONS APPROVED, NOT ACCEPTED 4 $50,560 12 $61,092 32 $52,328 10 $19,154 0 $0 10 $52,607 APPLICATIONS DENIED 21 $66,874 41 $65,866 117 $56,508 23 $14,847 0 $0 19 $55,989 APPLICATIONS WITHDRAWN 10 $66,129 21 $82,964 81 $61,454 5 $15,876 0 $0 17 $71,450 FILES CLOSED FOR INCOMPLETENESS 2 $90,775 3 $75,570 19 $58,953 0 $0 1 $218,770 0 $0
Detailed HMDA statistics for the following Tracts:
0020.00
,
0021.00 ,
0022.00 ,
0023.00
Private Mortgage Insurance Companies Aggregated Statistics For Year 2009(Based on 2 full and 4 partial tracts) A) Conventional C) Non-occupant Loans on Number Average Value Number Average Value
LOANS ORIGINATED 6 $77,012 0 $0 APPLICATIONS APPROVED, NOT ACCEPTED 3 $49,580 2 $45,535 APPLICATIONS DENIED 0 $0 0 $0 APPLICATIONS WITHDRAWN 0 $0 0 $0 FILES CLOSED FOR INCOMPLETENESS 0 $0 0 $0
Aggregated Statistics For Year 2008(Based on 4 full and 4 partial tracts) A) Conventional B) Refinancings C) Non-occupant Loans on Number Average Value Number Average Value Number Average Value
LOANS ORIGINATED 34 $173,199 5 $196,490 4 $141,958 APPLICATIONS APPROVED, NOT ACCEPTED 27 $195,120 26 $214,408 3 $183,653 APPLICATIONS DENIED 9 $127,447 2 $186,290 4 $129,505 APPLICATIONS WITHDRAWN 0 $0 0 $0 0 $0 FILES CLOSED FOR INCOMPLETENESS 0 $0 0 $0 0 $0
Aggregated Statistics For Year 2007(Based on 4 full and 4 partial tracts) A) Conventional B) Refinancings C) Non-occupant Loans on Number Average Value Number Average Value Number Average Value
LOANS ORIGINATED 63 $212,255 53 $224,038 11 $223,220 APPLICATIONS APPROVED, NOT ACCEPTED 20 $181,310 12 $251,660 4 $158,522 APPLICATIONS DENIED 0 $0 2 $314,055 0 $0 APPLICATIONS WITHDRAWN 6 $193,595 0 $0 0 $0 FILES CLOSED FOR INCOMPLETENESS 0 $0 0 $0 0 $0
Aggregated Statistics For Year 2006(Based on 4 full and 4 partial tracts) A) Conventional B) Refinancings C) Non-occupant Loans on Number Average Value Number Average Value Number Average Value
LOANS ORIGINATED 25 $225,464 21 $241,077 10 $215,693 APPLICATIONS APPROVED, NOT ACCEPTED 0 $0 10 $212,560 0 $0 APPLICATIONS DENIED 0 $0 0 $0 0 $0 APPLICATIONS WITHDRAWN 0 $0 4 $206,380 0 $0 FILES CLOSED FOR INCOMPLETENESS 0 $0 0 $0 0 $0
Aggregated Statistics For Year 2005(Based on 4 full and 4 partial tracts) A) Conventional B) Refinancings C) Non-occupant Loans on Number Average Value Number Average Value Number Average Value
LOANS ORIGINATED 48 $176,010 29 $178,473 15 $212,168 APPLICATIONS APPROVED, NOT ACCEPTED 11 $182,045 7 $222,297 9 $199,479 APPLICATIONS DENIED 2 $130,500 5 $302,930 5 $258,622 APPLICATIONS WITHDRAWN 2 $162,380 2 $139,470 0 $0 FILES CLOSED FOR INCOMPLETENESS 0 $0 0 $0 0 $0
Aggregated Statistics For Year 2004(Based on 4 full and 4 partial tracts) A) Conventional B) Refinancings C) Non-occupant Loans on D) Loans On Manufactured Number Average Value Number Average Value Number Average Value Number Average Value
LOANS ORIGINATED 92 $144,340 37 $159,514 35 $121,896 1 $189,930 APPLICATIONS APPROVED, NOT ACCEPTED 16 $129,959 9 $107,560 7 $105,727 0 $0 APPLICATIONS DENIED 2 $171,485 0 $0 0 $0 0 $0 APPLICATIONS WITHDRAWN 9 $119,078 0 $0 4 $106,562 0 $0 FILES CLOSED FOR INCOMPLETENESS 0 $0 1 $88,630 0 $0 0 $0
Aggregated Statistics For Year 2003(Based on 4 full and 4 partial tracts) A) Conventional B) Refinancings C) Non-occupant Loans on Number Average Value Number Average Value Number Average Value
LOANS ORIGINATED 153 $113,215 52 $110,294 34 $98,977 APPLICATIONS APPROVED, NOT ACCEPTED 24 $103,118 19 $86,172 2 $43,255 APPLICATIONS DENIED 3 $79,880 2 $85,755 4 $81,262 APPLICATIONS WITHDRAWN 7 $101,960 7 $83,011 2 $62,990 FILES CLOSED FOR INCOMPLETENESS 0 $0 2 $67,740 2 $67,740
Aggregated Statistics For Year 2002(Based on 4 full and 4 partial tracts) A) Conventional B) Refinancings C) Non-occupant Loans on Number Average Value Number Average Value Number Average Value
LOANS ORIGINATED 146 $89,435 54 $88,857 44 $65,190 APPLICATIONS APPROVED, NOT ACCEPTED 14 $102,651 14 $120,991 7 $81,994 APPLICATIONS DENIED 0 $0 3 $89,297 0 $0 APPLICATIONS WITHDRAWN 2 $64,755 2 $53,795 2 $64,755 FILES CLOSED FOR INCOMPLETENESS 0 $0 0 $0 0 $0
Aggregated Statistics For Year 2001(Based on 4 full and 4 partial tracts) A) Conventional B) Refinancings C) Non-occupant Loans on Number Average Value Number Average Value Number Average Value
LOANS ORIGINATED 86 $72,266 29 $78,152 21 $60,988 APPLICATIONS APPROVED, NOT ACCEPTED 16 $75,129 0 $0 7 $55,891 APPLICATIONS DENIED 0 $0 0 $0 0 $0 APPLICATIONS WITHDRAWN 2 $61,470 2 $55,830 0 $0 FILES CLOSED FOR INCOMPLETENESS 2 $50,085 0 $0 0 $0
Aggregated Statistics For Year 2000(Based on 4 full and 4 partial tracts) A) Conventional B) Refinancings C) Non-occupant Loans on Number Average Value Number Average Value Number Average Value
LOANS ORIGINATED 73 $63,503 15 $58,291 16 $64,828 APPLICATIONS APPROVED, NOT ACCEPTED 8 $68,756 2 $76,705 0 $0 APPLICATIONS DENIED 2 $76,705 2 $65,265 0 $0 APPLICATIONS WITHDRAWN 0 $0 0 $0 0 $0 FILES CLOSED FOR INCOMPLETENESS 0 $0 0 $0 0 $0
Aggregated Statistics For Year 1999(Based on 2 full and 2 partial tracts) A) Conventional B) Refinancings C) Non-occupant Loans on Number Average Value Number Average Value Number Average Value
LOANS ORIGINATED 25 $75,555 11 $88,982 8 $51,771 APPLICATIONS APPROVED, NOT ACCEPTED 0 $0 0 $0 0 $0 APPLICATIONS DENIED 1 $57,650 0 $0 0 $0 APPLICATIONS WITHDRAWN 1 $72,270 0 $0 0 $0 FILES CLOSED FOR INCOMPLETENESS 0 $0 0 $0 0 $0
Detailed PMIC statistics for the following Tracts:
0020.00
,
0021.00 ,
0022.00 ,
0023.00
2004 - 2018 National Fire Incident Reporting System (NFIRS) incidents See full 2006 National Fire Incident Reporting System statistics for zip code 93728, California
Most common first names in zip code 93728 among deceased individuals Name Count Lived (average)
John 144 74.2 years Mary 115 80.3 years William 91 76.5 years George 70 74.4 years James 69 71.5 years Charles 63 74.7 years Robert 61 68.2 years Frank 53 75.3 years Joseph 43 72.8 years Dorothy 42 77.0 years
Most common last names in zip code 93728 among deceased individuals Last name Count Lived (average)
Smith 56 74.6 years Johnson 37 78.7 years Brown 35 73.0 years Jones 27 73.4 years Garcia 27 65.8 years Hernandez 24 67.8 years Davis 21 71.3 years Wilson 21 73.2 years Moore 21 77.1 years Nelson 18 75.6 years
Businesses in zip code 93728
Name Count Name Count
7-Eleven 1 Knights Inn 1 Blockbuster 1 Long John Silver's 1 Circle K 2 McDonald's 1 Cricket Wireless 2 Motel 6 1 Days Inn 1 Starbucks 1 Dennys 1 Subway 1 H&R Block 1 Super 8 1 Holiday Inn 1 Taco Bell 1 KFC 1 UPS 3
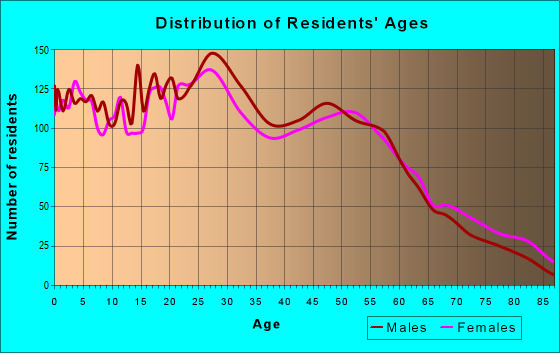
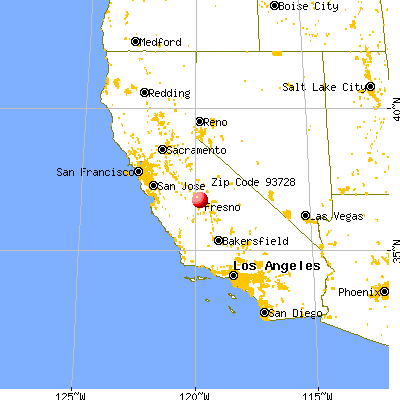


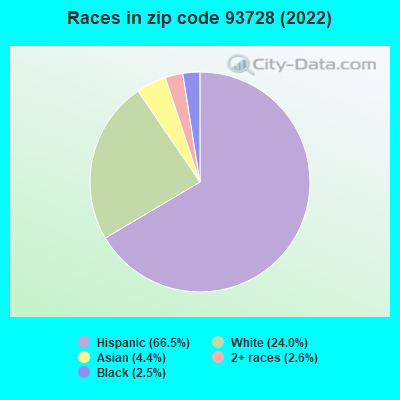


 Nearest zip codes: 93705, 93701, 93721, 93704, 93703, 93702.
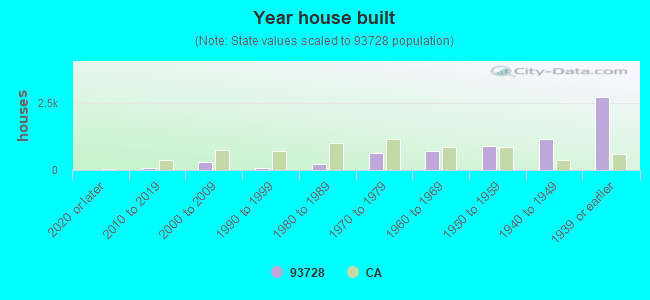
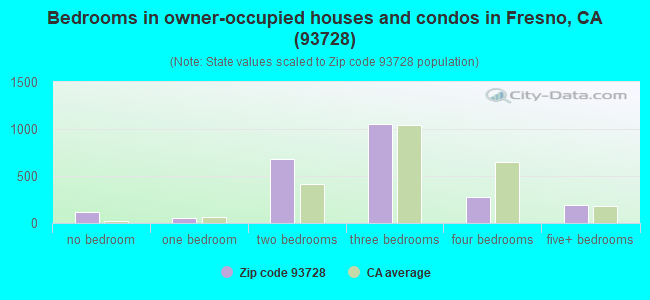
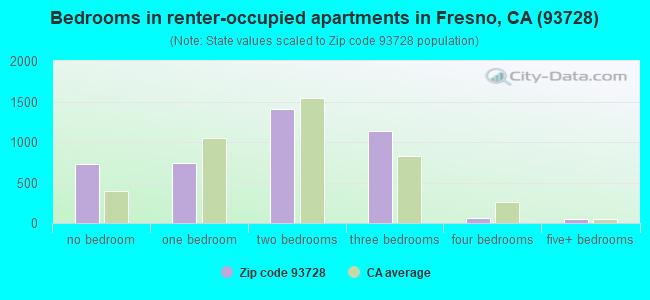
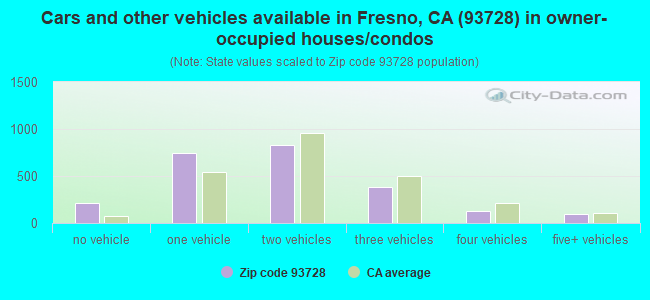
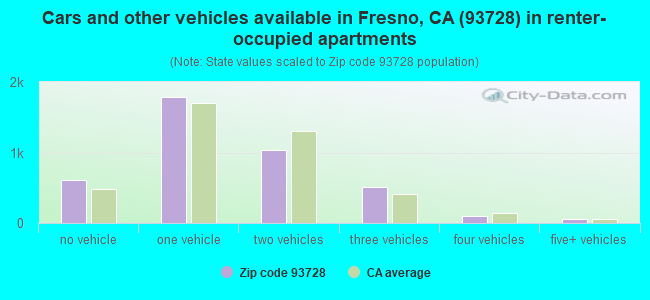


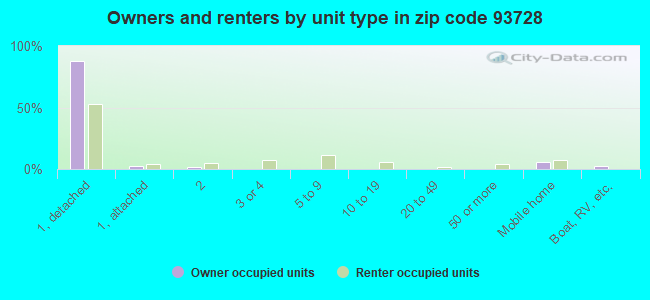
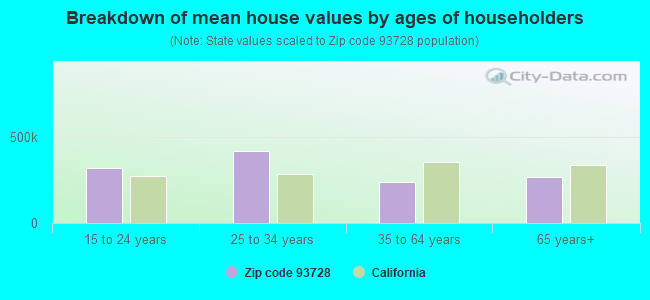


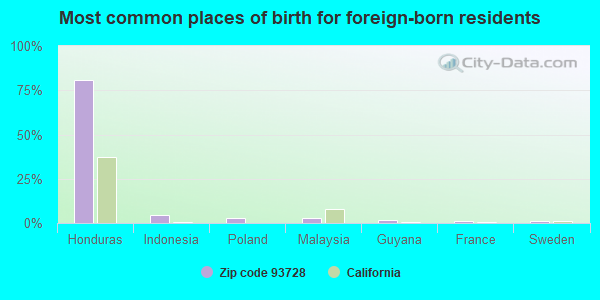
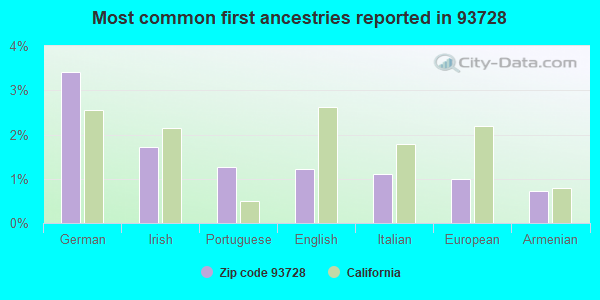
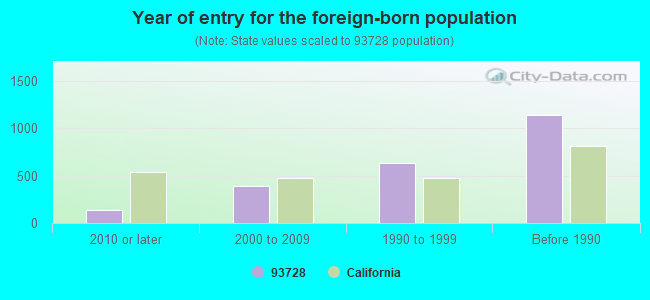


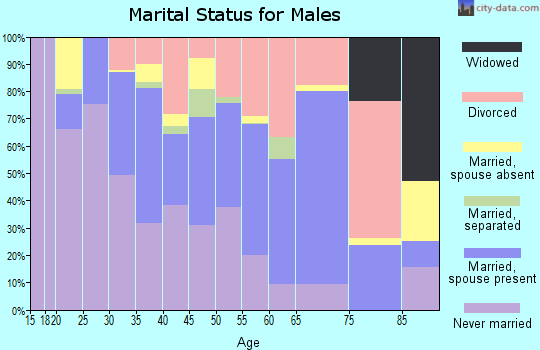
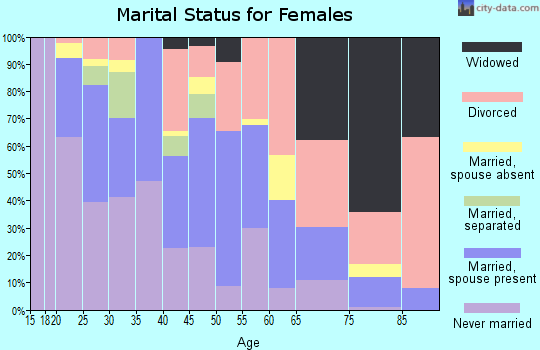
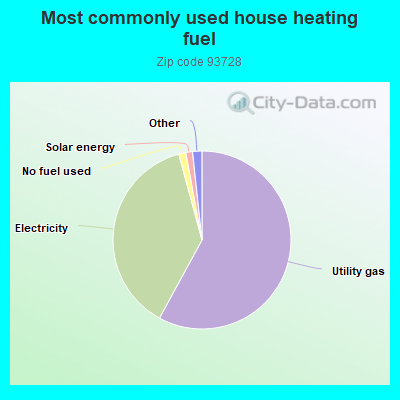
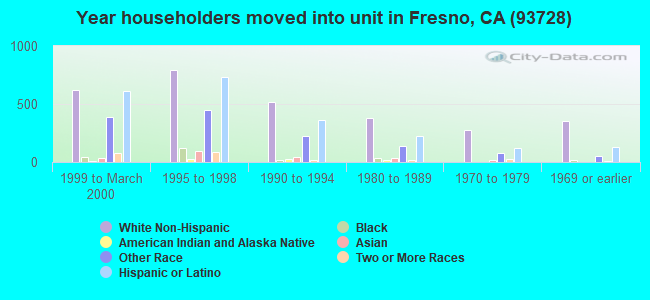
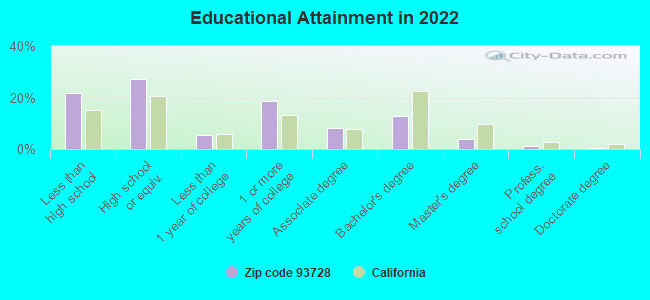
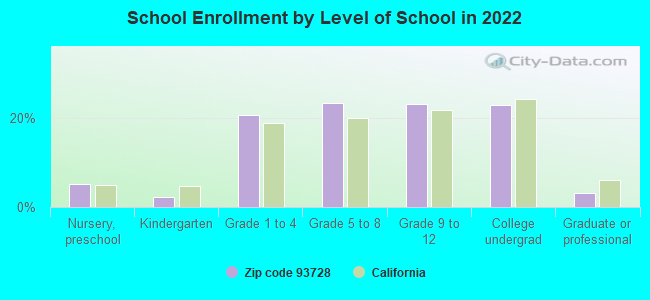
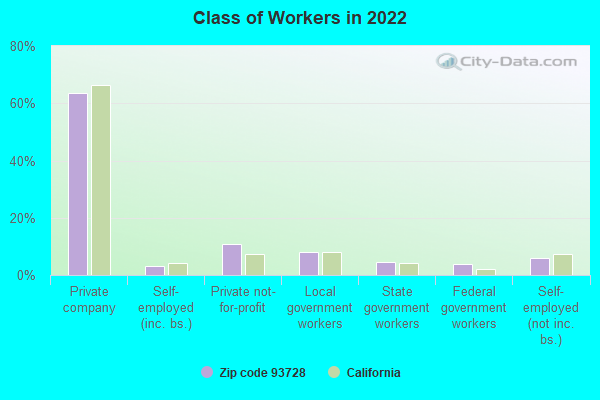
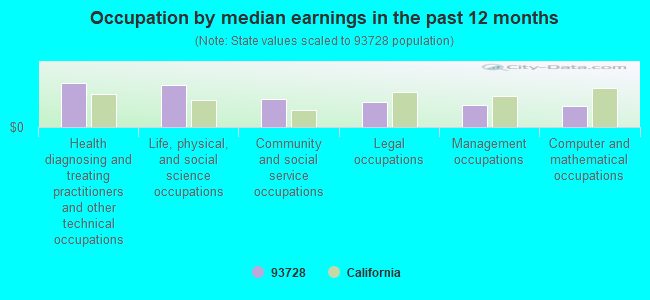
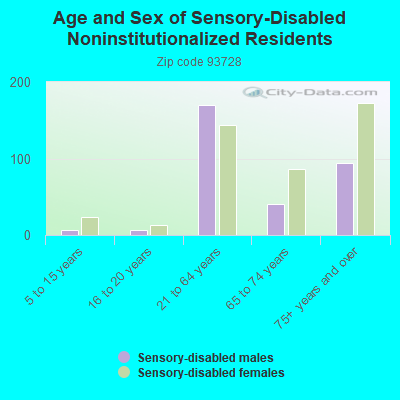
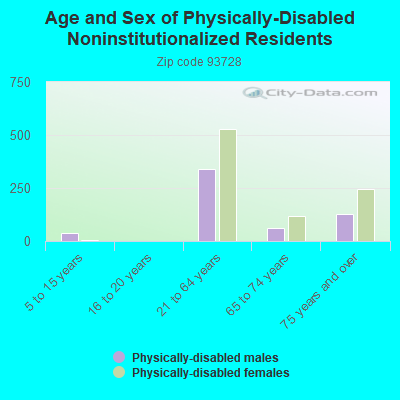
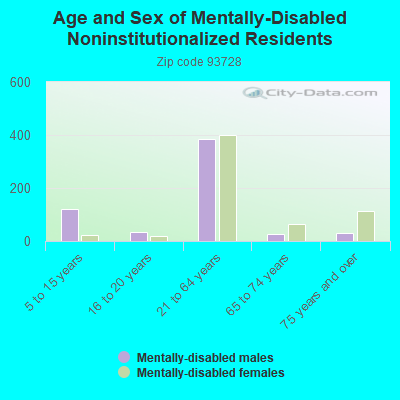
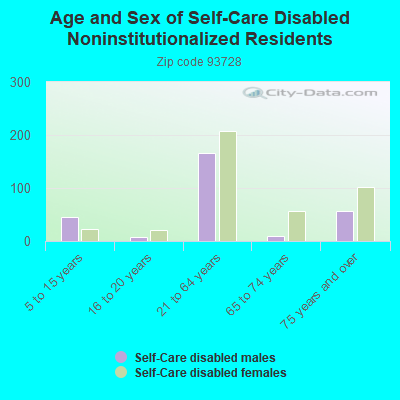
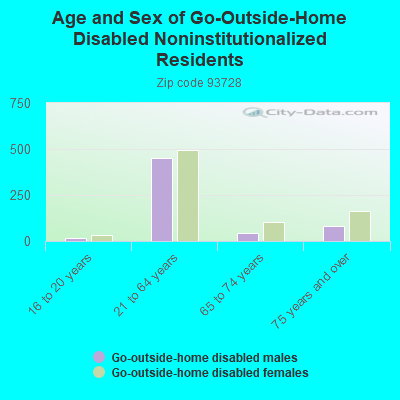
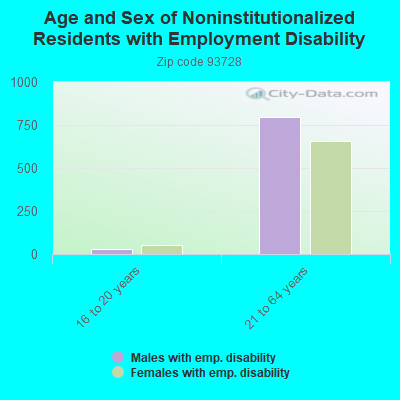
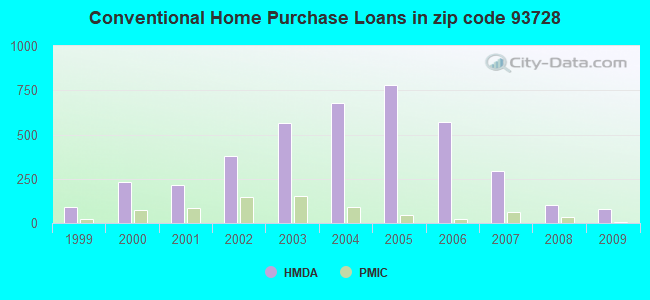
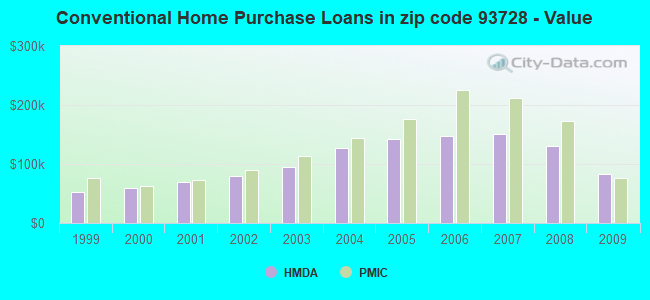
 Based on the data from the years 2004 - 2018 the average number of fires per year is 59. The highest number of fire incidents - 165 took place in 2016, and the least - 0 in 2005. The data has a rising trend.
 When looking into fire subcategories, the most reports belonged to: Outside Fires (49.7%), and Structure Fires (34.4%).