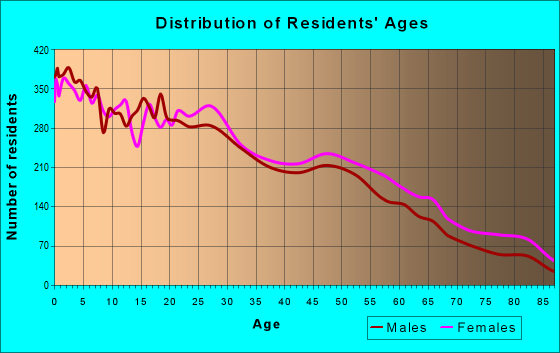
Estimated zip code population in 2022: 38,455 Zip code population in 2010: 36,703 Zip code population in 2000: 35,443
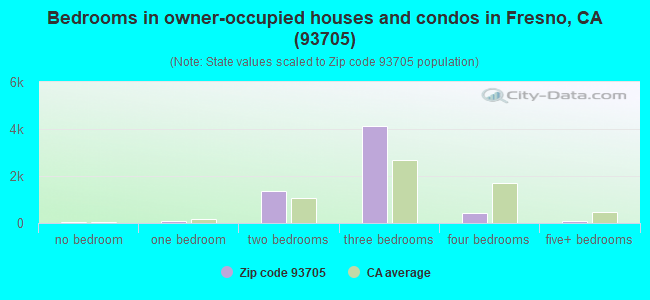
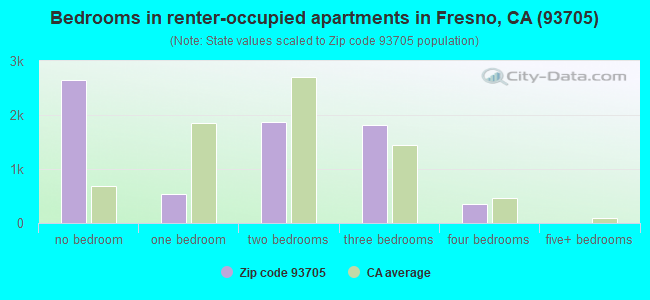
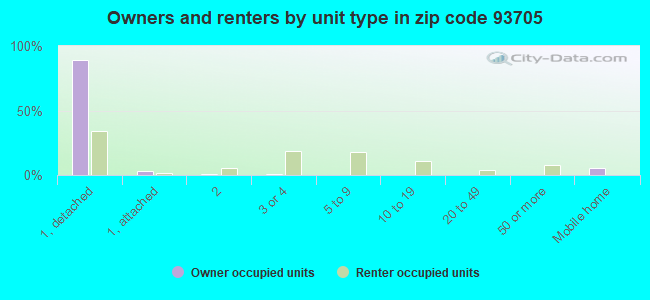
Houses and condos: 13,810 Renter-occupied apartments: 7,084
% of renters here:
53%
State:
44%
March 2022 cost of living index in zip code 93705: 95.8 (near average, U.S. average is 100)
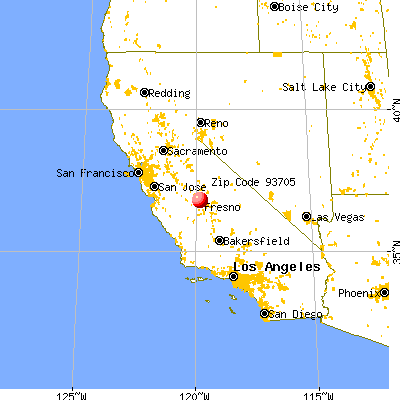
Land area: 4.9 sq. mi. Water area: 0.0 sq. mi.
Population density: 7,887 people per square mile
(high).
OSM Map
General Map
Google Map
MSN Map
OSM Map
General Map
Google Map
MSN Map
OSM Map
General Map
Google Map
MSN Map
OSM Map
General Map
Google Map
MSN Map
Please wait while loading the map...
Real estate property taxes paid for housing units in 2022:
This zip code:
0.6% ($1,612)
California:
0.7% ($4,831)
Median real estate property taxes paid for housing units with mortgages in 2022: $1,848 (0.6%) Median real estate property taxes paid for housing units with no mortgage in 2022: $1,302 (0.5%)
Averages for the 2020 tax year for zip code 93705, filed in 2021:
Average Adjusted Gross Income (AGI) in 2020: $37,647 (Individual Income Tax Returns)
Here:
$37,647
State:
$95,910
Salary/wage: $34,642 (reported on 83.0% of returns)
Here:
$34,642
State:
$77,331
(% of AGI for various income ranges: 1202.3% for AGIs below $25k, 3821.3% for AGIs $25k-50k, 7198.2% for AGIs $50k-75k, 10751.7% for AGIs $75k-100k, 17425.9% for AGIs $100k-200k)
Taxable interest for individuals: $371 (reported on 19.3% of returns)
This zip code:
$371
California:
$2,294
(% of AGI for various income ranges: 4.2% for AGIs below $25k, 5.4% for AGIs $25k-50k, 15.5% for AGIs $50k-75k, 22.7% for AGIs $75k-100k, 82.8% for AGIs $100k-200k)
Ordinary dividends: $2,866 (reported on 4.9% of returns)
Here:
$2,866
State:
$10,949
(% of AGI for various income ranges: 6.6% for AGIs below $25k, 7.5% for AGIs $25k-50k, 37.1% for AGIs $50k-75k, 63.6% for AGIs $75k-100k, 146.2% for AGIs $100k-200k)
Net capital gain/loss in AGI: +$5,956 (reported on 4.9% of returns)
Here:
+$5,956
State:
+$49,306
(% of AGI for various income ranges: 1.1% for AGIs below $25k, 3.5% for AGIs $25k-50k, 24.0% for AGIs $50k-75k, 57.3% for AGIs $75k-100k, 411.5% for AGIs $100k-200k)
Profit/loss from business: +$7,595 (reported on 13.8% of returns)
Here:
+$7,595
State:
+$15,671
(% of AGI for various income ranges: 147.7% for AGIs below $25k, 111.0% for AGIs $25k-50k, 145.4% for AGIs $50k-75k, 208.6% for AGIs $75k-100k, 416.2% for AGIs $100k-200k)
Taxable individual retirement arrangement distribution: $11,079 (reported on 3.0% of returns)
93705:
$11,079
California:
$23,505
(% of AGI for various income ranges: 17.5% for AGIs below $25k, 25.6% for AGIs $25k-50k, 97.3% for AGIs $50k-75k, 139.3% for AGIs $75k-100k, 308.2% for AGIs $100k-200k)
Total itemized deductions: $25,195 (reported on 4.1% of returns)
Here:
$25,195
State:
$39,517
(% of AGI for various income ranges: 22.1% for AGIs below $25k, 62.3% for AGIs $25k-50k, 287.6% for AGIs $50k-75k, 452.0% for AGIs $75k-100k, 1124.4% for AGIs $100k-200k)
Charity contributions: $5,195 (reported on 2.7% of returns)
Here:
$5,195
State:
$12,598
(% of AGI for various income ranges: 1.0% for AGIs below $25k, 5.3% for AGIs $25k-50k, 35.8% for AGIs $50k-75k, 62.2% for AGIs $75k-100k, 209.0% for AGIs $100k-200k)
Taxes paid: $6,319 (reported on 4.0% of returns)
93705:
$6,319
State:
$8,807
(% of AGI for various income ranges: 4.5% for AGIs below $25k, 12.5% for AGIs $25k-50k, 69.0% for AGIs $50k-75k, 145.9% for AGIs $75k-100k, 312.1% for AGIs $100k-200k)
Earned income credit: $2,574 (reported on 31.1% of returns)
Here:
$2,574
State:
$2,074
(% of AGI for various income ranges: 158.2% for AGIs below $25k, 121.9% for AGIs $25k-50k, 2.2% for AGIs $50k-75k)
Percentage of individuals using paid preparers for their 2020 taxes: 92.0%
Here:
92%
State:
92%
(% for various income ranges: 90.9% for AGIs below $25k, 93.0% for AGIs $25k-50k, 92.9% for AGIs $50k-75k, 91.5% for AGIs $75k-100k, 93.1% for AGIs $100k-200k, 85.7% for AGIs over 200k)
Averages for the 2012 tax year for zip code 93705, filed in 2013:
Average Adjusted Gross Income (AGI) in 2012: $30,304 (Individual Income Tax Returns)
Here:
$30,304
State:
$72,726
Salary/wage: $27,272 (reported on 83.7% of returns)
Here:
$27,272
State:
$59,079
(% of AGI for various income ranges: 75.8% for AGIs below $25k, 81.8% for AGIs $25k-50k, 74.9% for AGIs $50k-75k, 73.2% for AGIs $75k-100k, 64.5% for AGIs $100k-200k, 42.1% for AGIs over 200k)
Taxable interest for individuals: $568 (reported on 20.7% of returns)
This zip code:
$568
California:
$2,146
(% of AGI for various income ranges: 0.3% for AGIs below $25k, 0.3% for AGIs $25k-50k, 0.5% for AGIs $50k-75k, 0.3% for AGIs $75k-100k, 0.8% for AGIs $100k-200k, 0.2% for AGIs over 200k)
Ordinary dividends: $3,120 (reported on 7.0% of returns)
Here:
$3,120
State:
$9,308
(% of AGI for various income ranges: 0.5% for AGIs below $25k, 0.4% for AGIs $25k-50k, 0.8% for AGIs $50k-75k, 1.4% for AGIs $75k-100k, 1.4% for AGIs $100k-200k)
Net capital gain/loss in AGI: +$541 (reported on 5.2% of returns)
Here:
+$541
State:
+$30,460
(% of AGI for various income ranges: 0.1% for AGIs $25k-50k, 0.4% for AGIs $75k-100k, 0.6% for AGIs $100k-200k)
Profit/loss from business: +$9,082 (reported on 14.7% of returns)
Here:
+$9,082
State:
+$17,064
(% of AGI for various income ranges: 10.7% for AGIs below $25k, 2.8% for AGIs $25k-50k, 1.9% for AGIs $50k-75k, 1.9% for AGIs $75k-100k, 2.9% for AGIs $100k-200k)
Taxable individual retirement arrangement distribution: $9,655 (reported on 5.2% of returns)
93705:
$9,655
California:
$19,557
(% of AGI for various income ranges: 1.2% for AGIs below $25k, 1.3% for AGIs $25k-50k, 1.8% for AGIs $50k-75k, 2.1% for AGIs $75k-100k, 3.5% for AGIs $100k-200k)
Total itemized deductions: $17,055 (28% of AGI, reported on 16.6% of returns)
Here:
$17,055
State:
$34,004
Here:
27.6% of AGI
State:
22.7% of AGI
(% of AGI for various income ranges: 4.3% for AGIs below $25k, 7.6% for AGIs $25k-50k, 11.9% for AGIs $50k-75k, 13.7% for AGIs $75k-100k, 15.3% for AGIs $100k-200k, 16.3% for AGIs over 200k)
Charity contributions: $2,626 (reported on 12.9% of returns)
Here:
$2,626
State:
$4,659
(% of AGI for various income ranges: 0.3% for AGIs below $25k, 0.8% for AGIs $25k-50k, 1.3% for AGIs $50k-75k, 1.8% for AGIs $75k-100k, 2.6% for AGIs $100k-200k, 2.6% for AGIs over 200k)
Taxes paid: $4,322 (reported on 16.5% of returns)
93705:
$4,322
State:
$14,448
(% of AGI for various income ranges: 0.7% for AGIs below $25k, 1.4% for AGIs $25k-50k, 2.9% for AGIs $50k-75k, 4.0% for AGIs $75k-100k, 5.0% for AGIs $100k-200k, 9.5% for AGIs over 200k)
Earned income credit: $2,761 (reported on 39.7% of returns)
Here:
$2,761
State:
$2,286
(% of AGI for various income ranges: 12.2% for AGIs below $25k, 2.0% for AGIs $25k-50k)
Percentage of individuals using paid preparers for their 2012 taxes: 54.8%
Here:
55%
State:
64%
(% for various income ranges: 53.6% for AGIs below $25k, 52.9% for AGIs $25k-50k, 59.7% for AGIs $50k-75k, 62.0% for AGIs $75k-100k, 67.6% for AGIs $100k-200k, 100.0% for AGIs over 200k)
Averages for the 2004 tax year for zip code 93705, filed in 2005:
Average Adjusted Gross Income (AGI) in 2004: $28,940 (Individual Income Tax Returns)
Here:
$28,940
State:
$58,600
Salary/wage: $26,581 (reported on 85.4% of returns)
Here:
$26,581
State:
$49,455
(% of AGI for various income ranges: 88.6% for AGIs below $10k, 81.2% for AGIs $10k-25k, 83.7% for AGIs $25k-50k, 77.6% for AGIs $50k-75k, 72.7% for AGIs $75k-100k, 58.1% for AGIs over 100k)
Taxable interest for individuals: $1,035 (reported on 31.0% of returns)
This zip code:
$1,035
California:
$2,365
(% of AGI for various income ranges: 2.1% for AGIs below $10k, 1.1% for AGIs $10k-25k, 0.9% for AGIs $25k-50k, 1.1% for AGIs $50k-75k, 1.3% for AGIs $75k-100k, 1.3% for AGIs over 100k)
Taxable dividends: $2,554 (reported on 10.8% of returns)
Here:
$2,554
State:
$4,746
(% of AGI for various income ranges: 1.6% for AGIs below $10k, 0.8% for AGIs $10k-25k, 0.6% for AGIs $25k-50k, 0.9% for AGIs $50k-75k, 1.4% for AGIs $75k-100k, 2.2% for AGIs over 100k)
Net capital gain/loss: +$7,318 (reported on 9.1% of returns)
Here:
+$7,318
State:
+$23,418
(% of AGI for various income ranges: -0.9% for AGIs below $10k, 0.0% for AGIs $10k-25k, 0.6% for AGIs $25k-50k, 0.7% for AGIs $50k-75k, 3.8% for AGIs $75k-100k, 16.2% for AGIs over 100k)
Profit/loss from business: +$8,980 (reported on 11.9% of returns)
Here:
+$8,980
State:
+$16,826
(% of AGI for various income ranges: 6.5% for AGIs below $10k, 5.2% for AGIs $10k-25k, 2.8% for AGIs $25k-50k, 2.4% for AGIs $50k-75k, 3.8% for AGIs $75k-100k, 5.2% for AGIs over 100k)
IRA payment deduction: $2,347 (reported on 1.5% of returns)
93705:
$2,347
California:
$3,192
(% of AGI for various income ranges: 0.1% for AGIs $10k-25k, 0.2% for AGIs $25k-50k, 0.1% for AGIs $50k-75k, 0.1% for AGIs $75k-100k, 0.1% for AGIs over 100k)
Self-employed pension: $11,147 (reported on 0.3% of returns)
Here:
$11,147
California:
$17,688
Total itemized deductions: $15,302 (28% of AGI, reported on 21.7% of returns)
Here:
$15,302
State:
$28,113
Here:
27.9% of AGI
State:
25.3% of AGI
(% of AGI for various income ranges: 6.3% for AGIs below $10k, 5.8% for AGIs $10k-25k, 11.7% for AGIs $25k-50k, 14.0% for AGIs $50k-75k, 15.3% for AGIs $75k-100k, 15.0% for AGIs over 100k)
Charity contributions deductions: $2,194 (4% of AGI, reported on 18.5% of returns)
Here:
$2,194
State:
$3,923
Here:
3.8% of AGI
State:
3.3% of AGI
(% of AGI for various income ranges: 0.4% for AGIs below $10k, 0.5% for AGIs $10k-25k, 1.1% for AGIs $25k-50k, 1.7% for AGIs $50k-75k, 2.4% for AGIs $75k-100k, 3.0% for AGIs over 100k)
Total tax: $3,410 (reported on 61.5% of returns)
93705:
$3,410
State:
$10,761
(% of AGI for various income ranges: 2.2% for AGIs below $10k, 3.1% for AGIs $10k-25k, 5.8% for AGIs $25k-50k, 8.9% for AGIs $50k-75k, 11.1% for AGIs $75k-100k, 15.2% for AGIs over 100k)
Earned income credit: $2,014 (reported on 33.8% of returns)
Here:
$2,014
State:
$1,763
Percentage of individuals using paid preparers for their 2004 taxes: 62.1%
Here:
62%
State:
66%
(% for various income ranges: 55.8% for AGIs below $10k, 62.4% for AGIs $10k-25k, 64.0% for AGIs $25k-50k, 64.3% for AGIs $50k-75k, 68.5% for AGIs $75k-100k, 75.1% for AGIs over 100k)
Likely homosexual households (counted as self-reported same-sex unmarried-partner households)
Lesbian couples: 0.2% of all households
Gay men: 0.3% of all households
Household received Food Stamps/SNAP in the past 12 months: 4,921 Household did not receive Food Stamps/SNAP in the past 12 months: 9,023
Women who had a birth in the past 12 months: 663 (349 now married, 316 unmarried) Women who did not have a birth in the past 12 months: 8,195 (2,368 now married, 5,863 unmarried)
Housing units in zip code 93705 with a mortgage: 3,862 (210 second mortgage, 28 home equity loan, 91 both second mortgage and home equity loan) Houses without a mortgage: 46
Median monthly owner costs for units with a mortgage: $1,441 Median monthly owner costs for units without a mortgage: $490
Residents with income below the poverty level in 2022:
This zip code:
26.4%
Whole state:
12.2%
Residents with income below 50% of the poverty level in 2022:
This zip code:
14.5%
Whole state:
6.2%
Median number of rooms in houses and condos:
Here:
5.5
State:
6.0
Median number of rooms in apartments:
Here:
3.6
State:
3.9
Notable locations in this zip code not listed on our city pages
Notable locations in zip code 93705: Ashlan Substation (A), Fresno City Fire Department Station 12 (B), Fresno City Fire Department Station 9 (C). Display/hide their locations on the map
Churches in zip code 93705 include: Calvary Presbyterian Church (A), Cornelia Southern Baptist Church (B), First Church of Religious Science (C), Fresno Christian Reformed Church (D), Grace Church of the Nazarene (E), Johrei Center World Messianity Church (F), North Fresno Assembly of God Church (G), Our Lady of Victory Parish Center (H), Our Lady of Victory Roman Catholic Church (I). Display/hide their locations on the map
4,112 married couples with children.
5,362 single-parent households (1,101 men, 4,261 women).
59.3% of residents of 93705 zip code speak English at home.
34.4% of residents speak Spanish at home (68% very well, 14% well, 12% not well, 6% not at all).
1.9% of residents speak other Indo-European language at home (81% very well, 17% well, 2% not well).
3.8% of residents speak Asian or Pacific Island language at home (47% very well, 24% well, 18% not well, 10% not at all).
0.4% of residents speak other language at home (93% very well, 7% not well).
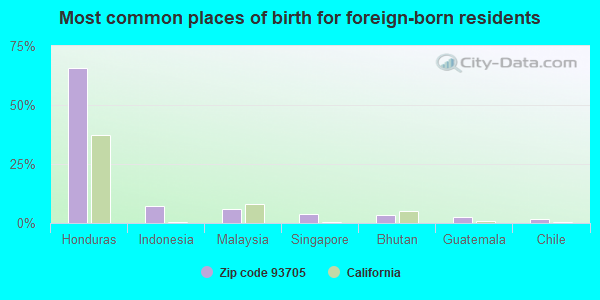
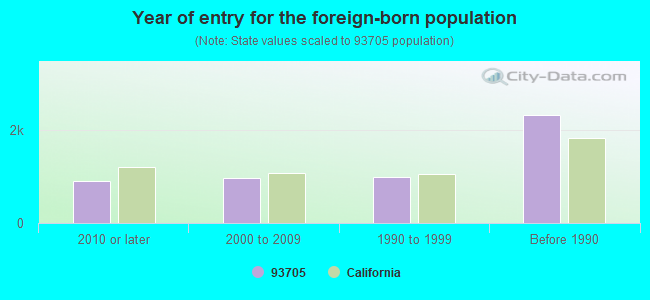
Foreign born population: 4,741 (12.3%) (53.3% of them are naturalized citizens)
Major facilities with environmental interests located in this zip code:
NEW AGE METAL FINISHING (2169 NORTH PLEASANT AVENUE in FRESNO, CA)
STATE MASTER (California - Hazardous Waste Tracking) - HAZARDOU WASTE PROGRAM National Pollutant Discharge Elimination System NON-MAJOR (Tracking pollutant discharge elimination systems) - permit HAZARDOUS WASTE BIENNIAL REPORTER (Resource Conservation and Recovery Act (tracking hazardous waste)) - ICIS-, ENFORCEMENT/COMPLIANCE ACTIVITY Large Quantity Generators, more that 1000 kg of hazardous waste/month (Resource Conservation and Recovery Act (tracking hazardous waste)) - notification - ICIS-, ENFORCEMENT/COMPLIANCE ACTIVITY Business NAICS classification: ELECTROPLATING, PLATING, POLISHING, ANODIZING, AND COLORING. Organizations: NEW AGE METAL FINISHING, LLC (CONTACT/OPERATOR)
Alternative names: NEWAGE METAL FINISH
FREMONT ELEMENTARY (1005 W. WELDON in FRESNO, CA)
AIR MONITORING SITE (Airborne pollution emission tracking) (National Center for Education Statistics) - STATE ID-6006258 Small Quantity Generators, between 100 kg and 1000 kg of hazardous waste/month (Resource Conservation and Recovery Act (tracking hazardous waste)) - notification Organizations: FRESNO UNIF SCHOOL DIST (CONTACT/OWNER)
, FRESNO UNIFIED (SCHOOL DISTRICT)
Alternative names: FRESNO USD FREMONT ELEM
HOMAN ELEMENTARY (1602 W. HARVARD ST. in FRESNO, CA)
(National Center for Education Statistics) - STATE ID-6006290 Small Quantity Generators, between 100 kg and 1000 kg of hazardous waste/month (Resource Conservation and Recovery Act (tracking hazardous waste)) - notification Organizations: FRESNO UNIF SCHOOL DIST (CONTACT/OWNER)
, FRESNO UNIFIED (SCHOOL DISTRICT)
Alternative names: FRESNO USD HOMAN ELEM
LAMOURES INC (3805 N WEST in FRESNO, CA)
STATE MASTER (California - Hazardous Waste Tracking) - HAZARDOU WASTE PROGRAM CRITERIA AND HAZARDOUS AIR POLLUTANT INVENTORY (Inventory of air pollution sources) Small Quantity Generators, between 100 kg and 1000 kg of hazardous waste/month (Resource Conservation and Recovery Act (tracking hazardous waste)) - notification Business SIC classification: DRYCLEANING PLANTS, EXCEPT RUG CLEANING Organizations: JEAN B LAMOURE (CONTACT/OWNER)
Alternative names: LAMOURE'S CLEANERS
NEW HORIZON HIGH SCHOOL (3335 N. AUTHUR in FRESNO, CA)
(National Center for Education Statistics) - STATE ID-1030188 Organizations: FRESNO UNIFIED (SCHOOL DISTRICT)
LAMOURES (2225 W SHAW in FRESNO, CA)
(Resource Conservation and Recovery Act (tracking hazardous waste)) Organizations: JEAN B LAMOURE (CONTACT/OWNER)
FRESNO USD DAILEY ELEM (3135 N HARRISON in FRESNO, CA)
Small Quantity Generators, between 100 kg and 1000 kg of hazardous waste/month (Resource Conservation and Recovery Act (tracking hazardous waste)) - notification Organizations: FRESNO UNIF SCHOOL DIST (CONTACT/OWNER)
FRESNO USD EWING ELEM (6235 N BRAWLEY in FRESNO, CA)
Small Quantity Generators, between 100 kg and 1000 kg of hazardous waste/month (Resource Conservation and Recovery Act (tracking hazardous waste)) - notification Organizations: FRESNO UNIF SCHOOL DIST (CONTACT/OWNER)
HAEHL EQUIPMENT INC (1903 N MOTEL DRIVE in FRESNO, CA)
Small Quantity Generators, between 100 kg and 1000 kg of hazardous waste/month (Resource Conservation and Recovery Act (tracking hazardous waste)) - notification Organizations: GARCIA MITCHELL (CONTACT/OWNER)
JIM T WHITE TRUCKING (2248 W PRINCETON in FRESNO, CA)
TRANSPORTER (Resource Conservation and Recovery Act (tracking hazardous waste))
LAMOURES (2824 W ASHLAN in FRESNO, CA)
Small Quantity Generators, between 100 kg and 1000 kg of hazardous waste/month (Resource Conservation and Recovery Act (tracking hazardous waste)) - notification Organizations: JEAN B LAMOURE (CONTACT/OWNER)
FRESNO USD COOPER MS (2277 E. BELLAIRE WAY in FRESNO, CA)
Small Quantity Generators, between 100 kg and 1000 kg of hazardous waste/month (Resource Conservation and Recovery Act (tracking hazardous waste))
FRESNO USD GINBURG ELEMENTARY SCH (67 E ASHLAN in FRESNO, CA)
Small Quantity Generators, between 100 kg and 1000 kg of hazardous waste/month (Resource Conservation and Recovery Act (tracking hazardous waste))
Housing units lacking complete plumbing facilities: 0.7% Housing units lacking complete kitchen facilities: 1.3%
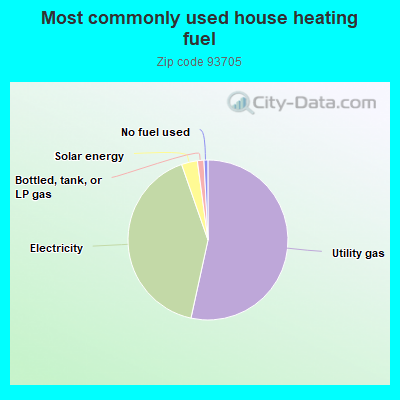
53.0%Utility gas
40.9%Electricity
3.2%Solar energy
1.3%Bottled, tank, or LP gas
0.8%No fuel used
Population in 1990: 34,114. Population change in the 1990s: +1,329 (+3.9%).
Place of birth for U.S.-born residents:
This state: 30,600
Northeast: 343
Midwest: 333
South: 1,427
West: 618
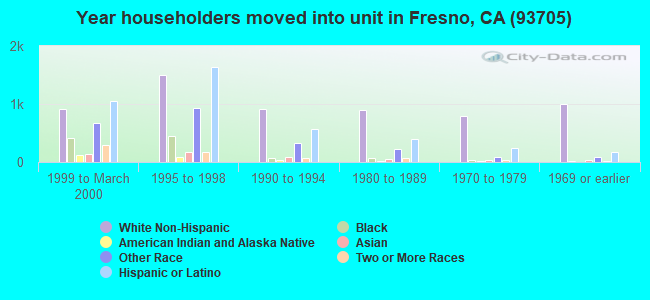
51% of the 93705 zip code residents lived in the same house 5 years ago. Out of people who lived in different houses, 82% lived in this county. Out of people who lived in different counties, 50% lived in California.
91% of the 93705 zip code residents lived in the same house 1 year ago. Out of people who lived in different houses, 65% moved from this county. Out of people who lived in different houses, 28% moved from different county within same state. Out of people who lived in different houses, 4% moved from different state. Out of people who lived in different houses, 2% moved from abroad.
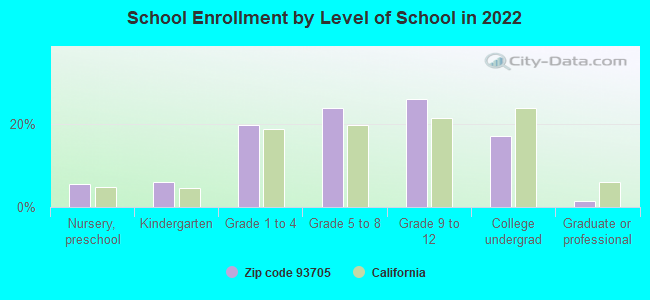
Private vs. public school enrollment:
Students in private schools in grades 1 to 8 (elementary and middle school): 262
Here:
5.8%
California:
10.5%
Students in private schools in grades 9 to 12 (high school): 55
Here:
2.1%
California:
8.5%
Students in private undergraduate colleges: 88
Here:
5.1%
California:
15.9%
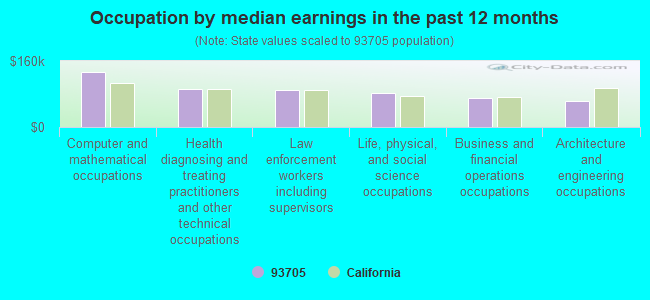
Occupation by median earnings in the past 12 months ($)
134,417Computer and mathematical occupations
91,798Health diagnosing and treating practitioners and other technical occupations
90,218Law enforcement workers including supervisors
82,709Life, physical, and social science occupations
69,191Business and financial operations occupations
62,212Architecture and engineering occupations
Companies with federal contracts located in this zip code:
EXPLORE GENERAL,INC (4321 N WEST AVENUE in FRESNO, CA; small business) : $26,004,232 in 151 contractsfrom 2000 to 2006
Contracts for Construction of Structures and Facilities -- Other Industrial Buildings, Maintenance, Repair or Alteration of Real Property -- Hospitals and Infirmaries, Facilities Operations Support Services, Construction of Structures and Facilities -- Water Supply Facilities, and moreby Navy, Department of Veterans Affairs, Public Buildings Service, National Park Service, and others Signed by year:2000: $1,493,166; 2001: $2,645,042; 2002: $4,862,648; 2003: $7,965,517; 2004: $5,707,225; 2005: $2,210,081; 2006: $1,120,553.
Biggest contracts:
$2,410,944 with Navy for Construction of Structures and Facilities -- Other Industrial Buildings. Signed on 2002-12-04. Completion date: 2003-07-08.
$1,578,855, same as above.Signed on 2003-09-26. Completion date: 2004-06-23.
$1,520,000 with Department of Veterans Affairs for Maintenance, Repair or Alteration of Real Property -- Hospitals and Infirmaries. Signed on 2002-04-15. Completion date: 2002-09-15.
$1,175,706 with Public Buildings Service for Facilities Operations Support Services. Signed on 2003-01-15. Completion date: 2006-01-15.
AUTOMATED ACCESS (2660 WEST ANDREWS AVE in FRESNO, CA; small business) : $16,230 in 2 contractsin 2002
$8,115 with U.S. Army Corps of Engineers - civil program financing only for Maintenance, Repair or Alteration of Real Property -- Recreation Facilities (Non-Building). Signed on 2002-09-27. Completion date: 2002-10-18.
$8,115 with U.S. Army Corps of Engineers - civil program financing only for Construction of Structures and Facilities -- Other Non-Building Facilities. Signed on 2002-09-27. Completion date: 2002-10-18.
ADAMS, SHERRY L (1458 W NORWICH AVE #1 in FRESNO, CA; small business)
$6,000 with Navy for Chaplain Services. Signed on 2004-09-28. Completion date: 2005-09-30.
Top industries in this zip code by the number of employees in 2005:
2004 - 2018 National Fire Incident Reporting System (NFIRS) incidents
According to the data from the years 2004 - 2018 the average number of fire incidents per year is 83. The highest number of fires - 244 took place in 2004, and the least - 0 in 2005. The data has a declining trend.
When looking into fire subcategories, the most reports belonged to: Outside Fires (41.3%), and Structure Fires (39.8%).
Fire incident types reported to NFIRS in Zip Code 93705


 Nearest zip codes: 93704, 93728, 93711, 93722, 93701, 93650.


 According to the data from the years 2004 - 2018 the average number of fire incidents per year is 83. The highest number of fires - 244 took place in 2004, and the least - 0 in 2005. The data has a declining trend.
 When looking into fire subcategories, the most reports belonged to: Outside Fires (41.3%), and Structure Fires (39.8%).