Estimated zip code population in 2022: 85,669 Zip code population in 2010: 76,448 Zip code population in 2000: 60,879
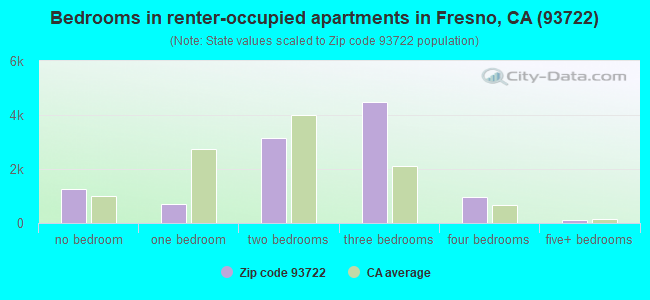
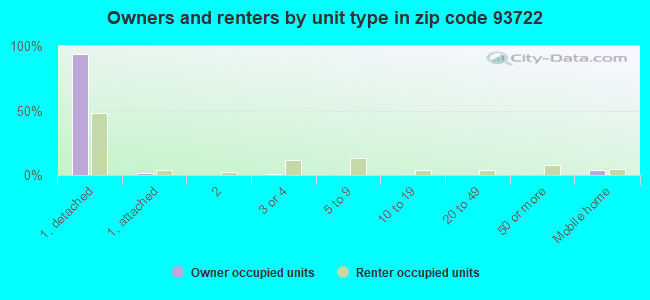
Houses and condos: 28,153 Renter-occupied apartments: 10,628
% of renters here:
39%
State:
44%
March 2022 cost of living index in zip code 93722: 95.7 (near average, U.S. average is 100)
Land area: 19.6 sq. mi. Water area: 0.1 sq. mi.
Population density: 4,373 people per square mile
(average).
OSM Map
General Map
Google Map
MSN Map
OSM Map
General Map
Google Map
MSN Map
OSM Map
General Map
Google Map
MSN Map
OSM Map
General Map
Google Map
MSN Map
Please wait while loading the map...
Real estate property taxes paid for housing units in 2022:
This zip code:
0.8% ($2,632)
California:
0.7% ($4,831)
Median real estate property taxes paid for housing units with mortgages in 2022: $2,745 (0.8%) Median real estate property taxes paid for housing units with no mortgage in 2022: $2,230 (0.7%)
Averages for the 2020 tax year for zip code 93722, filed in 2021:
Average Adjusted Gross Income (AGI) in 2020: $51,287 (Individual Income Tax Returns)
Here:
$51,287
State:
$95,910
Salary/wage: $45,509 (reported on 83.2% of returns)
Here:
$45,509
State:
$77,331
(% of AGI for various income ranges: 1277.9% for AGIs below $25k, 3967.2% for AGIs $25k-50k, 7457.3% for AGIs $50k-75k, 10963.9% for AGIs $75k-100k, 20834.6% for AGIs $100k-200k, 74217.3% for AGIs over 200k)
Taxable interest for individuals: $1,057 (reported on 26.5% of returns)
This zip code:
$1,057
California:
$2,294
(% of AGI for various income ranges: 5.3% for AGIs below $25k, 8.0% for AGIs $25k-50k, 18.9% for AGIs $50k-75k, 29.8% for AGIs $75k-100k, 68.7% for AGIs $100k-200k, 4794.0% for AGIs over 200k)
Ordinary dividends: $3,358 (reported on 6.4% of returns)
Here:
$3,358
State:
$10,949
(% of AGI for various income ranges: 5.6% for AGIs below $25k, 7.5% for AGIs $25k-50k, 22.1% for AGIs $50k-75k, 39.0% for AGIs $75k-100k, 93.3% for AGIs $100k-200k, 2536.7% for AGIs over 200k)
Net capital gain/loss in AGI: +$12,004 (reported on 7.2% of returns)
Here:
+$12,004
State:
+$49,306
(% of AGI for various income ranges: 3.0% for AGIs below $25k, 8.5% for AGIs $25k-50k, 34.6% for AGIs $50k-75k, 72.1% for AGIs $75k-100k, 420.4% for AGIs $100k-200k, 14769.3% for AGIs over 200k)
Profit/loss from business: +$13,182 (reported on 18.7% of returns)
Here:
+$13,182
State:
+$15,671
(% of AGI for various income ranges: 215.7% for AGIs below $25k, 465.9% for AGIs $25k-50k, 403.8% for AGIs $50k-75k, 321.8% for AGIs $75k-100k, 515.3% for AGIs $100k-200k, 3463.3% for AGIs over 200k)
Taxable individual retirement arrangement distribution: $13,784 (reported on 3.3% of returns)
93722:
$13,784
California:
$23,505
(% of AGI for various income ranges: 19.9% for AGIs below $25k, 26.8% for AGIs $25k-50k, 72.5% for AGIs $50k-75k, 116.8% for AGIs $75k-100k, 333.6% for AGIs $100k-200k, 1349.3% for AGIs over 200k)
Self-employed (Keogh) retirement plans: $20,360 (reported on 0.1% of returns)
93722:
$20,360
California:
$30,163
(% of AGI for various income ranges: 53.6% for AGIs $100k-200k)
Total itemized deductions: $29,970 (reported on 7.4% of returns)
Here:
$29,970
State:
$39,517
(% of AGI for various income ranges: 24.7% for AGIs below $25k, 98.8% for AGIs $25k-50k, 373.3% for AGIs $50k-75k, 701.2% for AGIs $75k-100k, 1379.7% for AGIs $100k-200k, 13496.7% for AGIs over 200k)
Charity contributions: $6,945 (reported on 5.6% of returns)
Here:
$6,945
State:
$12,598
(% of AGI for various income ranges: 1.7% for AGIs below $25k, 12.5% for AGIs $25k-50k, 40.3% for AGIs $50k-75k, 102.0% for AGIs $75k-100k, 309.4% for AGIs $100k-200k, 2906.7% for AGIs over 200k)
Taxes paid: $7,351 (reported on 7.3% of returns)
93722:
$7,351
State:
$8,807
(% of AGI for various income ranges: 4.6% for AGIs below $25k, 20.3% for AGIs $25k-50k, 100.8% for AGIs $50k-75k, 221.1% for AGIs $75k-100k, 408.9% for AGIs $100k-200k, 1710.7% for AGIs over 200k)
Earned income credit: $2,361 (reported on 23.1% of returns)
Here:
$2,361
State:
$2,074
(% of AGI for various income ranges: 128.3% for AGIs below $25k, 110.7% for AGIs $25k-50k, 2.0% for AGIs $50k-75k)
Percentage of individuals using paid preparers for their 2020 taxes: 92.4%
Here:
92%
State:
92%
(% for various income ranges: 91.7% for AGIs below $25k, 93.1% for AGIs $25k-50k, 92.4% for AGIs $50k-75k, 92.0% for AGIs $75k-100k, 92.6% for AGIs $100k-200k, 94.8% for AGIs over 200k)
Averages for the 2012 tax year for zip code 93722, filed in 2013:
Average Adjusted Gross Income (AGI) in 2012: $43,499 (Individual Income Tax Returns)
Here:
$43,499
State:
$72,726
Salary/wage: $39,543 (reported on 86.7% of returns)
Here:
$39,543
State:
$59,079
(% of AGI for various income ranges: 74.5% for AGIs below $25k, 83.0% for AGIs $25k-50k, 84.2% for AGIs $50k-75k, 83.5% for AGIs $75k-100k, 82.4% for AGIs $100k-200k, 42.4% for AGIs over 200k)
Taxable interest for individuals: $647 (reported on 28.3% of returns)
This zip code:
$647
California:
$2,146
(% of AGI for various income ranges: 0.4% for AGIs below $25k, 0.2% for AGIs $25k-50k, 0.3% for AGIs $50k-75k, 0.3% for AGIs $75k-100k, 0.4% for AGIs $100k-200k, 1.8% for AGIs over 200k)
Ordinary dividends: $2,536 (reported on 7.1% of returns)
Here:
$2,536
State:
$9,308
(% of AGI for various income ranges: 0.4% for AGIs below $25k, 0.3% for AGIs $25k-50k, 0.3% for AGIs $50k-75k, 0.3% for AGIs $75k-100k, 0.4% for AGIs $100k-200k, 1.3% for AGIs over 200k)
Net capital gain/loss in AGI: +$6,046 (reported on 5.8% of returns)
Here:
+$6,046
State:
+$30,460
(% of AGI for various income ranges: 0.1% for AGIs $50k-75k, 0.2% for AGIs $75k-100k, 0.7% for AGIs $100k-200k, 7.4% for AGIs over 200k)
Profit/loss from business: +$12,259 (reported on 16.4% of returns)
Here:
+$12,259
State:
+$17,064
(% of AGI for various income ranges: 13.8% for AGIs below $25k, 5.6% for AGIs $25k-50k, 2.8% for AGIs $50k-75k, 2.2% for AGIs $75k-100k, 2.5% for AGIs $100k-200k, 2.1% for AGIs over 200k)
Taxable individual retirement arrangement distribution: $12,219 (reported on 4.3% of returns)
93722:
$12,219
California:
$19,557
(% of AGI for various income ranges: 1.0% for AGIs below $25k, 1.0% for AGIs $25k-50k, 1.0% for AGIs $50k-75k, 1.6% for AGIs $75k-100k, 1.4% for AGIs $100k-200k, 1.5% for AGIs over 200k)
Self-employment retirement plans: $14,517 (reported on 0.2% of returns)
93722:
$14,517
California:
$24,530
Total itemized deductions: $21,058 (26% of AGI, reported on 29.2% of returns)
Here:
$21,058
State:
$34,004
Here:
25.5% of AGI
State:
22.7% of AGI
(% of AGI for various income ranges: 5.7% for AGIs below $25k, 10.7% for AGIs $25k-50k, 15.4% for AGIs $50k-75k, 16.9% for AGIs $75k-100k, 18.2% for AGIs $100k-200k, 17.9% for AGIs over 200k)
Charity contributions: $2,735 (reported on 23.2% of returns)
Here:
$2,735
State:
$4,659
(% of AGI for various income ranges: 0.4% for AGIs below $25k, 0.9% for AGIs $25k-50k, 1.5% for AGIs $50k-75k, 1.8% for AGIs $75k-100k, 2.1% for AGIs $100k-200k, 2.3% for AGIs over 200k)
Taxes paid: $6,427 (reported on 29.1% of returns)
93722:
$6,427
State:
$14,448
(% of AGI for various income ranges: 1.1% for AGIs below $25k, 2.2% for AGIs $25k-50k, 3.9% for AGIs $50k-75k, 4.9% for AGIs $75k-100k, 6.5% for AGIs $100k-200k, 9.0% for AGIs over 200k)
Earned income credit: $2,544 (reported on 31.5% of returns)
Here:
$2,544
State:
$2,286
(% of AGI for various income ranges: 10.8% for AGIs below $25k, 2.0% for AGIs $25k-50k)
Percentage of individuals using paid preparers for their 2012 taxes: 55.2%
Here:
55%
State:
64%
(% for various income ranges: 52.7% for AGIs below $25k, 54.3% for AGIs $25k-50k, 56.7% for AGIs $50k-75k, 58.5% for AGIs $75k-100k, 64.3% for AGIs $100k-200k, 87.5% for AGIs over 200k)
Averages for the 2004 tax year for zip code 93722, filed in 2005:
Average Adjusted Gross Income (AGI) in 2004: $40,849 (Individual Income Tax Returns)
Here:
$40,849
State:
$58,600
Salary/wage: $37,580 (reported on 88.9% of returns)
Here:
$37,580
State:
$49,455
(% of AGI for various income ranges: 185.9% for AGIs below $10k, 81.8% for AGIs $10k-25k, 86.6% for AGIs $25k-50k, 88.3% for AGIs $50k-75k, 87.2% for AGIs $75k-100k, 62.4% for AGIs over 100k)
Taxable interest for individuals: $895 (reported on 41.2% of returns)
This zip code:
$895
California:
$2,365
(% of AGI for various income ranges: 6.1% for AGIs below $10k, 0.8% for AGIs $10k-25k, 0.5% for AGIs $25k-50k, 0.7% for AGIs $50k-75k, 0.5% for AGIs $75k-100k, 1.6% for AGIs over 100k)
Taxable dividends: $1,626 (reported on 11.5% of returns)
Here:
$1,626
State:
$4,746
(% of AGI for various income ranges: 2.7% for AGIs below $10k, 0.5% for AGIs $10k-25k, 0.3% for AGIs $25k-50k, 0.3% for AGIs $50k-75k, 0.3% for AGIs $75k-100k, 0.8% for AGIs over 100k)
Net capital gain/loss: +$12,272 (reported on 10.0% of returns)
Here:
+$12,272
State:
+$23,418
(% of AGI for various income ranges: 1.1% for AGIs below $10k, 0.1% for AGIs $10k-25k, 0.3% for AGIs $25k-50k, 0.8% for AGIs $50k-75k, 1.5% for AGIs $75k-100k, 10.3% for AGIs over 100k)
Profit/loss from business: +$12,046 (reported on 15.5% of returns)
Here:
+$12,046
State:
+$16,826
(% of AGI for various income ranges: 7.1% for AGIs below $10k, 8.0% for AGIs $10k-25k, 5.0% for AGIs $25k-50k, 3.2% for AGIs $50k-75k, 2.7% for AGIs $75k-100k, 5.0% for AGIs over 100k)
Profit/loss from farming: +$426 (reported on 1.3% of returns)
Here:
+$426
State:
-$7,562
(% of AGI for various income ranges: -6.4% for AGIs below $10k, -0.0% for AGIs $10k-25k, -0.0% for AGIs $25k-50k, -0.1% for AGIs $50k-75k, 0.3% for AGIs $75k-100k, 0.3% for AGIs over 100k)
IRA payment deduction: $2,791 (reported on 2.0% of returns)
93722:
$2,791
California:
$3,192
(% of AGI for various income ranges: 0.2% for AGIs below $10k, 0.1% for AGIs $10k-25k, 0.2% for AGIs $25k-50k, 0.1% for AGIs $50k-75k, 0.1% for AGIs $75k-100k, 0.1% for AGIs over 100k)
Self-employed pension: $11,774 (reported on 0.5% of returns)
Here:
$11,774
California:
$17,688
(% of AGI for various income ranges: 0.0% for AGIs $10k-25k, 0.0% for AGIs $25k-50k, 0.1% for AGIs $50k-75k, 0.1% for AGIs $75k-100k, 0.4% for AGIs over 100k)
Total itemized deductions: $20,356 (29% of AGI, reported on 37.8% of returns)
Here:
$20,356
State:
$28,113
Here:
28.8% of AGI
State:
25.3% of AGI
(% of AGI for various income ranges: 16.5% for AGIs below $10k, 9.3% for AGIs $10k-25k, 19.7% for AGIs $25k-50k, 23.5% for AGIs $50k-75k, 20.1% for AGIs $75k-100k, 17.1% for AGIs over 100k)
Charity contributions deductions: $2,196 (3% of AGI, reported on 33.0% of returns)
Here:
$2,196
State:
$3,923
Here:
3.0% of AGI
State:
3.3% of AGI
(% of AGI for various income ranges: 0.7% for AGIs below $10k, 0.7% for AGIs $10k-25k, 1.4% for AGIs $25k-50k, 2.0% for AGIs $50k-75k, 2.1% for AGIs $75k-100k, 2.3% for AGIs over 100k)
Total tax: $5,325 (reported on 71.5% of returns)
93722:
$5,325
State:
$10,761
(% of AGI for various income ranges: 5.7% for AGIs below $10k, 3.9% for AGIs $10k-25k, 5.9% for AGIs $25k-50k, 7.8% for AGIs $50k-75k, 9.4% for AGIs $75k-100k, 16.8% for AGIs over 100k)
Earned income credit: $1,859 (reported on 23.3% of returns)
Here:
$1,859
State:
$1,763
Percentage of individuals using paid preparers for their 2004 taxes: 60.3%
Here:
60%
State:
66%
(% for various income ranges: 51.6% for AGIs below $10k, 60.4% for AGIs $10k-25k, 59.7% for AGIs $25k-50k, 63.1% for AGIs $50k-75k, 65.3% for AGIs $75k-100k, 74.3% for AGIs over 100k)
Likely homosexual households (counted as self-reported same-sex unmarried-partner households)
Lesbian couples: 0.3% of all households
Gay men: 0.2% of all households
Household received Food Stamps/SNAP in the past 12 months: 6,264 Household did not receive Food Stamps/SNAP in the past 12 months: 21,303
Women who had a birth in the past 12 months: 787 (500 now married, 288 unmarried) Women who did not have a birth in the past 12 months: 20,945 (8,658 now married, 12,272 unmarried)
Housing units in zip code 93722 with a mortgage: 12,087 (631 second mortgage, 6 home equity loan, 481 both second mortgage and home equity loan) Houses without a mortgage: 49
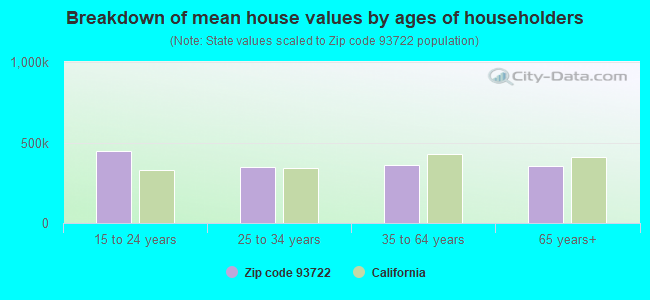
Median monthly owner costs for units with a mortgage: $1,771 Median monthly owner costs for units without a mortgage: $591
Residents with income below the poverty level in 2022:
This zip code:
17.4%
Whole state:
12.2%
Residents with income below 50% of the poverty level in 2022:
This zip code:
8.0%
Whole state:
6.2%
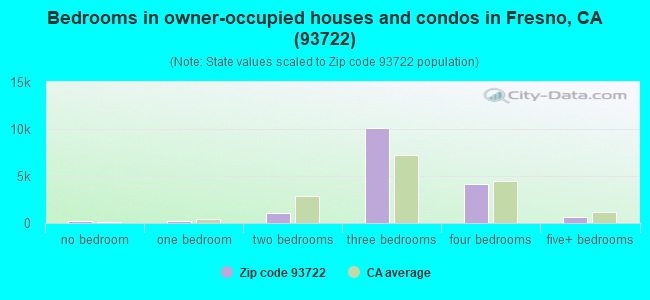
Median number of rooms in houses and condos:
Here:
5.9
State:
6.0
Median number of rooms in apartments:
Here:
4.5
State:
3.9
Notable locations in this zip code not listed on our city pages
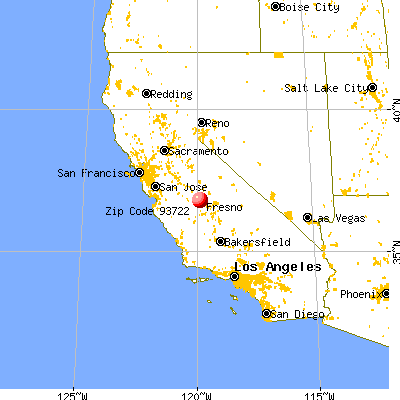
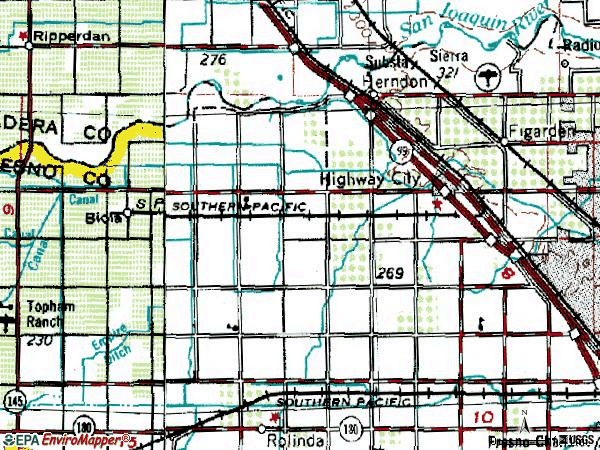
Notable locations in zip code 93722: Herndon Substation (A), Forestiere Underground Gardens (B), Fresno Yard (C), Riverside Municipal Golf Course (D), Fresno City Fire Department Station 16 (E), Fresno City Fire Department Station 14 (F). Display/hide their locations on the map
Churches in zip code 93722 include: Divine Master Convent (A), Church of God of Prophecy (B), Community Baptist Church (C), Fresno Cambodian Buddhist Society (D), West McKinley Assembly of God Church (E), First Spanish Baptist Church (F), Highway City Ministries (G), North Gate Assembly of God Church (H), Northwest Church of Christ (I). Display/hide their locations on the map
12,245 married couples with children.
8,179 single-parent households (2,134 men, 6,045 women).
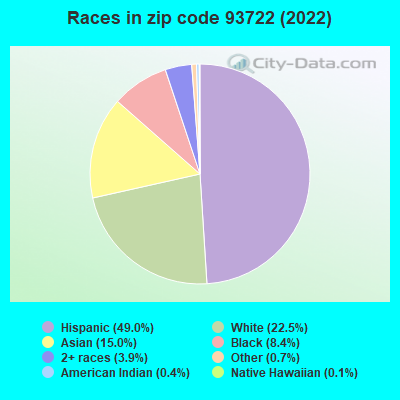
56.0% of residents of 93722 zip code speak English at home.
27.7% of residents speak Spanish at home (70% very well, 12% well, 10% not well, 8% not at all).
8.6% of residents speak other Indo-European language at home (53% very well, 26% well, 13% not well, 8% not at all).
5.9% of residents speak Asian or Pacific Island language at home (63% very well, 18% well, 12% not well, 7% not at all).
1.9% of residents speak other language at home (66% very well, 17% well, 15% not well, 2% not at all).
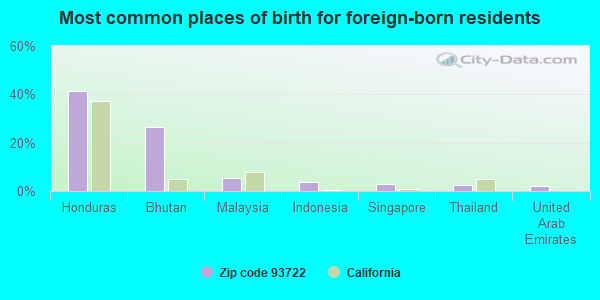
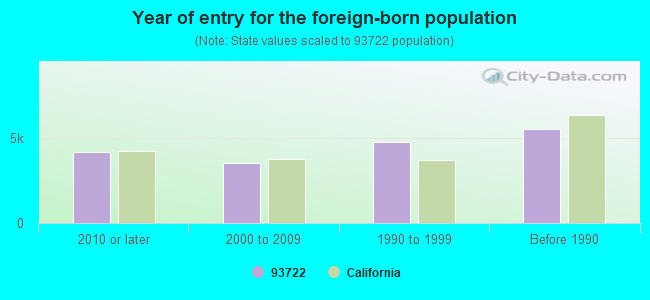
Foreign born population: 17,178 (20.1%) (55.1% of them are naturalized citizens)
Major facilities with environmental interests located in this zip code:
APC CONTRACTORS, INC (4606 N BENDEL AVE in FRESNO, CA)
STATE MASTER (California - Hazardous Waste Tracking) - HAZARDOU WASTE PROGRAM COMPLIANCE ACTIVITY (Tracking inspections of insecticide, fungicide, and rodenticide, and toxic substances) TRANSPORTER (Resource Conservation and Recovery Act (tracking hazardous waste)) - notification (Resource Conservation and Recovery Act (tracking hazardous waste)) Organizations: A P C CONTRACTORS (CONTACT/OWNER)
, APC CONTRACTORS INC (CONTACT/OWNER)
, ARCHIE PECKHAM (CONTACT/OWNER)
Alternative names: A P C CONTRACTORS INC
HOT TANK SUPPLY CO (3250 N MARKS AVE in FRESNO, CA)
STATE MASTER (California - Hazardous Waste Tracking) - HAZARDOU WASTE PROGRAM TRANSPORTER (Resource Conservation and Recovery Act (tracking hazardous waste)) - notification (Resource Conservation and Recovery Act (tracking hazardous waste)) Business NAICS classification: SOLID WASTE COLLECTION.; HAZARDOUS WASTE COLLECTION. Organizations: KURT LANSE (CONTACT/OPERATOR)
CARLIN MANUFACTURING (3714 N VALENTINE in FRESNO, CA)
STATE MASTER (California - Hazardous Waste Tracking) - HAZARDOU WASTE PROGRAM Small Quantity Generators, between 100 kg and 1000 kg of hazardous waste/month (Resource Conservation and Recovery Act (tracking hazardous waste)) - notification Organizations: TCBY INTERPRISES INC (CONTACT/OWNER)
ALL STAR REBUILDERS (3261 N MARKS in FRESNO, CA)
(Integrated Compliance Information System) - ICIS-09-1997-0103, FORMAL ENFORCEMENT ACTION, ICIS-09-1997-0024, Small Quantity Generators, between 100 kg and 1000 kg of hazardous waste/month (Resource Conservation and Recovery Act (tracking hazardous waste)) - notification Business SIC classification: GENERAL AUTOMOTIVE REPAIR SHOPS; REPAIR SHOPS AND RELATED SERVICES Business NAICS classification: GENERAL AUTOMOTIVE REPAIR. Organizations: MITCHELL JAMES (CONTACT/OWNER)
ECONO LUBE N TUBE #92 (4127 W SHAW in FRESNO, CA)
STATE MASTER (California - Hazardous Waste Tracking) - HAZARDOU WASTE PROGRAM Small Quantity Generators, between 100 kg and 1000 kg of hazardous waste/month (Resource Conservation and Recovery Act (tracking hazardous waste)) - notification Organizations: GARY COLE (CONTACT/OWNER)
LIDDELL (NORMAN) ELEMENTARY (5455 W ALLUVIAL in FRESNO, CA)
(National Center for Education Statistics) - STATE ID-6115521 Organizations: CENTRAL UNIFIED (SCHOOL DISTRICT)
EL CAPITAN ELEMENTARY (4443 W. WELDON in FRESNO, CA)
(National Center for Education Statistics) - STATE ID-6006936 Organizations: CENTRAL UNIFIED (SCHOOL DISTRICT)
LAWLESS ELEMENTARY (5255 N. REESE in FRESNO, CA)
(National Center for Education Statistics) - STATE ID-6102016 Organizations: FRESNO UNIFIED (SCHOOL DISTRICT)
FIGARDEN ELEMENTARY (6235 N. BRAWLEY AVE. in FRESNO, CA)
(National Center for Education Statistics) - STATE ID-6006233 Organizations: FRESNO UNIFIED (SCHOOL DISTRICT)
FOSTER FARMS DIARY (3380 W. ASHLAN in FRESNO, CA)
(Integrated Compliance Information System) - ICIS-09-1999-0010, FORMAL ENFORCEMENT ACTION TRI REPORTER (Tracking of toxic chemicals releasing facilities) Business SIC classification: FLUID MILK Alternative names: FOSTER DAIRY FARMS
HOUGHTON-KEARNEY ELEMENTARY (4605 N. POLK in FRESNO, CA)
(National Center for Education Statistics) - STATE ID-6006662 Organizations: CENTRAL UNIFIED (SCHOOL DISTRICT)
KROEKER INC (2098 CORNELIA in FRESNO, CA)
TRANSPORTER (Resource Conservation and Recovery Act (tracking hazardous waste)) (Resource Conservation and Recovery Act (tracking hazardous waste)) Organizations: EDWIN EARL KROEKER (CONTACT/OWNER)
, ED AND JOYCE KROKER (CONTACT/OWNER)
HERNDON-BARSTOW ELEMENTARY (6265 N. GRANTLAND AVE. in FRESNO, CA)
(National Center for Education Statistics) - STATE ID-6006654 Organizations: CENTRAL UNIFIED (SCHOOL DISTRICT)
Housing units lacking complete plumbing facilities: 0.3% Housing units lacking complete kitchen facilities: 2.1%
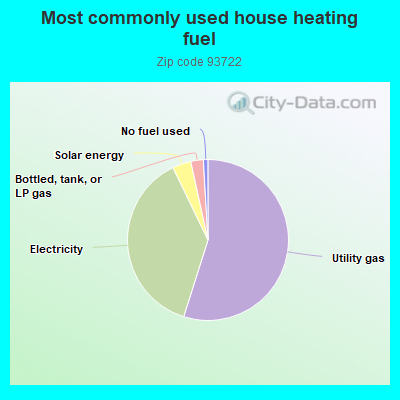
54.4%Utility gas
37.6%Electricity
3.7%Solar energy
2.5%Bottled, tank, or LP gas
0.9%No fuel used
Population in 1990: 33,523. Population change in the 1990s: +27,356 (+81.6%).
Place of birth for U.S.-born residents:
This state: 60,873
Northeast: 1,056
Midwest: 1,192
South: 2,960
West: 1,691
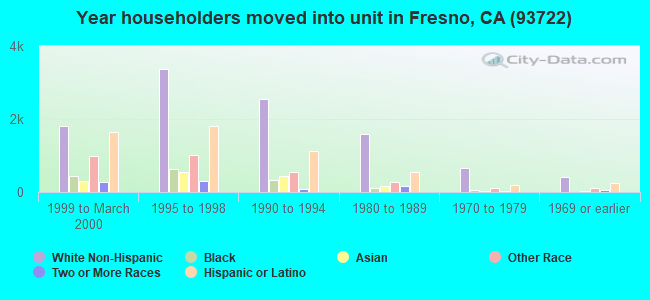
53% of the 93722 zip code residents lived in the same house 5 years ago. Out of people who lived in different houses, 78% lived in this county. Out of people who lived in different counties, 50% lived in California.
90% of the 93722 zip code residents lived in the same house 1 year ago. Out of people who lived in different houses, 61% moved from this county. Out of people who lived in different houses, 25% moved from different county within same state. Out of people who lived in different houses, 10% moved from different state. Out of people who lived in different houses, 3% moved from abroad.
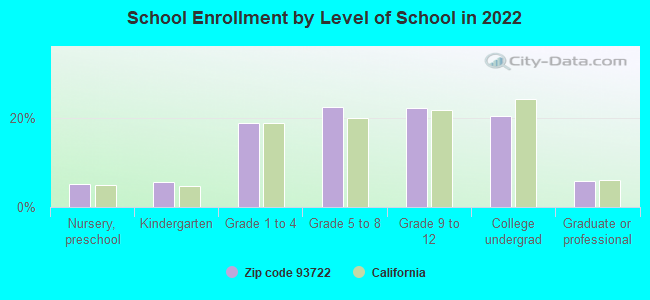
Private vs. public school enrollment:
Students in private schools in grades 1 to 8 (elementary and middle school): 550
Here:
5.3%
California:
10.5%
Students in private schools in grades 9 to 12 (high school): 413
Here:
7.5%
California:
8.5%
Students in private undergraduate colleges: 603
Here:
11.9%
California:
15.9%
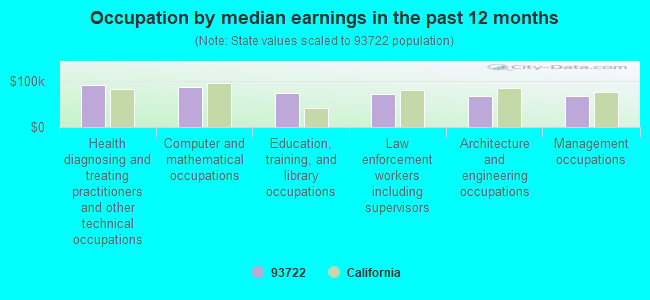
Occupation by median earnings in the past 12 months ($)
90,878Health diagnosing and treating practitioners and other technical occupations
88,260Computer and mathematical occupations
74,068Education, training, and library occupations
72,983Law enforcement workers including supervisors
67,502Architecture and engineering occupations
67,463Management occupations
Companies with federal contracts located in this zip code (FRESNO, CA):
J I GARCIA CONSTRUCTION INC (5591 N GOLDENSTATE BLVD; small business) : $39,966,273 in 294 contractsfrom 1999 to 2006
Contracts for Construction of Structures and Facilities -- Other Industrial Buildings, Construction of Structures and Facilities -- Electronic and Communications Facilities, Construction of Structures and Facilities -- Troop Housing Facilities, Maintenance, Repair or Alteration of Real Property -- Office Buildings, and moreby Army, Public Buildings Service, Navy, United States Coast Guard (disused code: now 7008), and others Signed by year:2000: $7,620,550; 2001: $8,096,552; 2002: $3,352,038; 2003: $7,632,125; 2004: $9,607,701; 2005: $795,991; 2006: $2,282,786.
Biggest contracts:
$5,472,002 with Army for Construction of Structures and Facilities -- Other Industrial Buildings. Signed on 2004-09-20. Completion date: 2004-08-19.
$5,453,000 with Army for Construction of Structures and Facilities -- Electronic and Communications Facilities. Signed on 2003-07-10. Completion date: 2004-06-01.
$2,845,000 with Army for Construction of Structures and Facilities -- Troop Housing Facilities. Signed on 2001-09-30. Completion date: 2002-11-25.
$2,056,790 with Public Buildings Service for Maintenance, Repair or Alteration of Real Property -- Office Buildings. Signed on 2006-06-20. Completion date: 2006-11-16.
MJ AVILA COMPANY (7258 W RIALTO AVE; small business) : $9,926,609 in 178 contractsfrom 2001 to 2006
Contracts for Maintenance, Repair or Alteration of Real Property -- Other Industrial Buildings, Maintenance, Repair or Alteration of Real Property -- Other Administrative Facilities and Service Buildings, Other Architect and Engineering Services, Maintenance, Repair or Alteration of Real Property -- Other Airfield Structures, and moreby NASA, Bureau of Reclamation, Minerals Management Service, Navy, and others Signed by year:2000: $0; 2001: $724,000; 2002: $40,776; 2003: $2,140,520; 2004: $3,489,491; 2005: $2,581,859; 2006: $949,963.
Biggest contracts:
$500,000 with NASA for Maintenance, Repair or Alteration of Real Property -- Other Industrial Buildings. Signed on 2005-10-31. Completion date: 2006-03-31.
$480,000 with Bureau of Reclamation for Maintenance, Repair or Alteration of Real Property -- Other Administrative Facilities and Service Buildings. Signed on 2006-09-30. Completion date: 2007-09-30.
$362,776 with Minerals Management Service for Other Architect and Engineering Services. Signed on 2004-01-09. Completion date: 2004-04-09.
$307,396 with Navy for Maintenance, Repair or Alteration of Real Property -- Other Airfield Structures. Signed on 2005-09-22. Completion date: 2006-01-20.
ALLRIGHT-GARCIA JOINT VENTURE (5591 N GOLDENSTATE BLVD; small business) : $4,963,262 in 11 contractsfrom 2003 to 2006
Contracts for Construction of Structures and Facilities -- Other Airfield Structures, Construction of Structures and Facilities -- Miscellaneous Buildings, Maintenance, Repair or Alteration of Real Property -- Highways, Roads, Streets, Bridges, and Railways (includes resurfacing), Maintenance, Repair or Alteration of Real Property -- Miscellaneous Buildings by Navy Signed by year:2000: $0; 2001: $0; 2002: $0; 2003: $1,181,868; 2004: $941,000; 2005: $2,035,394; 2006: $805,000.
Biggest contracts:
$1,395,000 with Navy for Construction of Structures and Facilities -- Other Airfield Structures. Signed on 2005-02-03. Completion date: 2005-12-07.
$1,077,000 with Navy for Construction of Structures and Facilities -- Miscellaneous Buildings. Signed on 2003-09-17. Completion date: 2003-09-17.
$966,000, same as above.Signed on 2004-12-20. Completion date: 2005-05-31.
$805,000, same as above.Signed on 2006-05-19. Completion date: 2007-06-04.
LAWRENCE GARCIA (5470 E SPRUCE AVE STE 102; small business) 45 employees, $590000 revenue. : $3,651,910 in 10 contractsfrom 2000 to 2005
Contracts for Guard Services by Public Buildings Service, Bureau of Immigration and Customs Enforcement Signed by year:2000: $438,000; 2001: $164,000; 2002: $1,721,000; 2003: $56,133; 2004: $1,269,515; 2005: $3,262; 2006: $0.
Biggest contracts:
$1,721,000 with Public Buildings Service for Guard Services. Signed on 2002-08-15. Completion date: 2003-09-15.
$1,269,515 with Bureau of Immigration and Customs Enforcement for Guard Services. Signed on 2004-11-01. Effective on 2004-10-01. Completion date: 2005-03-31.
$211,000 with Public Buildings Service for Guard Services. Signed on 2000-10-15. Completion date: 2001-09-15.
$155,000, same as above.Signed on 2000-10-15. Completion date: 2001-09-15.
BETTENCOURT PEST CONTROL INC (4507 N BENDEL; small business) : $46,200 in 4 contractsfrom 2004 to 2005
$11,550 with Army for Insect and Rodent Control Services. Signed on 2005-06-14. Completion date: 2005-09-30.
$11,550 with U.S. Army Corps of Engineers - civil program financing only for Insect and Rodent Control Services. Signed on 2005-06-14. Completion date: 2005-09-30.
$11,550 with Army for Insect and Rodent Control Services. Signed on 2004-05-20. Completion date: 2004-09-30.
$11,550 with U.S. Army Corps of Engineers - civil program financing only for Insect and Rodent Control Services. Signed on 2004-05-20. Completion date: 2004-09-30.
ALSDORF, JOHN (4235 W ALAMOS AVE; small business) : $44,267 in 4 contractsfrom 2005 to 2006
$19,751 with Army for Landscaping/Groundskeeping Services. Signed on 2006-06-14. Effective on 2006-04-01. Completion date: 2007-03-31.
$9,365, same as above.Signed on 2005-10-01. Completion date: 2006-09-30.
$9,365, same as above.Signed on 2005-10-01. Completion date: 2006-09-30.
$5,786, same as above.Signed on 2005-09-28. Completion date: 2005-10-28.
SUMMIT SPRINGS BOTTLED WATER I (5366 N BARCUS AVE; small business)
$25,000 with Navy for Maintenance, Repair and Rebuilding of Equipment -- Food Preparation and Serving Equipment. Signed on 2005-01-06. Completion date: 2005-09-30.
ROBERT J ALANDT & SONS INC (4692 N BRAWLEY AVE; small business) : $21,467 in 2 contractsin 2005
$14,243 with Navy for Plate, Sheet, Strip, Foil; and Leaf. Signed on 2005-05-23. Completion date: 2005-06-22.
$7,224, same as above.Signed on 2005-04-18. Completion date: 2005-05-02.
FRESNO RACK & SHELVING CO INC (4736 N BENDEL AVENUE; small business)
$5,956 with Army for Miscellaneous Items. Signed on 2004-09-25. Completion date: 2004-10-25.
SIERRA DISPLAY INC (4689 W JENNIFER AVE; small business)
$5,808 with Air Force for Indoor and Outdoor Electric Lighting Fixtures. Signed on 2004-11-12. Completion date: 2004-12-02.
Top industries in this zip code by the number of employees in 2005:
Professional, Scientific, and Technical Services: Other Services Related to Advertising (500-999 employees: 1 establishment, 100-249 employees: 1 establishment, 20-49 employees: 1 establishment, 10-19 employees: 2 establishments)
2004 - 2018 National Fire Incident Reporting System (NFIRS) incidents
Based on the data from the years 2004 - 2018 the average number of fires per year is 177. The highest number of fire incidents - 434 took place in 2017, and the least - 1 in 2011. The data has a rising trend.
When looking into fire subcategories, the most reports belonged to: Outside Fires (49.4%), and Structure Fires (28.6%).
Fire incident types reported to NFIRS in Zip Code 93722


+$426
-$7,562
(% of AGI for various income ranges: -6.4% for AGIs below $10k, -0.0% for AGIs $10k-25k, -0.0% for AGIs $25k-50k, -0.1% for AGIs $50k-75k, 0.3% for AGIs $75k-100k, 0.3% for AGIs over 100k) Nearest zip codes: 93705, 93711, 93728, 93704, 93723, 93650.
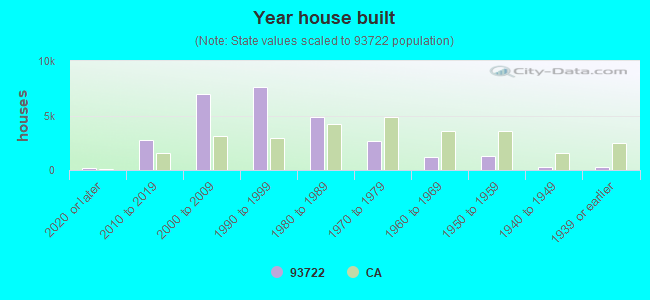


 Based on the data from the years 2004 - 2018 the average number of fires per year is 177. The highest number of fire incidents - 434 took place in 2017, and the least - 1 in 2011. The data has a rising trend.
 When looking into fire subcategories, the most reports belonged to: Outside Fires (49.4%), and Structure Fires (28.6%).