Estimated zip code population in 2022: 39,631 Zip code population in 2010: 36,731 Zip code population in 2000: 36,269
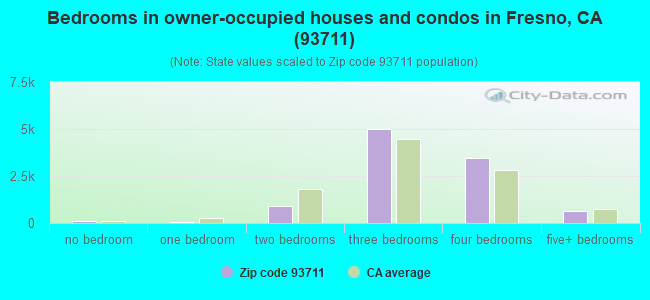
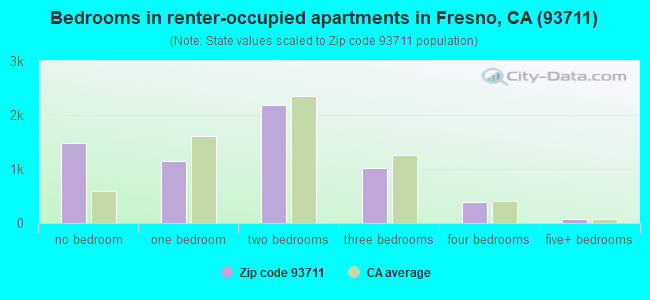
Houses and condos: 16,845 Renter-occupied apartments: 6,224
% of renters here:
38%
State:
44%
March 2022 cost of living index in zip code 93711: 96.5 (near average, U.S. average is 100)
Land area: 11.3 sq. mi. Water area: 0.1 sq. mi.
Population density: 3,498 people per square mile
(average).
OSM Map
General Map
Google Map
MSN Map
OSM Map
General Map
Google Map
MSN Map
OSM Map
General Map
Google Map
MSN Map
OSM Map
General Map
Google Map
MSN Map
Please wait while loading the map...
Real estate property taxes paid for housing units in 2022:
This zip code:
0.8% ($3,766)
California:
0.7% ($4,831)
Median real estate property taxes paid for housing units with mortgages in 2022: $3,868 (0.8%) Median real estate property taxes paid for housing units with no mortgage in 2022: $3,716 (0.7%)
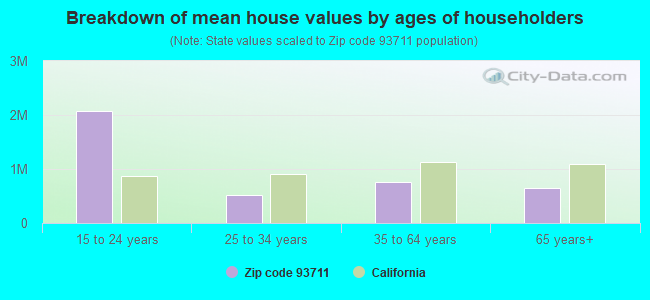
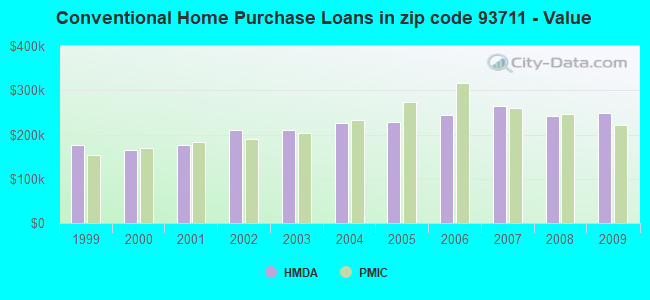
Estimated median house/condo value in 2022: $489,609
93711:
$489,609
California:
$715,900
According to our research of California and other state lists, there were 32 registered sex offenders living in 93711 zip code as of April 27, 2024. The ratio of all residents to sex offenders in zip code 93711 is 1,176 to 1. The ratio of registered sex offenders to all residents in this zip code is lower than the state average.
Median resident age:
This zip code:
40.0 years
California median age:
37.9 years
Average household size:
This zip code:
2.4 people
California:
2.8 people
Averages for the 2020 tax year for zip code 93711, filed in 2021:
Average Adjusted Gross Income (AGI) in 2020: $113,940 (Individual Income Tax Returns)
Here:
$113,940
State:
$95,910
Salary/wage: $74,250 (reported on 74.0% of returns)
Here:
$74,250
State:
$77,331
(% of AGI for various income ranges: 1258.7% for AGIs below $25k, 3963.0% for AGIs $25k-50k, 7033.1% for AGIs $50k-75k, 9909.2% for AGIs $75k-100k, 19384.8% for AGIs $100k-200k, 98038.6% for AGIs over 200k)
Taxable interest for individuals: $4,352 (reported on 47.0% of returns)
This zip code:
$4,352
California:
$2,294
(% of AGI for various income ranges: 28.7% for AGIs below $25k, 38.2% for AGIs $25k-50k, 103.0% for AGIs $50k-75k, 177.2% for AGIs $75k-100k, 393.1% for AGIs $100k-200k, 6679.3% for AGIs over 200k)
Ordinary dividends: $16,947 (reported on 25.9% of returns)
Here:
$16,947
State:
$10,949
(% of AGI for various income ranges: 51.6% for AGIs below $25k, 79.1% for AGIs $25k-50k, 159.7% for AGIs $50k-75k, 373.2% for AGIs $75k-100k, 848.7% for AGIs $100k-200k, 14639.0% for AGIs over 200k)
Net capital gain/loss in AGI: +$38,643 (reported on 25.8% of returns)
Here:
+$38,643
State:
+$49,306
(% of AGI for various income ranges: 15.8% for AGIs below $25k, 45.4% for AGIs $25k-50k, 146.3% for AGIs $50k-75k, 312.6% for AGIs $75k-100k, 1090.1% for AGIs $100k-200k, 39855.0% for AGIs over 200k)
Profit/loss from business: +$24,141 (reported on 19.7% of returns)
Here:
+$24,141
State:
+$15,671
(% of AGI for various income ranges: 225.7% for AGIs below $25k, 449.4% for AGIs $25k-50k, 522.1% for AGIs $50k-75k, 580.8% for AGIs $75k-100k, 1225.5% for AGIs $100k-200k, 9547.4% for AGIs over 200k)
Taxable individual retirement arrangement distribution: $26,155 (reported on 11.5% of returns)
93711:
$26,155
California:
$23,505
(% of AGI for various income ranges: 70.5% for AGIs below $25k, 122.8% for AGIs $25k-50k, 272.3% for AGIs $50k-75k, 548.5% for AGIs $75k-100k, 1307.1% for AGIs $100k-200k, 5507.9% for AGIs over 200k)
Self-employed (Keogh) retirement plans: $26,165 (reported on 1.4% of returns)
93711:
$26,165
California:
$30,163
(% of AGI for various income ranges: 51.2% for AGIs $75k-100k, 75.1% for AGIs $100k-200k, 1234.5% for AGIs over 200k)
Total itemized deductions: $40,774 (reported on 17.1% of returns)
Here:
$40,774
State:
$39,517
(% of AGI for various income ranges: 116.8% for AGIs below $25k, 198.1% for AGIs $25k-50k, 545.3% for AGIs $50k-75k, 1188.9% for AGIs $75k-100k, 2414.0% for AGIs $100k-200k, 16402.9% for AGIs over 200k)
Charity contributions: $13,179 (reported on 14.5% of returns)
Here:
$13,179
State:
$12,598
(% of AGI for various income ranges: 6.1% for AGIs below $25k, 19.6% for AGIs $25k-50k, 73.6% for AGIs $50k-75k, 192.3% for AGIs $75k-100k, 512.5% for AGIs $100k-200k, 5996.0% for AGIs over 200k)
Taxes paid: $8,550 (reported on 17.1% of returns)
93711:
$8,550
State:
$8,807
(% of AGI for various income ranges: 20.0% for AGIs below $25k, 41.0% for AGIs $25k-50k, 126.9% for AGIs $50k-75k, 341.4% for AGIs $75k-100k, 709.5% for AGIs $100k-200k, 2477.1% for AGIs over 200k)
Earned income credit: $1,823 (reported on 10.6% of returns)
Here:
$1,823
State:
$2,074
(% of AGI for various income ranges: 70.7% for AGIs below $25k, 58.2% for AGIs $25k-50k, 1.1% for AGIs $50k-75k)
Percentage of individuals using paid preparers for their 2020 taxes: 93.4%
Here:
93%
State:
92%
(% for various income ranges: 92.9% for AGIs below $25k, 93.5% for AGIs $25k-50k, 92.9% for AGIs $50k-75k, 93.7% for AGIs $75k-100k, 93.4% for AGIs $100k-200k, 95.0% for AGIs over 200k)
Averages for the 2012 tax year for zip code 93711, filed in 2013:
Average Adjusted Gross Income (AGI) in 2012: $106,579 (Individual Income Tax Returns)
Here:
$106,579
State:
$72,726
Salary/wage: $68,137 (reported on 76.3% of returns)
Here:
$68,137
State:
$59,079
(% of AGI for various income ranges: 71.1% for AGIs below $25k, 72.9% for AGIs $25k-50k, 65.9% for AGIs $50k-75k, 62.1% for AGIs $75k-100k, 60.9% for AGIs $100k-200k, 34.5% for AGIs over 200k)
Taxable interest for individuals: $5,406 (reported on 50.1% of returns)
This zip code:
$5,406
California:
$2,146
(% of AGI for various income ranges: 1.7% for AGIs below $25k, 1.1% for AGIs $25k-50k, 1.4% for AGIs $50k-75k, 1.2% for AGIs $75k-100k, 1.3% for AGIs $100k-200k, 3.7% for AGIs over 200k)
Ordinary dividends: $17,794 (reported on 29.9% of returns)
Here:
$17,794
State:
$9,308
(% of AGI for various income ranges: 3.1% for AGIs below $25k, 1.9% for AGIs $25k-50k, 2.3% for AGIs $50k-75k, 2.3% for AGIs $75k-100k, 2.9% for AGIs $100k-200k, 7.2% for AGIs over 200k)
Net capital gain/loss in AGI: +$24,883 (reported on 26.4% of returns)
Here:
+$24,883
State:
+$30,460
(% of AGI for various income ranges: 0.2% for AGIs $25k-50k, 0.2% for AGIs $50k-75k, 0.8% for AGIs $75k-100k, 1.8% for AGIs $100k-200k, 10.9% for AGIs over 200k)
Profit/loss from business: +$29,086 (reported on 17.5% of returns)
Here:
+$29,086
State:
+$17,064
(% of AGI for various income ranges: 8.4% for AGIs below $25k, 5.2% for AGIs $25k-50k, 4.1% for AGIs $50k-75k, 4.4% for AGIs $75k-100k, 5.0% for AGIs $100k-200k, 4.5% for AGIs over 200k)
Taxable individual retirement arrangement distribution: $22,479 (reported on 14.8% of returns)
93711:
$22,479
California:
$19,557
(% of AGI for various income ranges: 3.8% for AGIs below $25k, 2.9% for AGIs $25k-50k, 4.0% for AGIs $50k-75k, 4.7% for AGIs $75k-100k, 4.3% for AGIs $100k-200k, 2.3% for AGIs over 200k)
Self-employment retirement plans: $22,323 (reported on 1.8% of returns)
93711:
$22,323
California:
$24,530
(% of AGI for various income ranges: 0.3% for AGIs $25k-50k, 0.2% for AGIs $75k-100k, 0.4% for AGIs $100k-200k, 0.5% for AGIs over 200k)
Total itemized deductions: $38,983 (20% of AGI, reported on 45.3% of returns)
Here:
$38,983
State:
$34,004
Here:
20.0% of AGI
State:
22.7% of AGI
(% of AGI for various income ranges: 13.7% for AGIs below $25k, 12.0% for AGIs $25k-50k, 16.4% for AGIs $50k-75k, 17.5% for AGIs $75k-100k, 18.3% for AGIs $100k-200k, 16.6% for AGIs over 200k)
Charity contributions: $7,336 (reported on 39.9% of returns)
Here:
$7,336
State:
$4,659
(% of AGI for various income ranges: 1.0% for AGIs below $25k, 1.2% for AGIs $25k-50k, 2.1% for AGIs $50k-75k, 2.4% for AGIs $75k-100k, 2.5% for AGIs $100k-200k, 3.3% for AGIs over 200k)
Taxes paid: $17,850 (reported on 45.1% of returns)
93711:
$17,850
State:
$14,448
(% of AGI for various income ranges: 2.8% for AGIs below $25k, 2.7% for AGIs $25k-50k, 4.3% for AGIs $50k-75k, 5.5% for AGIs $75k-100k, 7.3% for AGIs $100k-200k, 9.5% for AGIs over 200k)
Earned income credit: $1,993 (reported on 12.4% of returns)
Here:
$1,993
State:
$2,286
(% of AGI for various income ranges: 4.9% for AGIs below $25k, 0.9% for AGIs $25k-50k)
Percentage of individuals using paid preparers for their 2012 taxes: 61.9%
Here:
62%
State:
64%
(% for various income ranges: 52.7% for AGIs below $25k, 53.6% for AGIs $25k-50k, 62.3% for AGIs $50k-75k, 65.1% for AGIs $75k-100k, 73.4% for AGIs $100k-200k, 87.9% for AGIs over 200k)
Averages for the 2004 tax year for zip code 93711, filed in 2005:
Average Adjusted Gross Income (AGI) in 2004: $95,510 (Individual Income Tax Returns)
Here:
$95,510
State:
$58,600
Salary/wage: $61,446 (reported on 78.2% of returns)
Here:
$61,446
State:
$49,455
(% of AGI for various income ranges: 71.9% for AGIs $10k-25k, 73.7% for AGIs $25k-50k, 69.3% for AGIs $50k-75k, 66.2% for AGIs $75k-100k, 40.9% for AGIs over 100k)
Taxable interest for individuals: $4,851 (reported on 60.4% of returns)
This zip code:
$4,851
California:
$2,365
(% of AGI for various income ranges: 3.4% for AGIs $10k-25k, 2.1% for AGIs $25k-50k, 2.1% for AGIs $50k-75k, 2.4% for AGIs $75k-100k, 3.1% for AGIs over 100k)
Taxable dividends: $5,866 (reported on 37.0% of returns)
Here:
$5,866
State:
$4,746
(% of AGI for various income ranges: 3.0% for AGIs $10k-25k, 2.1% for AGIs $25k-50k, 2.2% for AGIs $50k-75k, 2.3% for AGIs $75k-100k, 2.2% for AGIs over 100k)
Net capital gain/loss: +$29,405 (reported on 33.7% of returns)
Here:
+$29,405
State:
+$23,418
(% of AGI for various income ranges: 0.5% for AGIs $10k-25k, 0.8% for AGIs $25k-50k, 1.5% for AGIs $50k-75k, 1.7% for AGIs $75k-100k, 13.9% for AGIs over 100k)
Profit/loss from business: +$37,557 (reported on 19.0% of returns)
Here:
+$37,557
State:
+$16,826
(% of AGI for various income ranges: 6.6% for AGIs $10k-25k, 5.1% for AGIs $25k-50k, 5.8% for AGIs $50k-75k, 5.7% for AGIs $75k-100k, 8.1% for AGIs over 100k)
Profit/loss from farming: +$3,335 (reported on 1.2% of returns)
Here:
+$3,335
State:
-$7,562
(% of AGI for various income ranges: -0.0% for AGIs $25k-50k, 0.2% for AGIs $50k-75k, 0.1% for AGIs $75k-100k, 0.2% for AGIs over 100k)
IRA payment deduction: $3,685 (reported on 3.7% of returns)
93711:
$3,685
California:
$3,192
(% of AGI for various income ranges: 0.2% for AGIs $10k-25k, 0.3% for AGIs $25k-50k, 0.2% for AGIs $50k-75k, 0.2% for AGIs $75k-100k, 0.1% for AGIs over 100k)
Self-employed pension: $19,353 (reported on 3.0% of returns)
Here:
$19,353
California:
$17,688
(% of AGI for various income ranges: 0.1% for AGIs $10k-25k, 0.2% for AGIs $25k-50k, 0.5% for AGIs $50k-75k, 0.4% for AGIs $75k-100k, 0.7% for AGIs over 100k)
Total itemized deductions: $32,338 (19% of AGI, reported on 48.6% of returns)
Here:
$32,338
State:
$28,113
Here:
19.1% of AGI
State:
25.3% of AGI
(% of AGI for various income ranges: 14.6% for AGIs $10k-25k, 15.2% for AGIs $25k-50k, 18.6% for AGIs $50k-75k, 20.0% for AGIs $75k-100k, 15.6% for AGIs over 100k)
Charity contributions deductions: $6,338 (4% of AGI, reported on 44.9% of returns)
Here:
$6,338
State:
$3,923
Here:
3.6% of AGI
State:
3.3% of AGI
(% of AGI for various income ranges: 1.3% for AGIs $10k-25k, 1.8% for AGIs $25k-50k, 2.4% for AGIs $50k-75k, 3.1% for AGIs $75k-100k, 3.2% for AGIs over 100k)
Total tax: $21,323 (reported on 82.8% of returns)
93711:
$21,323
State:
$10,761
(% of AGI for various income ranges: 4.9% for AGIs $10k-25k, 7.8% for AGIs $25k-50k, 9.8% for AGIs $50k-75k, 11.1% for AGIs $75k-100k, 22.0% for AGIs over 100k)
Earned income credit: $1,560 (reported on 8.1% of returns)
Here:
$1,560
State:
$1,763
Percentage of individuals using paid preparers for their 2004 taxes: 66.1%
Here:
66%
State:
66%
(% for various income ranges: 58.1% for AGIs below $10k, 57.1% for AGIs $10k-25k, 58.9% for AGIs $25k-50k, 66.9% for AGIs $50k-75k, 73.4% for AGIs $75k-100k, 82.8% for AGIs over 100k)
Likely homosexual households (counted as self-reported same-sex unmarried-partner households)
Lesbian couples: 0.1% of all households
Gay men: 0.3% of all households
Household received Food Stamps/SNAP in the past 12 months: 1,137 Household did not receive Food Stamps/SNAP in the past 12 months: 15,039
Women who had a birth in the past 12 months: 529 (374 now married, 155 unmarried) Women who did not have a birth in the past 12 months: 7,874 (3,366 now married, 4,497 unmarried)
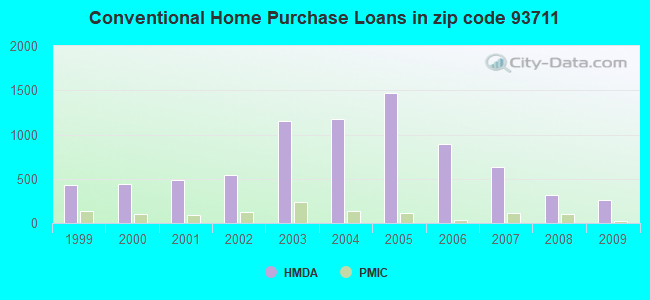
Housing units in zip code 93711 with a mortgage: 6,172 (412 second mortgage, 30 home equity loan, 323 both second mortgage and home equity loan) Houses without a mortgage: 145
Median monthly owner costs for units with a mortgage: $2,216 Median monthly owner costs for units without a mortgage: $894
Residents with income below the poverty level in 2022:
This zip code:
7.6%
Whole state:
12.2%
Residents with income below 50% of the poverty level in 2022:
This zip code:
3.3%
Whole state:
6.2%
Median number of rooms in houses and condos:
Here:
6.8
State:
6.0
Median number of rooms in apartments:
Here:
3.5
State:
3.9
Notable locations in this zip code not listed on our city pages
Notable locations in zip code 93711: Circle M Ranch (A), Fig Garden Golf Course (B), San Joaquin Country Club (C), Fresno County Free Library (D), Fresno City Fire Department Station 2 (E), North Central Fire Protection District Station 47 (F). Display/hide their locations on the map
Churches in zip code 93711 include: Good Shepherd Lutheran Church (A), Northwest Church (B), Van Ness Community Baptist Church (C), Faith United Methodist Church (D). Display/hide their locations on the map
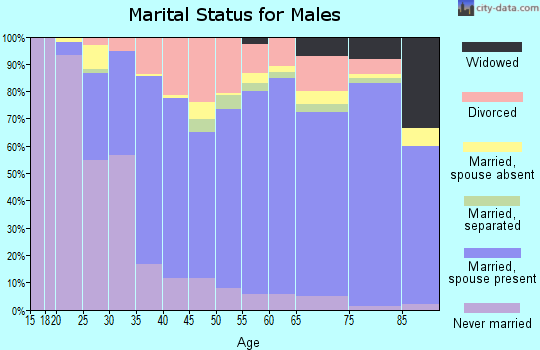
6,100 married couples with children.
1,162 single-parent households (233 men, 929 women).
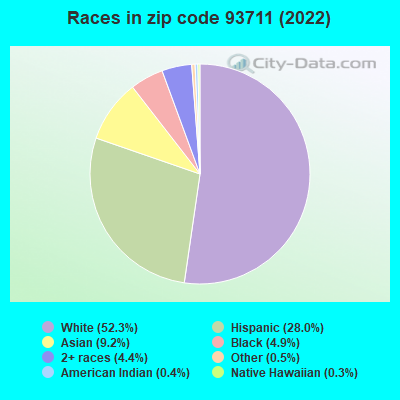
73.8% of residents of 93711 zip code speak English at home.
12.0% of residents speak Spanish at home (80% very well, 13% well, 6% not well, 1% not at all).
8.5% of residents speak other Indo-European language at home (68% very well, 25% well, 7% not well).
4.7% of residents speak Asian or Pacific Island language at home (59% very well, 25% well, 14% not well, 2% not at all).
1.4% of residents speak other language at home (78% very well, 21% well, 1% not well).
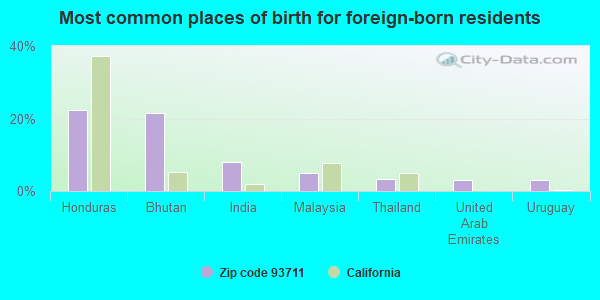
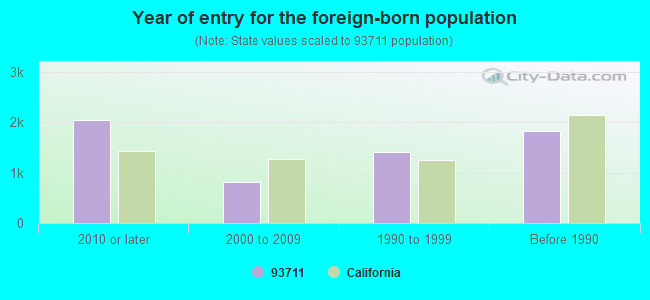
Foreign born population: 5,220 (13.2%) (60.4% of them are naturalized citizens)
Major facilities with environmental interests located in this zip code:
MALLOCH ELEMENTARY (2251 W. MORRIS AVE. in FRESNO, CA)
(National Center for Education Statistics) - STATE ID-6006381 (Resource Conservation and Recovery Act (tracking hazardous waste)) Organizations: FRESNO USD (CONTACT/OWNER)
, FRESNO UNIFIED (SCHOOL DISTRICT)
Alternative names: FRESNO USD MALLOCH ELEM SCHOOL
EQUILON ENTERPRISES (1016 SHAW in FRESNO, CA) . Federal Facility
STATE MASTER (California - Hazardous Waste Tracking) - HAZARDOU WASTE PROGRAM Large Quantity Generators, more that 1000 kg of hazardous waste/month (Resource Conservation and Recovery Act (tracking hazardous waste)) - notification Alternative names: TEXACO SERVICE STATION
EVERGREEN OIL INC FRESNO (4139 NORTH VALENTINE in FRESNO, CA)
STATE MASTER (California - Hazardous Waste Tracking) - HAZARDOU WASTE PROGRAM TRANSPORTER (Resource Conservation and Recovery Act (tracking hazardous waste)) - notification USED OIL PROGRAM (Resource Conservation and Recovery Act (tracking hazardous waste)) Organizations: DON BERGEN (CONTACT/OWNER)
Alternative names: EVERGREEN ENVIRONMENTAL SVCS - FRESNO
GIBSON ELEMENTARY (1266 W. BARSTOW AVE. in FRESNO, CA)
(National Center for Education Statistics) - STATE ID-6006266 Small Quantity Generators, between 100 kg and 1000 kg of hazardous waste/month (Resource Conservation and Recovery Act (tracking hazardous waste)) - notification Organizations: FRESNO UNIF SCHOOL DIST (CONTACT/OWNER)
, FRESNO UNIFIED (SCHOOL DISTRICT)
Alternative names: FRESNO USD GIBSON ELEM
LAMOURES CLNR (3140 W SHAW in FRESNO, CA)
STATE MASTER (California - Hazardous Waste Tracking) - HAZARDOU WASTE PROGRAM CRITERIA AND HAZARDOUS AIR POLLUTANT INVENTORY (Inventory of air pollution sources) Small Quantity Generators, between 100 kg and 1000 kg of hazardous waste/month (Resource Conservation and Recovery Act (tracking hazardous waste)) - notification Business SIC classification: DRYCLEANING PLANTS, EXCEPT RUG CLEANING Organizations: LAMOURES INC (CONTACT/OWNER)
CHEVRON STATION NO 94285 (2017 W SHAW AVE in FRESNO, CA)
STATE MASTER (California - Hazardous Waste Tracking) - HAZARDOU WASTE PROGRAM CRITERIA AND HAZARDOUS AIR POLLUTANT INVENTORY (Inventory of air pollution sources) Small Quantity Generators, between 100 kg and 1000 kg of hazardous waste/month (Resource Conservation and Recovery Act (tracking hazardous waste)) - notification Business SIC classification: GASOLINE SERVICE STATIONS Organizations: CHEVRON PRODUCTS CO (CONTACT/OWNER)
CALIFORNIA AUTO RESTORATION (4609 N BENDEL in FRESNO, CA)
STATE MASTER (California - Hazardous Waste Tracking) - HAZARDOU WASTE PROGRAM Small Quantity Generators, between 100 kg and 1000 kg of hazardous waste/month (Resource Conservation and Recovery Act (tracking hazardous waste)) - notification Business NAICS classification: AUTOMOTIVE BODY, PAINT, AND INTERIOR REPAIR AND MAINTENANCE. Organizations: STEVE HARRELL (CONTACT/OWNER)
FORKNER ELEMENTARY (7120 N. VALENTINE in FRESNO, CA)
(National Center for Education Statistics) - STATE ID-6101109 Organizations: FRESNO UNIFIED (SCHOOL DISTRICT)
FRESNO CHROME PLATING INC (4627 N BENDEL AVE in FRESNO, CA)
SUPERFUND (Superfund database) Large Quantity Generators, more that 1000 kg of hazardous waste/month (Resource Conservation and Recovery Act (tracking hazardous waste)) Business NAICS classification: ELECTROPLATING, PLATING, POLISHING, ANODIZING, AND COLORING.
JMS ENTERPRISES DBA MASTER CRAFT (1731 W BULLARD in FRESNO, CA)
Small Quantity Generators, between 100 kg and 1000 kg of hazardous waste/month (Resource Conservation and Recovery Act (tracking hazardous waste)) - notification Small Quantity Generators, between 100 kg and 1000 kg of hazardous waste/month (Resource Conservation and Recovery Act (tracking hazardous waste)) Organizations: STEVE BERGLUND (CONTACT/OWNER)
JONES CLEANING CENTERS (2089 W SHAW in FRESNO, CA)
CRITERIA AND HAZARDOUS AIR POLLUTANT INVENTORY (Inventory of air pollution sources) Small Quantity Generators, between 100 kg and 1000 kg of hazardous waste/month (Resource Conservation and Recovery Act (tracking hazardous waste)) - notification Business SIC classification: DRYCLEANING PLANTS, EXCEPT RUG CLEANING Organizations: ROBIN KRAEMER (CONTACT/OWNER)
AMERICAN ENGINEERING (5320 N BARCUS in FRESNO, CA)
Small Quantity Generators, between 100 kg and 1000 kg of hazardous waste/month (Resource Conservation and Recovery Act (tracking hazardous waste)) - notification Organizations: HERSHELL SCHELLTON (CONTACT/OWNER)
APPL INC (4167 N MOTEL #102 in FRESNO, CA)
Small Quantity Generators, between 100 kg and 1000 kg of hazardous waste/month (Resource Conservation and Recovery Act (tracking hazardous waste)) - notification Organizations: BRADFORD A ANDERSON (CONTACT/OWNER)
Housing units lacking complete plumbing facilities: 0.3% Housing units lacking complete kitchen facilities: 1.0%
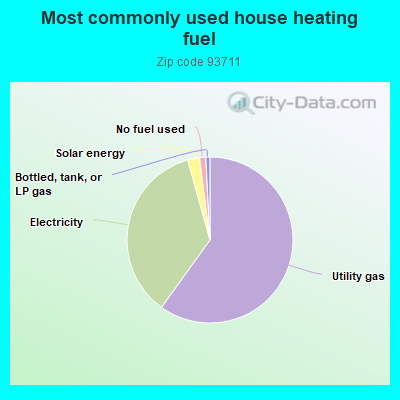
59.7%Utility gas
35.6%Electricity
2.3%Solar energy
1.2%No fuel used
0.8%Bottled, tank, or LP gas
Population in 1990: 29,809. Population change in the 1990s: +6,460 (+21.7%).
Place of birth for U.S.-born residents:
This state: 28,567
Northeast: 989
Midwest: 1,283
South: 1,515
West: 1,313
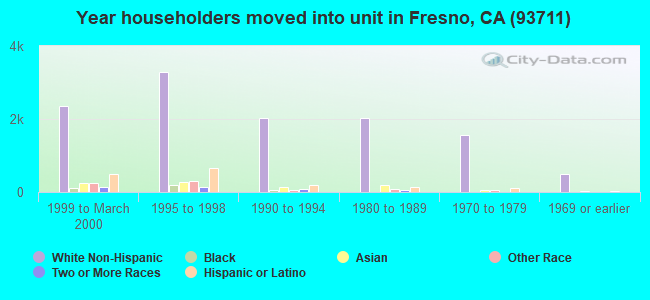
53% of the 93711 zip code residents lived in the same house 5 years ago. Out of people who lived in different houses, 70% lived in this county. Out of people who lived in different counties, 50% lived in California.
89% of the 93711 zip code residents lived in the same house 1 year ago. Out of people who lived in different houses, 61% moved from this county. Out of people who lived in different houses, 26% moved from different county within same state. Out of people who lived in different houses, 3% moved from different state. Out of people who lived in different houses, 9% moved from abroad.
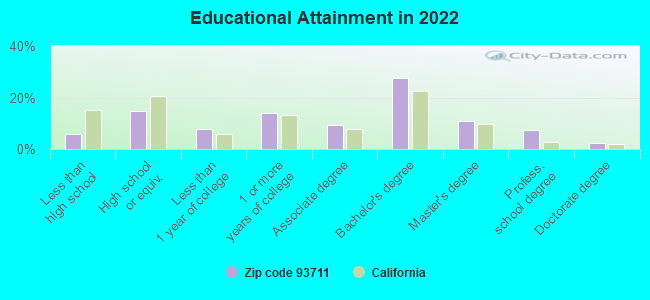
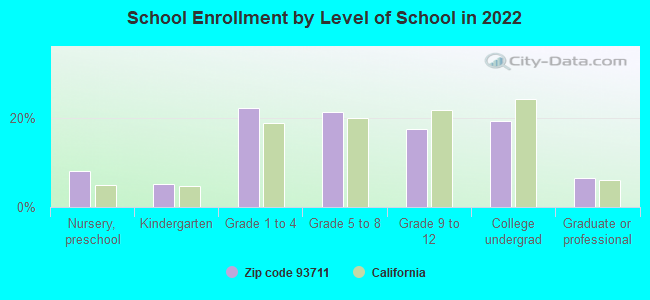
Private vs. public school enrollment:
Students in private schools in grades 1 to 8 (elementary and middle school): 709
Here:
17.8%
California:
10.5%
Students in private schools in grades 9 to 12 (high school): 86
Here:
5.4%
California:
8.5%
Students in private undergraduate colleges: 237
Here:
13.5%
California:
15.9%
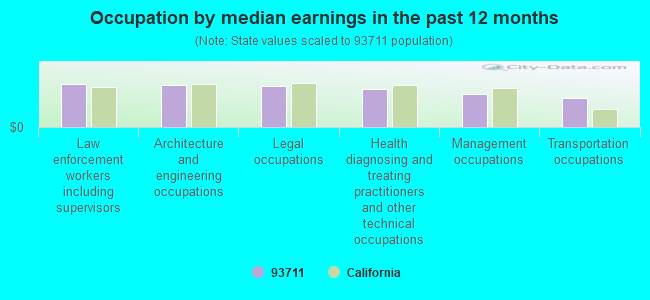
Occupation by median earnings in the past 12 months ($)
112,166Law enforcement workers including supervisors
110,208Architecture and engineering occupations
108,894Legal occupations
98,680Health diagnosing and treating practitioners and other technical occupations
86,451Management occupations
76,892Transportation occupations
Companies with federal contracts located in this zip code (FRESNO, CA):
CABLE LINKS CONSULTING (1690 W SHAW STE 103; small business) : $424,241 in 10 contractsfrom 2003 to 2006
Contracts for Other Education and Training Services, Fiber Optic Cable Assemblies and Harnesses by Navy Signed by year:2000: $0; 2001: $0; 2002: $0; 2003: $113,914; 2004: $0; 2005: $244,757; 2006: $65,570.
Biggest contracts:
$172,080 with Navy for Other Education and Training Services. Signed on 2005-01-13. Completion date: 2005-02-12.
$66,849 with Navy for Fiber Optic Cable Assemblies and Harnesses. Signed on 2003-09-15. Completion date: 2003-12-19.
$65,570 with Navy for Other Education and Training Services. Signed on 2006-02-02. Completion date: 2006-02-05.
$47,065 with Navy for Fiber Optic Cable Assemblies and Harnesses. Signed on 2003-09-26. Completion date: 2004-01-30.
PETERS MAINTENANCE (3169 W ALLUVIAL AVE; small business) : $21,072 in 2 contractsfrom 2003 to 2004
$20,209 with Army for Custodial Janitorial Services. Signed on 2003-10-09. Completion date: 2004-09-12.
$863, same as above.Signed on 2004-07-31. Completion date: 2004-09-12.
FAT DAWG 7 BROADCASTING LLC (351 W CROMWELL AVE STE 108; small business)
$20,000 with Army for Advertising Services. Signed on 2005-09-16. Completion date: 2006-09-15.
VISUAL CHECK INTERNATIONAL (1346 W ALLUVIAL AVE; small business)
$4,842 with Army for Other Defense -- Operational Systems Development (R&D). Signed on 2006-05-16. Completion date: 2006-05-23.
ART PICADILLY HOTEL CORP INC (2305 W SHAW AVE; small business) : $4,248 in 2 contractsin 2004
$2,242 with Army for Lodging - Hotel/Motel. Signed on 2004-11-24. Completion date: 2004-11-07.
$2,006, same as above.Signed on 2004-11-24. Completion date: 2004-11-07.
Top industries in this zip code by the number of employees in 2005:
Administrative and Support and Waste Management and Remediation Services: Temporary Help Services (250-499: 1, 100-249: 3, 50-99: 2, 10-19: 1, 5-9: 1, 1-4: 1)
2004 - 2018 National Fire Incident Reporting System (NFIRS) incidents
Based on the data from the years 2004 - 2018 the average number of fires per year is 46. The highest number of fire incidents - 95 took place in 2004, and the least - 0 in 2011. The data has a declining trend.
When looking into fire subcategories, the most reports belonged to: Outside Fires (46.1%), and Structure Fires (35.3%).
Fire incident types reported to NFIRS in Zip Code 93711


+$3,335
-$7,562
(% of AGI for various income ranges: -0.0% for AGIs $25k-50k, 0.2% for AGIs $50k-75k, 0.1% for AGIs $75k-100k, 0.2% for AGIs over 100k) Nearest zip codes: 93650, 93704, 93705, 93722, 93710, 93720.
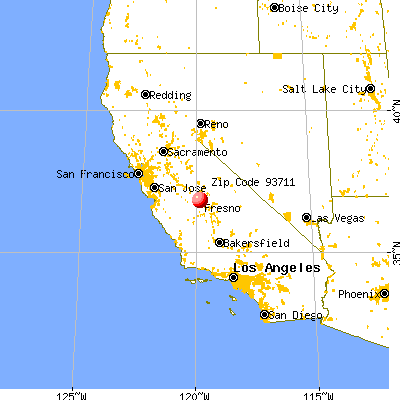
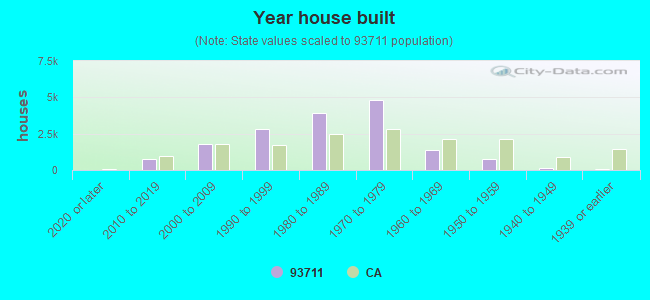


 Based on the data from the years 2004 - 2018 the average number of fires per year is 46. The highest number of fire incidents - 95 took place in 2004, and the least - 0 in 2011. The data has a declining trend.
 When looking into fire subcategories, the most reports belonged to: Outside Fires (46.1%), and Structure Fires (35.3%).