Estimated zip code population in 2022: 29,257 Zip code population in 2010: 27,156 Zip code population in 2000: 26,565
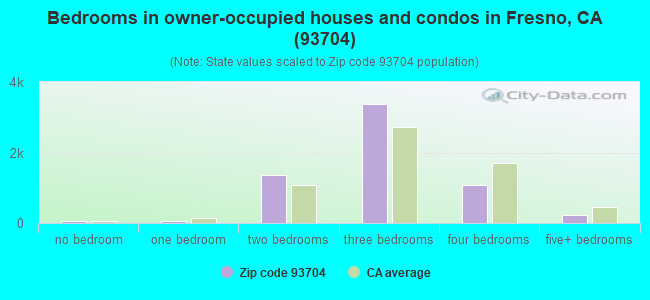
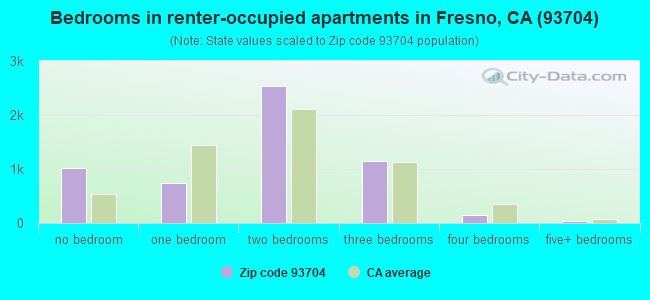
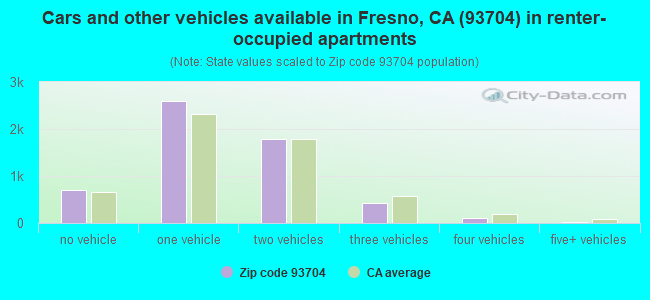
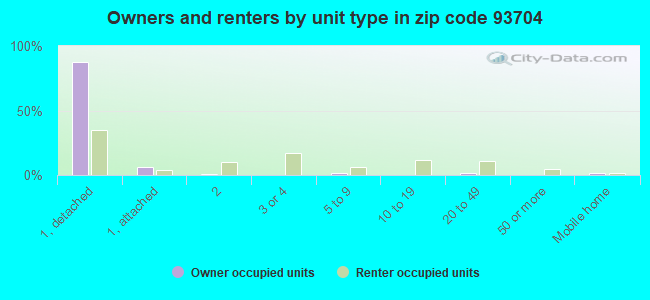
Houses and condos: 12,200 Renter-occupied apartments: 5,598
% of renters here:
47%
State:
44%
March 2022 cost of living index in zip code 93704: 96.3 (near average, U.S. average is 100)
Land area: 5.5 sq. mi. Water area: 0.0 sq. mi.
Population density: 5,338 people per square mile
(average).
OSM Map
General Map
Google Map
MSN Map
OSM Map
General Map
Google Map
MSN Map
OSM Map
General Map
Google Map
MSN Map
OSM Map
General Map
Google Map
MSN Map
Please wait while loading the map...
Real estate property taxes paid for housing units in 2022:
This zip code:
0.7% ($2,588)
California:
0.7% ($4,831)
Median real estate property taxes paid for housing units with mortgages in 2022: $2,915 (0.7%) Median real estate property taxes paid for housing units with no mortgage in 2022: $1,883 (0.6%)
Averages for the 2020 tax year for zip code 93704, filed in 2021:
Average Adjusted Gross Income (AGI) in 2020: $63,038 (Individual Income Tax Returns)
Here:
$63,038
State:
$95,910
Salary/wage: $51,360 (reported on 79.9% of returns)
Here:
$51,360
State:
$77,331
(% of AGI for various income ranges: 1225.0% for AGIs below $25k, 3863.2% for AGIs $25k-50k, 6944.9% for AGIs $50k-75k, 10648.7% for AGIs $75k-100k, 19321.4% for AGIs $100k-200k, 94910.0% for AGIs over 200k)
Taxable interest for individuals: $1,789 (reported on 31.9% of returns)
This zip code:
$1,789
California:
$2,294
(% of AGI for various income ranges: 11.1% for AGIs below $25k, 12.8% for AGIs $25k-50k, 31.2% for AGIs $50k-75k, 79.3% for AGIs $75k-100k, 161.7% for AGIs $100k-200k, 4396.4% for AGIs over 200k)
Ordinary dividends: $10,693 (reported on 14.4% of returns)
Here:
$10,693
State:
$10,949
(% of AGI for various income ranges: 18.9% for AGIs below $25k, 29.2% for AGIs $25k-50k, 72.1% for AGIs $50k-75k, 210.6% for AGIs $75k-100k, 487.9% for AGIs $100k-200k, 12103.6% for AGIs over 200k)
Net capital gain/loss in AGI: +$14,772 (reported on 13.9% of returns)
Here:
+$14,772
State:
+$49,306
(% of AGI for various income ranges: 6.9% for AGIs below $25k, 24.3% for AGIs $25k-50k, 66.4% for AGIs $50k-75k, 183.0% for AGIs $75k-100k, 717.7% for AGIs $100k-200k, 17623.6% for AGIs over 200k)
Profit/loss from business: +$16,928 (reported on 16.3% of returns)
Here:
+$16,928
State:
+$15,671
(% of AGI for various income ranges: 157.7% for AGIs below $25k, 160.6% for AGIs $25k-50k, 190.1% for AGIs $50k-75k, 465.1% for AGIs $75k-100k, 1012.3% for AGIs $100k-200k, 13536.4% for AGIs over 200k)
Taxable individual retirement arrangement distribution: $16,007 (reported on 6.8% of returns)
93704:
$16,007
California:
$23,505
(% of AGI for various income ranges: 30.3% for AGIs below $25k, 58.6% for AGIs $25k-50k, 129.8% for AGIs $50k-75k, 324.8% for AGIs $75k-100k, 812.5% for AGIs $100k-200k, 2143.6% for AGIs over 200k)
Self-employed (Keogh) retirement plans: $19,050 (reported on 0.6% of returns)
93704:
$19,050
California:
$30,163
(% of AGI for various income ranges: 6.9% for AGIs below $25k, 69.3% for AGIs $100k-200k, 748.2% for AGIs over 200k)
Total itemized deductions: $30,628 (reported on 10.3% of returns)
Here:
$30,628
State:
$39,517
(% of AGI for various income ranges: 43.4% for AGIs below $25k, 127.5% for AGIs $25k-50k, 378.4% for AGIs $50k-75k, 928.8% for AGIs $75k-100k, 1709.9% for AGIs $100k-200k, 12479.1% for AGIs over 200k)
Charity contributions: $9,590 (reported on 8.2% of returns)
Here:
$9,590
State:
$12,598
(% of AGI for various income ranges: 2.5% for AGIs below $25k, 17.3% for AGIs $25k-50k, 46.7% for AGIs $50k-75k, 140.9% for AGIs $75k-100k, 400.4% for AGIs $100k-200k, 4989.1% for AGIs over 200k)
Taxes paid: $7,621 (reported on 10.3% of returns)
93704:
$7,621
State:
$8,807
(% of AGI for various income ranges: 8.5% for AGIs below $25k, 20.4% for AGIs $25k-50k, 98.7% for AGIs $50k-75k, 286.2% for AGIs $75k-100k, 530.6% for AGIs $100k-200k, 2372.7% for AGIs over 200k)
Earned income credit: $2,232 (reported on 19.5% of returns)
Here:
$2,232
State:
$2,074
(% of AGI for various income ranges: 120.3% for AGIs below $25k, 78.5% for AGIs $25k-50k, 1.2% for AGIs $50k-75k)
Percentage of individuals using paid preparers for their 2020 taxes: 92.2%
Here:
92%
State:
92%
(% for various income ranges: 91.2% for AGIs below $25k, 92.6% for AGIs $25k-50k, 91.6% for AGIs $50k-75k, 92.5% for AGIs $75k-100k, 93.5% for AGIs $100k-200k, 96.0% for AGIs over 200k)
Averages for the 2012 tax year for zip code 93704, filed in 2013:
Average Adjusted Gross Income (AGI) in 2012: $58,111 (Individual Income Tax Returns)
Here:
$58,111
State:
$72,726
Salary/wage: $43,088 (reported on 79.2% of returns)
Here:
$43,088
State:
$59,079
(% of AGI for various income ranges: 70.0% for AGIs below $25k, 78.5% for AGIs $25k-50k, 72.8% for AGIs $50k-75k, 65.7% for AGIs $75k-100k, 63.4% for AGIs $100k-200k, 30.3% for AGIs over 200k)
Taxable interest for individuals: $1,765 (reported on 34.7% of returns)
This zip code:
$1,765
California:
$2,146
(% of AGI for various income ranges: 1.0% for AGIs below $25k, 0.6% for AGIs $25k-50k, 0.8% for AGIs $50k-75k, 0.6% for AGIs $75k-100k, 1.1% for AGIs $100k-200k, 1.6% for AGIs over 200k)
Ordinary dividends: $10,092 (reported on 18.0% of returns)
Here:
$10,092
State:
$9,308
(% of AGI for various income ranges: 2.9% for AGIs below $25k, 1.4% for AGIs $25k-50k, 1.5% for AGIs $50k-75k, 1.8% for AGIs $75k-100k, 2.5% for AGIs $100k-200k, 6.0% for AGIs over 200k)
Net capital gain/loss in AGI: +$11,240 (reported on 15.3% of returns)
Here:
+$11,240
State:
+$30,460
(% of AGI for various income ranges: 0.2% for AGIs $25k-50k, 0.4% for AGIs $50k-75k, 0.3% for AGIs $75k-100k, 1.3% for AGIs $100k-200k, 9.2% for AGIs over 200k)
Profit/loss from business: +$16,986 (reported on 16.3% of returns)
Here:
+$16,986
State:
+$17,064
(% of AGI for various income ranges: 10.6% for AGIs below $25k, 3.5% for AGIs $25k-50k, 3.2% for AGIs $50k-75k, 2.9% for AGIs $75k-100k, 6.4% for AGIs $100k-200k, 3.9% for AGIs over 200k)
Taxable individual retirement arrangement distribution: $13,651 (reported on 8.9% of returns)
93704:
$13,651
California:
$19,557
(% of AGI for various income ranges: 2.1% for AGIs below $25k, 1.9% for AGIs $25k-50k, 2.0% for AGIs $50k-75k, 2.6% for AGIs $75k-100k, 3.0% for AGIs $100k-200k, 1.4% for AGIs over 200k)
Self-employment retirement plans: $17,730 (reported on 0.8% of returns)
93704:
$17,730
California:
$24,530
(% of AGI for various income ranges: 0.3% for AGIs $50k-75k, 0.5% for AGIs $100k-200k, 0.4% for AGIs over 200k)
Total itemized deductions: $26,403 (21% of AGI, reported on 30.9% of returns)
Here:
$26,403
State:
$34,004
Here:
21.4% of AGI
State:
22.7% of AGI
(% of AGI for various income ranges: 8.7% for AGIs below $25k, 9.1% for AGIs $25k-50k, 13.6% for AGIs $50k-75k, 16.6% for AGIs $75k-100k, 17.3% for AGIs $100k-200k, 15.2% for AGIs over 200k)
Charity contributions: $4,451 (reported on 25.7% of returns)
Here:
$4,451
State:
$4,659
(% of AGI for various income ranges: 0.5% for AGIs below $25k, 1.0% for AGIs $25k-50k, 1.6% for AGIs $50k-75k, 2.3% for AGIs $75k-100k, 2.5% for AGIs $100k-200k, 2.7% for AGIs over 200k)
Taxes paid: $10,663 (reported on 30.5% of returns)
93704:
$10,663
State:
$14,448
(% of AGI for various income ranges: 1.5% for AGIs below $25k, 1.9% for AGIs $25k-50k, 3.6% for AGIs $50k-75k, 5.4% for AGIs $75k-100k, 6.7% for AGIs $100k-200k, 9.4% for AGIs over 200k)
Earned income credit: $2,371 (reported on 23.6% of returns)
Here:
$2,371
State:
$2,286
(% of AGI for various income ranges: 8.2% for AGIs below $25k, 1.3% for AGIs $25k-50k)
Percentage of individuals using paid preparers for their 2012 taxes: 55.6%
Here:
56%
State:
64%
(% for various income ranges: 49.7% for AGIs below $25k, 51.0% for AGIs $25k-50k, 59.4% for AGIs $50k-75k, 66.7% for AGIs $75k-100k, 71.6% for AGIs $100k-200k, 89.3% for AGIs over 200k)
Averages for the 2004 tax year for zip code 93704, filed in 2005:
Average Adjusted Gross Income (AGI) in 2004: $50,034 (Individual Income Tax Returns)
Here:
$50,034
State:
$58,600
Salary/wage: $39,044 (reported on 80.8% of returns)
Here:
$39,044
State:
$49,455
(% of AGI for various income ranges: 144.0% for AGIs below $10k, 77.2% for AGIs $10k-25k, 79.1% for AGIs $25k-50k, 73.7% for AGIs $50k-75k, 69.3% for AGIs $75k-100k, 45.2% for AGIs over 100k)
Taxable interest for individuals: $2,249 (reported on 46.6% of returns)
This zip code:
$2,249
California:
$2,365
(% of AGI for various income ranges: 9.4% for AGIs below $10k, 2.1% for AGIs $10k-25k, 1.3% for AGIs $25k-50k, 1.7% for AGIs $50k-75k, 1.6% for AGIs $75k-100k, 2.6% for AGIs over 100k)
Taxable dividends: $4,505 (reported on 24.4% of returns)
Here:
$4,505
State:
$4,746
(% of AGI for various income ranges: 8.7% for AGIs below $10k, 2.0% for AGIs $10k-25k, 1.4% for AGIs $25k-50k, 1.9% for AGIs $50k-75k, 1.4% for AGIs $75k-100k, 2.8% for AGIs over 100k)
Net capital gain/loss: +$12,809 (reported on 21.7% of returns)
Here:
+$12,809
State:
+$23,418
(% of AGI for various income ranges: -0.8% for AGIs below $10k, 0.3% for AGIs $10k-25k, 0.5% for AGIs $25k-50k, 1.2% for AGIs $50k-75k, 2.4% for AGIs $75k-100k, 11.7% for AGIs over 100k)
Profit/loss from business: +$20,536 (reported on 15.7% of returns)
Here:
+$20,536
State:
+$16,826
(% of AGI for various income ranges: 2.1% for AGIs below $10k, 6.5% for AGIs $10k-25k, 4.2% for AGIs $25k-50k, 4.9% for AGIs $50k-75k, 5.8% for AGIs $75k-100k, 8.4% for AGIs over 100k)
Profit/loss from farming: +$16,325 (reported on 0.3% of returns)
Here:
+$16,325
State:
-$7,562
IRA payment deduction: $3,104 (reported on 2.6% of returns)
93704:
$3,104
California:
$3,192
(% of AGI for various income ranges: 0.4% for AGIs below $10k, 0.2% for AGIs $10k-25k, 0.2% for AGIs $25k-50k, 0.2% for AGIs $50k-75k, 0.2% for AGIs $75k-100k, 0.1% for AGIs over 100k)
Self-employed pension: $14,851 (reported on 1.4% of returns)
Here:
$14,851
California:
$17,688
(% of AGI for various income ranges: 0.1% for AGIs $25k-50k, 0.2% for AGIs $50k-75k, 0.4% for AGIs $75k-100k, 0.7% for AGIs over 100k)
Total itemized deductions: $21,020 (22% of AGI, reported on 35.3% of returns)
Here:
$21,020
State:
$28,113
Here:
21.7% of AGI
State:
25.3% of AGI
(% of AGI for various income ranges: 26.3% for AGIs below $10k, 9.4% for AGIs $10k-25k, 11.7% for AGIs $25k-50k, 16.7% for AGIs $50k-75k, 17.7% for AGIs $75k-100k, 15.5% for AGIs over 100k)
Charity contributions deductions: $3,573 (3% of AGI, reported on 31.4% of returns)
Here:
$3,573
State:
$3,923
Here:
3.5% of AGI
State:
3.3% of AGI
(% of AGI for various income ranges: 1.2% for AGIs below $10k, 0.9% for AGIs $10k-25k, 1.3% for AGIs $25k-50k, 2.2% for AGIs $50k-75k, 2.6% for AGIs $75k-100k, 2.9% for AGIs over 100k)
Total tax: $8,896 (reported on 75.8% of returns)
93704:
$8,896
State:
$10,761
(% of AGI for various income ranges: 5.0% for AGIs below $10k, 4.2% for AGIs $10k-25k, 7.4% for AGIs $25k-50k, 10.1% for AGIs $50k-75k, 11.8% for AGIs $75k-100k, 20.1% for AGIs over 100k)
Earned income credit: $1,714 (reported on 18.2% of returns)
Here:
$1,714
State:
$1,763
Percentage of individuals using paid preparers for their 2004 taxes: 61.4%
Here:
61%
State:
66%
(% for various income ranges: 54.3% for AGIs below $10k, 57.9% for AGIs $10k-25k, 57.7% for AGIs $25k-50k, 66.6% for AGIs $50k-75k, 69.3% for AGIs $75k-100k, 81.1% for AGIs over 100k)
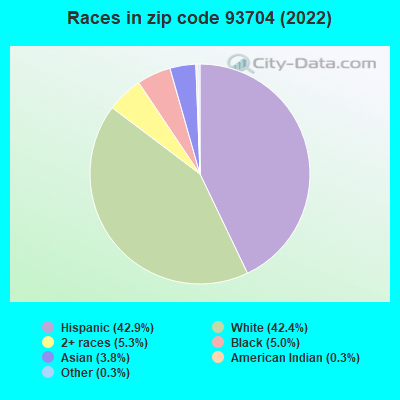
Likely homosexual households (counted as self-reported same-sex unmarried-partner households)
Lesbian couples: 0.2% of all households
Gay men: 0.3% of all households
Household received Food Stamps/SNAP in the past 12 months: 2,278 Household did not receive Food Stamps/SNAP in the past 12 months: 9,701
Women who had a birth in the past 12 months: 562 (348 now married, 215 unmarried) Women who did not have a birth in the past 12 months: 6,312 (2,633 now married, 3,672 unmarried)
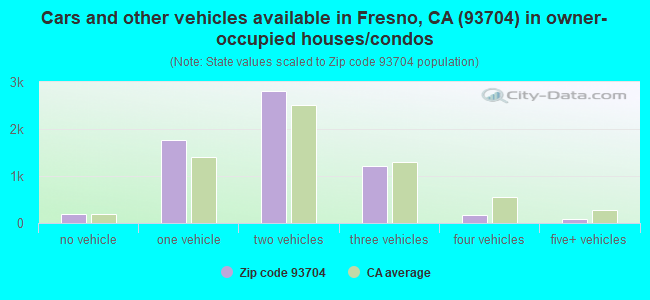
Housing units in zip code 93704 with a mortgage: 4,053 (329 second mortgage, 223 both second mortgage and home equity loan) Houses without a mortgage: 82
Median monthly owner costs for units with a mortgage: $1,887 Median monthly owner costs for units without a mortgage: $579
Residents with income below the poverty level in 2022:
This zip code:
19.6%
Whole state:
12.2%
Residents with income below 50% of the poverty level in 2022:
This zip code:
8.3%
Whole state:
6.2%
Median number of rooms in houses and condos:
Here:
6.4
State:
6.0
Median number of rooms in apartments:
Here:
4.1
State:
3.9
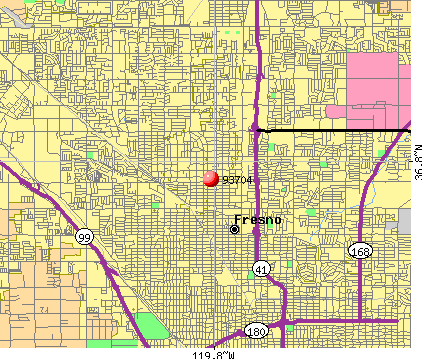
Notable locations in this zip code not listed on our city pages
Shopping Centers: Shaw City Shopping Center (1), Northgate Shopping Center (2), Best Plaza Shopping Center (3), Figarden Shopping Center (4). Display/hide their locations on the map
Churches in zip code 93704 include: Calvary Church of the Nazarene (A), First Congregational Church (B), Plymouth Congregational Church (C), Presbyterian Refuge Resettlement Ministries (D), Redeemer Lutheran Church (E), Saint Anthony of Padua Roman Catholic Church (F), Saint Columbas Episcopal Church (G), Saint Lukes United Methodist Church (H), Second Church of Christ Scientist (I). Display/hide their locations on the map
In group quarters: 250 (-1 institutionalized population)
Size of family households: 2,811 2-persons, 1,800 3-persons, 1,523 4-persons, 484 5-persons, 216 6-persons, 191 7-or-more-persons
Size of nonfamily households: 3,886 1-person, 748 2-persons, 192 3-persons
3,786 married couples with children.
3,156 single-parent households (629 men, 2,527 women).
77.3% of residents of 93704 zip code speak English at home.
17.9% of residents speak Spanish at home (68% very well, 11% well, 17% not well, 4% not at all).
2.0% of residents speak other Indo-European language at home (89% very well, 11% well).
2.3% of residents speak Asian or Pacific Island language at home (65% very well, 17% well, 17% not well).
0.2% of residents speak other language at home (30% very well, 63% well, 7% not at all).
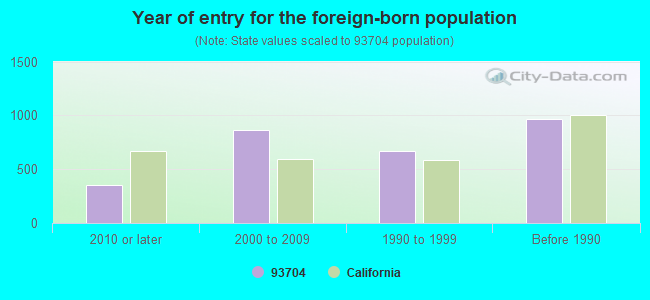
Foreign born population: 2,654 (9.1%) (55.4% of them are naturalized citizens)
Major facilities with environmental interests located in this zip code:
MICHAEL TOYOTA (50 W BULLARD AVE in FRESNO, CA)
STATE MASTER (California - Hazardous Waste Tracking) - HAZARDOU WASTE PROGRAM Small Quantity Generators, between 100 kg and 1000 kg of hazardous waste/month (Resource Conservation and Recovery Act (tracking hazardous waste)) - notification STATE MASTER (California - Used Oil Recycling System ) - USED OIL RECYCLING Organizations: MICHAEL MITSUBISHI (CONTACT/OWNER)
Alternative names: MICHAEL MITSUBISHI
KRATT ELEMENTARY (650 W. SIERRA AVE. in FRESNO, CA)
(National Center for Education Statistics) - STATE ID-6006332 Small Quantity Generators, between 100 kg and 1000 kg of hazardous waste/month (Resource Conservation and Recovery Act (tracking hazardous waste)) - notification Organizations: FRESNO UNIF SCHOOL DIST (CONTACT/OWNER)
, FRESNO UNIFIED (SCHOOL DISTRICT)
Alternative names: FRESNO USD KRATT ELEM
FORT MILLER PREPARATORY MIDDLE (1302 E. DAKOTA AVE. in FRESNO, CA)
(National Center for Education Statistics) - STATE ID-6057293 Organizations: FRESNO UNIFIED (SCHOOL DISTRICT)
FRESNO HIGH (1839 ECHO AVE. in FRESNO, CA)
(National Center for Education Statistics) - STATE ID-1032507 Organizations: FRESNO UNIFIED (SCHOOL DISTRICT)
HAMILTON ELEMENTARY (102 E. CLINTON in FRESNO, CA)
(National Center for Education Statistics) - STATE ID-6120125 Organizations: FRESNO UNIFIED (SCHOOL DISTRICT)
BAIRD MIDDLE (5500 N. MAROA AVE. in FRESNO, CA)
(National Center for Education Statistics) - STATE ID-6006084 Organizations: FRESNO UNIFIED (SCHOOL DISTRICT)
NEXTEL 11 (6771 NORTH PALM AVENUE in FRESNO, CA)
(Integrated Compliance Information System) - ICIS-HQ-2002-6001, FORMAL ENFORCEMENT ACTION
FRESNO USD BULLARD TALENT ELEM SCH (4950 N HARRISON AVE in FRESNO, CA)
(Resource Conservation and Recovery Act (tracking hazardous waste)) Alternative names: BULLARD TALENT PROJECT
HESTER OWENS ESTATE (1611 E GETTYSBURG AVE in FRESNO, CA)
Large Quantity Generators, more that 1000 kg of hazardous waste/month (Resource Conservation and Recovery Act (tracking hazardous waste)) - notification Organizations: HESTER OWENS C/O WELLS FARGO (CONTACT/OWNER)
FRESNO USD BAIRD ELEM (5500 N MAROA in FRESNO, CA)
Small Quantity Generators, between 100 kg and 1000 kg of hazardous waste/month (Resource Conservation and Recovery Act (tracking hazardous waste)) - notification Organizations: FRESNO UNIF SCHOOL DIST (CONTACT/OWNER)
HOLIDAY CLEANERS (5128 NORTH PALM in FRESNO, CA)
Small Quantity Generators, between 100 kg and 1000 kg of hazardous waste/month (Resource Conservation and Recovery Act (tracking hazardous waste)) Organizations: WILLIAM WOODS (CONTACT/OWNER)
LAMOURES INC (2024 N VAN NESS in FRESNO, CA)
Small Quantity Generators, between 100 kg and 1000 kg of hazardous waste/month (Resource Conservation and Recovery Act (tracking hazardous waste)) - notification Organizations: JEAN B LAMOURE (CONTACT/OWNER)
7-ELEVEN, INC (2515 E MCKINLEY in FRESNO, CA)
CRITERIA AND HAZARDOUS AIR POLLUTANT INVENTORY (Inventory of air pollution sources) Business SIC classification: GASOLINE SERVICE STATIONS
Housing units lacking complete plumbing facilities: 0.1% Housing units lacking complete kitchen facilities: 0.4%
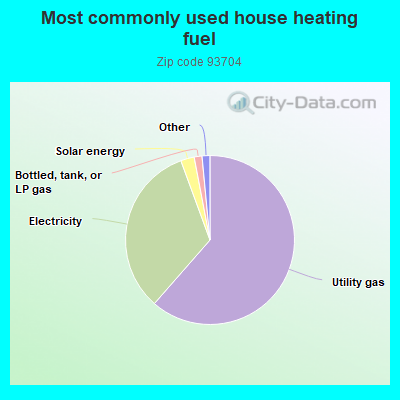
61.5%Utility gas
33.0%Electricity
2.6%Solar energy
1.5%Bottled, tank, or LP gas
Population in 1990: 26,496. Population change in the 1990s: +69 (+0.3%).
Place of birth for U.S.-born residents:
This state: 22,913
Northeast: 382
Midwest: 888
South: 924
West: 1,247
51% of the 93704 zip code residents lived in the same house 5 years ago. Out of people who lived in different houses, 77% lived in this county. Out of people who lived in different counties, 50% lived in California.
89% of the 93704 zip code residents lived in the same house 1 year ago. Out of people who lived in different houses, 77% moved from this county. Out of people who lived in different houses, 12% moved from different county within same state. Out of people who lived in different houses, 7% moved from different state. Out of people who lived in different houses, 0% moved from abroad.
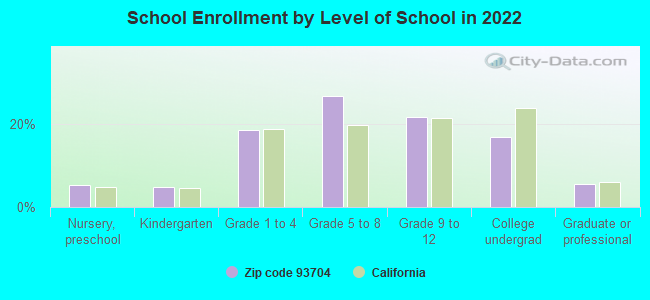
Private vs. public school enrollment:
Students in private schools in grades 1 to 8 (elementary and middle school): 308
Here:
8.9%
California:
10.5%
Students in private schools in grades 9 to 12 (high school): 203
Here:
12.2%
California:
8.5%
Students in private undergraduate colleges: 144
Here:
11.1%
California:
15.9%
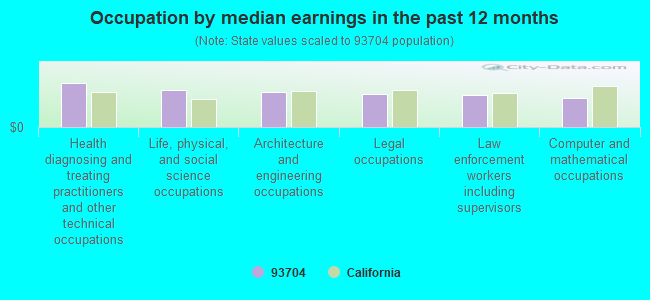
Occupation by median earnings in the past 12 months ($)
114,336Health diagnosing and treating practitioners and other technical occupations
96,074Life, physical, and social science occupations
91,877Architecture and engineering occupations
85,706Legal occupations
83,559Law enforcement workers including supervisors
74,476Computer and mathematical occupations
Companies with federal contracts located in this zip code (FRESNO, CA):
MOONLITE CATERING (333 WEST BULLARD AVE #103; small business)
$28,476 with Army for Miscellaneous Items. Signed on 2004-02-21. Completion date: 2004-03-07.
ARGUETA, EDWIN (3534 N GLENN AVE)
$19,500 with Navy for Landscaping/Groundskeeping Services. Signed on 2005-09-27. Completion date: 2006-09-29.
FEDERICO CONSULTING INC (333 W SHAW AVE STE 104; small business)
$13,967 with Army for ADP Central Processing Unit (CPU, Computer), Analog. Signed on 2005-09-15. Completion date: 2005-09-30.
BSK ASSOCIATES (567 W SHAW AVE #C-1; small business) : $7,093 in 6 contractsfrom 2005 to 2006
Contracts for Hardware, Commercial, Waste Treatment and Storage by Navy, Army Signed by year:2000: $0; 2001: $0; 2002: $0; 2003: $0; 2004: $0; 2005: $297; 2006: $6,796.
Biggest contracts:
$4,000 with Navy for Hardware, Commercial. Signed on 2006-01-11. Completion date: 2006-02-10.
$2,757 with Army for Waste Treatment and Storage. Signed on 2006-03-21. Completion date: 2006-09-30.
$739, same as above.Signed on 2006-01-18. Completion date: 2006-09-30.
$297, same as above.Signed on 2005-12-06. Completion date: 2006-09-30.
Top industries in this zip code by the number of employees in 2005:
Administrative and Support and Waste Management and Remediation Services: Temporary Help Services (250-499 employees: 1 establishment, 100-249 employees: 1 establishment, 50-99 employees: 3 establishments, 20-49 employees: 3 establishments, 5-9 employees: 1 establishment, 1-4 employees: 3 establishments)
Professional, Scientific, and Technical Services: Offices of Lawyers (100-249: 1, 50-99: 2, 20-49: 2, 10-19: 6, 5-9: 9, 1-4: 34)
2004 - 2018 National Fire Incident Reporting System (NFIRS) incidents
According to the data from the years 2004 - 2018 the average number of fire incidents per year is 49. The highest number of fires - 99 took place in 2018, and the least - 0 in 2011. The data has a rising trend.
When looking into fire subcategories, the most reports belonged to: Outside Fires (46.9%), and Structure Fires (36.0%).
Fire incident types reported to NFIRS in Zip Code 93704


+$16,325
-$7,562
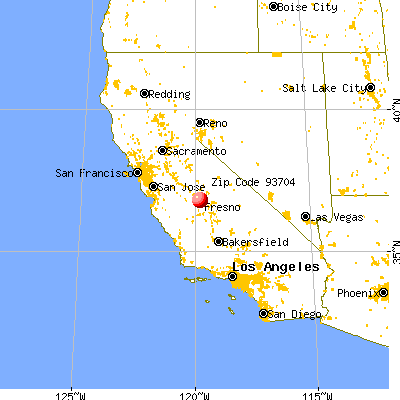
 Nearest zip codes: 93705, 93726, 93650, 93728, 93711, 93710.
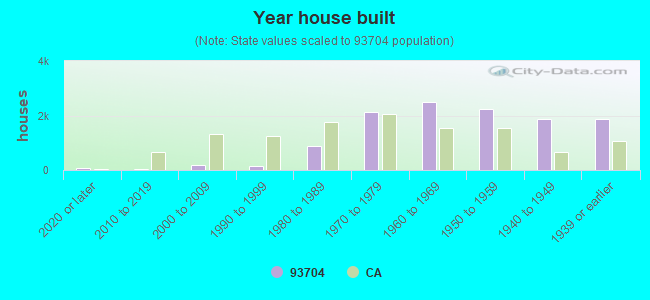


 According to the data from the years 2004 - 2018 the average number of fire incidents per year is 49. The highest number of fires - 99 took place in 2018, and the least - 0 in 2011. The data has a rising trend.
 When looking into fire subcategories, the most reports belonged to: Outside Fires (46.9%), and Structure Fires (36.0%).