Estimated zip code population in 2022: 8,866 Zip code population in 2010: 8,726 Zip code population in 2000: 9,019
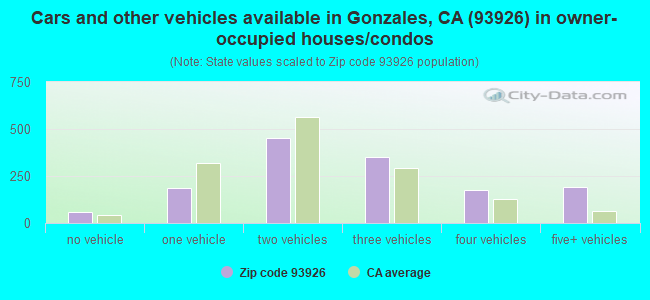
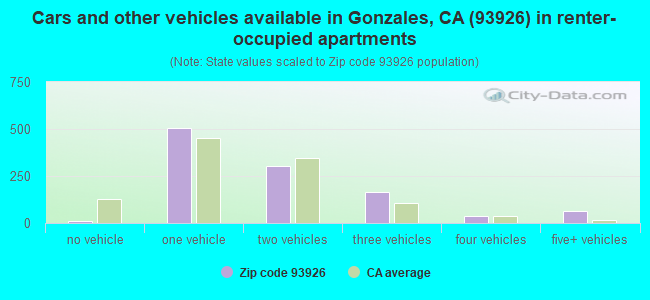
Houses and condos: 2,552 Renter-occupied apartments: 1,077
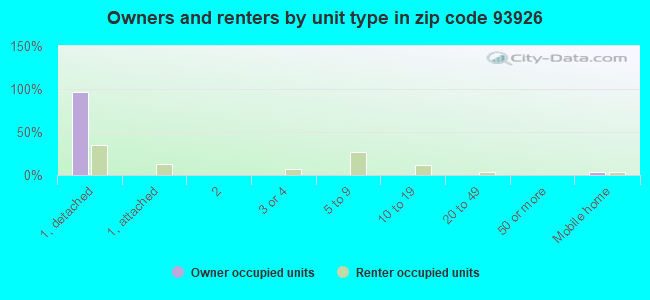
% of renters here:
43%
State:
44%
March 2022 cost of living index in zip code 93926: 106.1 (more than average, U.S. average is 100)
Land area: 59.2 sq. mi. Water area: 0.1 sq. mi.
Population density: 150 people per square mile
(very low).
OSM Map
General Map
Google Map
MSN Map
OSM Map
General Map
Google Map
MSN Map
OSM Map
General Map
Google Map
MSN Map
OSM Map
General Map
Google Map
MSN Map
Please wait while loading the map...
Real estate property taxes paid for housing units in 2022:
This zip code:
0.6% ($3,479)
California:
0.7% ($4,831)
Median real estate property taxes paid for housing units with mortgages in 2022: $3,490 (0.5%) Median real estate property taxes paid for housing units with no mortgage in 2022: $3,578 (0.7%)
Business Search- 14 Million verified businesses
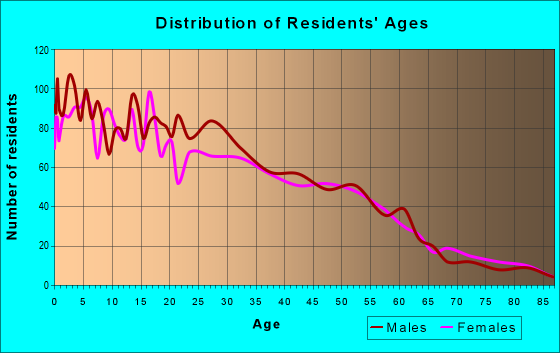
Males: 4,211
(47.5%)
Females: 4,655
(52.5%)
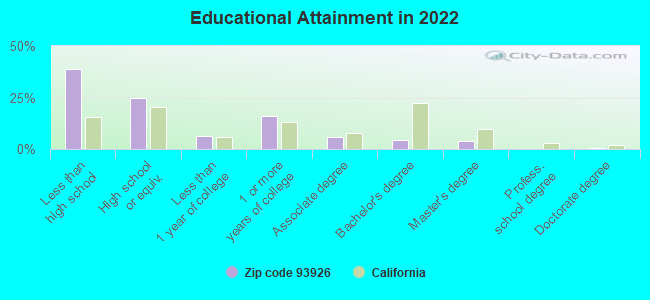
For population 25 years and over in 93926:
High school or higher: 59.8%
Bachelor's degree or higher: 8.5%
Graduate or professional degree: 4.3%
Unemployed: 4.0%
Mean travel time to work (commute): 24.0 minutes
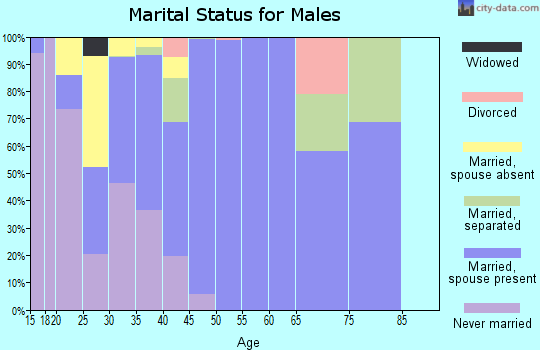
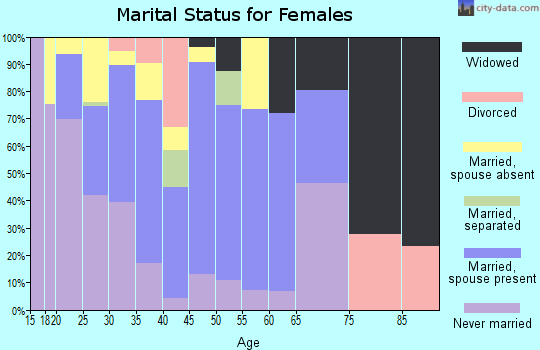
For population 15 years and over in 93926:
Never married: 40.7%
Now married: 49.0%
Separated: 1.3%
Widowed: 4.2%
Divorced: 4.7%
Zip code 93926 compared to state average:
Black race population percentage significantly below state average.
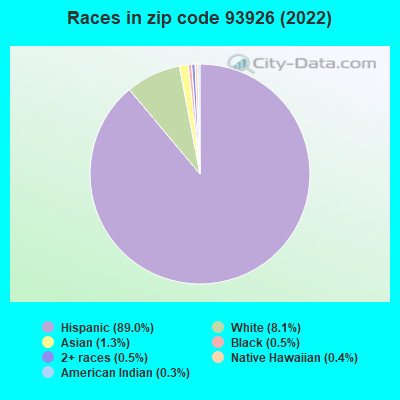
Hispanic race population percentage above state average.
Median age below state average.
Length of stay since moving in significantly above state average.
Percentage of population with a bachelor's degree or higher significantly below state average.
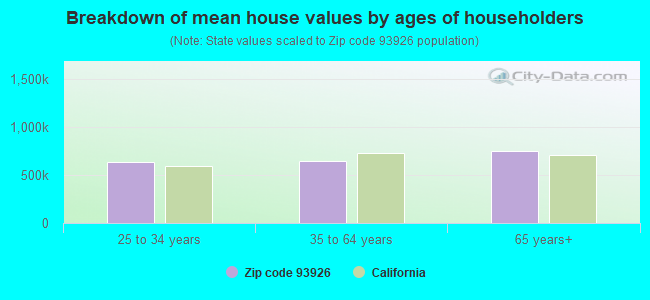
Estimated median house/condo value in 2022: $630,118
93926:
$630,118
California:
$715,900
According to our research of California and other state lists, there were 13 registered sex offenders living in 93926 zip code as of April 25, 2024. The ratio of all residents to sex offenders in zip code 93926 is 742 to 1. The ratio of registered sex offenders to all residents in this zip code is near the state average.
Median resident age:
This zip code:
30.5 years
California median age:
37.9 years
Average household size:
This zip code:
3.6 people
California:
2.8 people
Averages for the 2020 tax year for zip code 93926, filed in 2021:
Average Adjusted Gross Income (AGI) in 2020: $55,257 (Individual Income Tax Returns)
Here:
$55,257
State:
$95,910
Salary/wage: $46,536 (reported on 90.7% of returns)
Here:
$46,536
State:
$77,331
(% of AGI for various income ranges: 1823.3% for AGIs below $25k, 5246.2% for AGIs $25k-50k, 9023.1% for AGIs $50k-75k, 13023.2% for AGIs $75k-100k, 22812.1% for AGIs $100k-200k)
Taxable interest for individuals: $741 (reported on 22.0% of returns)
This zip code:
$741
California:
$2,294
(% of AGI for various income ranges: 8.3% for AGIs below $25k, 5.8% for AGIs $25k-50k, 4.9% for AGIs $50k-75k, 12.0% for AGIs $75k-100k, 68.9% for AGIs $100k-200k)
Ordinary dividends: $4,116 (reported on 4.2% of returns)
Here:
$4,116
State:
$10,949
(% of AGI for various income ranges: 1.9% for AGIs below $25k, 1.5% for AGIs $25k-50k, 12.0% for AGIs $50k-75k, 17.6% for AGIs $75k-100k, 107.4% for AGIs $100k-200k)
Net capital gain/loss in AGI: +$6,605 (reported on 4.2% of returns)
Here:
+$6,605
State:
+$49,306
(% of AGI for various income ranges: 6.5% for AGIs $25k-50k, 20.8% for AGIs $75k-100k, 169.5% for AGIs $100k-200k)
Profit/loss from business: +$9,056 (reported on 8.7% of returns)
Here:
+$9,056
State:
+$15,671
(% of AGI for various income ranges: 71.6% for AGIs below $25k, 13.5% for AGIs $25k-50k, 126.5% for AGIs $50k-75k, 212.8% for AGIs $75k-100k, 893.7% for AGIs $100k-200k)
Taxable individual retirement arrangement distribution: $8,000 (reported on 1.6% of returns)
93926:
$8,000
California:
$23,505
(% of AGI for various income ranges: 31.9% for AGIs $25k-50k, 110.4% for AGIs $75k-100k)
Total itemized deductions: $29,241 (reported on 7.1% of returns)
Here:
$29,241
State:
$39,517
(% of AGI for various income ranges: 117.9% for AGIs $25k-50k, 383.5% for AGIs $50k-75k, 776.8% for AGIs $75k-100k, 1386.8% for AGIs $100k-200k)
Charity contributions: $3,430 (reported on 5.1% of returns)
Here:
$3,430
State:
$12,598
(% of AGI for various income ranges: 4.4% for AGIs $25k-50k, 23.7% for AGIs $50k-75k, 60.8% for AGIs $75k-100k, 125.3% for AGIs $100k-200k)
Taxes paid: $8,041 (reported on 7.1% of returns)
93926:
$8,041
State:
$8,807
(% of AGI for various income ranges: 29.6% for AGIs $25k-50k, 109.8% for AGIs $50k-75k, 242.0% for AGIs $75k-100k, 463.7% for AGIs $100k-200k)
Earned income credit: $2,367 (reported on 19.3% of returns)
Here:
$2,367
State:
$2,074
(% of AGI for various income ranges: 139.2% for AGIs below $25k, 112.8% for AGIs $25k-50k, 2.2% for AGIs $50k-75k)
Percentage of individuals using paid preparers for their 2020 taxes: 91.6%
Here:
92%
State:
92%
(% for various income ranges: 89.9% for AGIs below $25k, 91.8% for AGIs $25k-50k, 91.8% for AGIs $50k-75k, 93.2% for AGIs $75k-100k, 92.5% for AGIs $100k-200k, 100.0% for AGIs over 200k)
Averages for the 2012 tax year for zip code 93926, filed in 2013:
Average Adjusted Gross Income (AGI) in 2012: $41,192 (Individual Income Tax Returns)
Here:
$41,192
State:
$72,726
Salary/wage: $35,949 (reported on 93.3% of returns)
Here:
$35,949
State:
$59,079
(% of AGI for various income ranges: 85.0% for AGIs below $25k, 89.5% for AGIs $25k-50k, 89.1% for AGIs $50k-75k, 85.0% for AGIs $75k-100k, 80.5% for AGIs $100k-200k, 24.8% for AGIs over 200k)
Taxable interest for individuals: $1,285 (reported on 20.3% of returns)
This zip code:
$1,285
California:
$2,146
(% of AGI for various income ranges: 0.1% for AGIs below $25k, 0.2% for AGIs $25k-50k, 0.3% for AGIs $50k-75k, 0.3% for AGIs $75k-100k, 0.3% for AGIs $100k-200k, 5.1% for AGIs over 200k)
Ordinary dividends: $2,462 (reported on 3.8% of returns)
Here:
$2,462
State:
$9,308
(% of AGI for various income ranges: 0.1% for AGIs $75k-100k, 0.4% for AGIs $100k-200k, 1.3% for AGIs over 200k)
Net capital gain/loss in AGI: +$1,087 (reported on 3.6% of returns)
Here:
+$1,087
State:
+$30,460
(% of AGI for various income ranges: 0.9% for AGIs $100k-200k)
Profit/loss from business: +$9,392 (reported on 8.6% of returns)
Here:
+$9,392
State:
+$17,064
(% of AGI for various income ranges: 3.8% for AGIs below $25k, 1.8% for AGIs $25k-50k, 1.3% for AGIs $50k-75k, 2.3% for AGIs $75k-100k, 2.1% for AGIs $100k-200k)
Taxable individual retirement arrangement distribution: $11,775 (reported on 1.9% of returns)
93926:
$11,775
California:
$19,557
(% of AGI for various income ranges: 0.3% for AGIs below $25k, 0.5% for AGIs $25k-50k, 2.7% for AGIs $75k-100k)
Total itemized deductions: $22,437 (28% of AGI, reported on 24.6% of returns)
Here:
$22,437
State:
$34,004
Here:
28.4% of AGI
State:
22.7% of AGI
(% of AGI for various income ranges: 4.2% for AGIs below $25k, 9.8% for AGIs $25k-50k, 15.8% for AGIs $50k-75k, 18.3% for AGIs $75k-100k, 19.1% for AGIs $100k-200k, 18.5% for AGIs over 200k)
Charity contributions: $1,875 (reported on 19.9% of returns)
Here:
$1,875
State:
$4,659
(% of AGI for various income ranges: 0.2% for AGIs below $25k, 0.4% for AGIs $25k-50k, 1.0% for AGIs $50k-75k, 1.2% for AGIs $75k-100k, 1.7% for AGIs $100k-200k, 1.5% for AGIs over 200k)
Taxes paid: $6,284 (reported on 24.4% of returns)
93926:
$6,284
State:
$14,448
(% of AGI for various income ranges: 0.6% for AGIs below $25k, 1.9% for AGIs $25k-50k, 4.1% for AGIs $50k-75k, 5.0% for AGIs $75k-100k, 6.5% for AGIs $100k-200k, 7.6% for AGIs over 200k)
Earned income credit: $2,593 (reported on 28.9% of returns)
Here:
$2,593
State:
$2,286
(% of AGI for various income ranges: 8.5% for AGIs below $25k, 2.0% for AGIs $25k-50k)
Percentage of individuals using paid preparers for their 2012 taxes: 82.1%
Here:
82%
State:
64%
(% for various income ranges: 81.4% for AGIs below $25k, 84.9% for AGIs $25k-50k, 80.4% for AGIs $50k-75k, 81.5% for AGIs $75k-100k, 75.0% for AGIs $100k-200k, 75.0% for AGIs over 200k)
Averages for the 2004 tax year for zip code 93926, filed in 2005:
Average Adjusted Gross Income (AGI) in 2004: $37,865 (Individual Income Tax Returns)
Here:
$37,865
State:
$58,600
Salary/wage: $32,665 (reported on 93.6% of returns)
Here:
$32,665
State:
$49,455
(% of AGI for various income ranges: 113.5% for AGIs below $10k, 85.5% for AGIs $10k-25k, 90.0% for AGIs $25k-50k, 91.0% for AGIs $50k-75k, 91.0% for AGIs $75k-100k, 47.7% for AGIs over 100k)
Taxable interest for individuals: $675 (reported on 30.3% of returns)
This zip code:
$675
California:
$2,365
(% of AGI for various income ranges: 2.7% for AGIs below $10k, 0.4% for AGIs $10k-25k, 0.3% for AGIs $25k-50k, 0.3% for AGIs $50k-75k, 0.5% for AGIs $75k-100k, 1.0% for AGIs over 100k)
Taxable dividends: $1,736 (reported on 6.6% of returns)
Here:
$1,736
State:
$4,746
(% of AGI for various income ranges: 1.4% for AGIs below $10k, 0.2% for AGIs $10k-25k, 0.1% for AGIs $25k-50k, 0.2% for AGIs $50k-75k, 0.2% for AGIs $75k-100k, 0.8% for AGIs over 100k)
Net capital gain/loss: +$6,438 (reported on 4.6% of returns)
Here:
+$6,438
State:
+$23,418
(% of AGI for various income ranges: -1.2% for AGIs below $10k, -0.0% for AGIs $10k-25k, 0.3% for AGIs $25k-50k, -0.1% for AGIs $50k-75k, -0.2% for AGIs $75k-100k, 3.5% for AGIs over 100k)
Profit/loss from business: +$7,104 (reported on 9.8% of returns)
Here:
+$7,104
State:
+$16,826
(% of AGI for various income ranges: 7.8% for AGIs below $10k, 2.6% for AGIs $10k-25k, 2.1% for AGIs $25k-50k, 2.2% for AGIs $50k-75k, 0.2% for AGIs $75k-100k, 1.1% for AGIs over 100k)
IRA payment deduction: $3,062 (reported on 1.3% of returns)
93926:
$3,062
California:
$3,192
Total itemized deductions: $23,170 (31% of AGI, reported on 26.9% of returns)
Here:
$23,170
State:
$28,113
Here:
30.7% of AGI
State:
25.3% of AGI
(% of AGI for various income ranges: 5.4% for AGIs $10k-25k, 13.7% for AGIs $25k-50k, 23.2% for AGIs $50k-75k, 26.2% for AGIs $75k-100k, 17.7% for AGIs over 100k)
Charity contributions deductions: $2,096 (3% of AGI, reported on 22.8% of returns)
Here:
$2,096
State:
$3,923
Here:
2.6% of AGI
State:
3.3% of AGI
(% of AGI for various income ranges: 0.3% for AGIs $10k-25k, 0.7% for AGIs $25k-50k, 1.2% for AGIs $50k-75k, 1.4% for AGIs $75k-100k, 2.9% for AGIs over 100k)
Total tax: $5,315 (reported on 55.7% of returns)
93926:
$5,315
State:
$10,761
(% of AGI for various income ranges: 3.0% for AGIs below $10k, 2.1% for AGIs $10k-25k, 3.8% for AGIs $25k-50k, 5.9% for AGIs $50k-75k, 7.4% for AGIs $75k-100k, 19.5% for AGIs over 100k)
Earned income credit: $1,939 (reported on 28.7% of returns)
Here:
$1,939
State:
$1,763
Percentage of individuals using paid preparers for their 2004 taxes: 79.1%
Here:
79%
State:
66%
(% for various income ranges: 72.6% for AGIs below $10k, 80.2% for AGIs $10k-25k, 80.7% for AGIs $25k-50k, 79.2% for AGIs $50k-75k, 73.9% for AGIs $75k-100k, 84.9% for AGIs over 100k)
Household received Food Stamps/SNAP in the past 12 months: 157 Household did not receive Food Stamps/SNAP in the past 12 months: 2,302
Women who had a birth in the past 12 months: 38 (0 now married, 39 unmarried) Women who did not have a birth in the past 12 months: 2,445 (1,004 now married, 1,440 unmarried)
Housing units in zip code 93926 with a mortgage: 1,096 (11 second mortgage) Median monthly owner costs for units with a mortgage: $2,065 Median monthly owner costs for units without a mortgage: $727
Residents with income below the poverty level in 2022:
This zip code:
8.7%
Whole state:
12.2%
Residents with income below 50% of the poverty level in 2022:
This zip code:
6.2%
Whole state:
6.2%
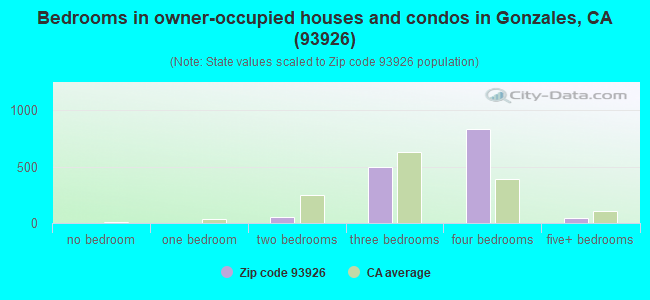
Median number of rooms in houses and condos:
Here:
5.9
State:
6.0
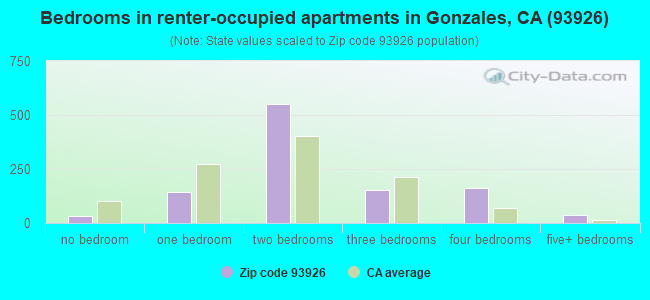
Median number of rooms in apartments:
Here:
4.1
State:
3.9
Notable locations in this zip code not listed on our city pages
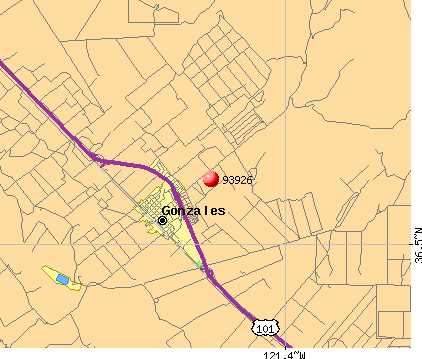
Notable locations in zip code 93926: The Monterey Vineyard (A), Metzer Farms (B), Johnson Canyon Landfill (C), Gonzales Community Center (D), Gonzales City Hall (E), Gonzales Chamber of Commerce (F), Gonzales Branch Monterey County Free Libraries (G), Gonzales Volunteer Fire Department (H). Display/hide their locations on the map
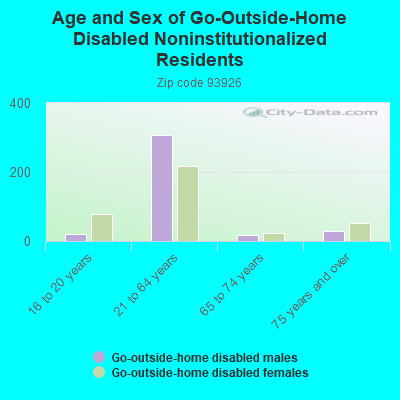
In group quarters: 7 (-1 institutionalized population)
Size of family households: 660 2-persons, 399 3-persons, 172 4-persons, 472 5-persons, 393 6-persons, 61 7-or-more-persons
Size of nonfamily households: 227 1-person, 89 2-persons
1,181 married couples with children.
551 single-parent households (217 men, 334 women).
25.9% of residents of 93926 zip code speak English at home.
73.9% of residents speak Spanish at home (55% very well, 11% well, 12% not well, 22% not at all).
0.6% of residents speak other Indo-European language at home (79% very well, 21% well).
0.4% of residents speak Asian or Pacific Island language at home (76% well, 24% not well).
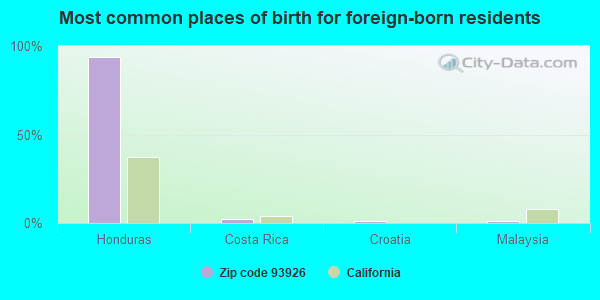
Foreign born population: 2,901 (32.7%) (21.1% of them are naturalized citizens)
This zip code:
32.7%
Whole state:
26.7%
94%Honduras
2%Costa Rica
1%Croatia
1%Malaysia
0%Italy
0%Portugal
0%Mexico
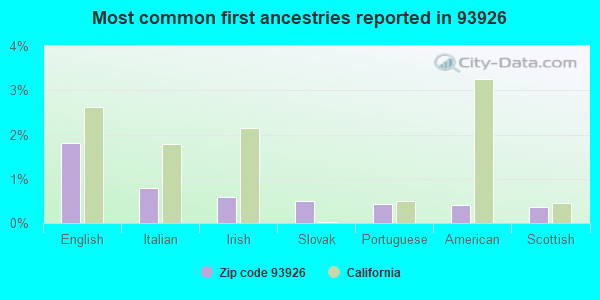
2%English
1%Italian
1%Irish
0%Slovak
0%Portuguese
0%American
0%Scottish
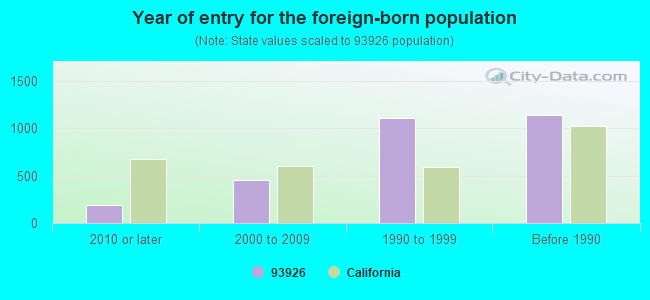
Year of entry for the foreign-born population
1872010 or later
4552000 to 2009
1,1121990 to 1999
1,139Before 1990
Major facilities with environmental interests located in this zip code:
GONZALES UHSD (501 FIFTH ST in GONZALES, CA)
STATE MASTER (California - Hazardous Waste Tracking) - HAZARDOU WASTE PROGRAM COMPLIANCE ACTIVITY (Tracking inspections of insecticide, fungicide, and rodenticide, and toxic substances) (National Center for Education Statistics) - STATE ID-2730885 Small Quantity Generators, between 100 kg and 1000 kg of hazardous waste/month (Resource Conservation and Recovery Act (tracking hazardous waste)) Organizations: GONZALES UNIFIED (SCHOOL DISTRICT)
Alternative names: GONZALES HIGH SCHOOL, GONZALES UNIFIED SCHOOL DISTRICT, GONZALES UNION HIGH SCHOOL, GONZALES UNION HIGH SCHOOL DISTRICT, GONZALES UNION SCHOOL DISTRICT
JOHNSON CANYON SANITARY LANDFILL (31400 JOHNSON CANYON ROAD in GONZALES, CA)
AIR MAJOR (AIRS/AFS) STATE MASTER (California Solid Waste disposal sites tracking) - REFUSE DISPOSAL STATE MASTER (California - Hazardous Waste Tracking) - HAZARDOU WASTE PROGRAM CRITERIA AND HAZARDOUS AIR POLLUTANT INVENTORY (Inventory of air pollution sources) Small Quantity Generators, between 100 kg and 1000 kg of hazardous waste/month (Resource Conservation and Recovery Act (tracking hazardous waste)) - notification REFUSE DISPOSAL (Solid waste facilities tracking) Business SIC classification: REFUSE SYSTEMS Business NAICS classification: SOLID WASTE LANDFILL. Organizations: SALINAS VALLEY SOLID WASTE AUTHORITY (CONTACT/OPERATOR)
, SALINAS VALLEY SOLID WASTE (CONTACT/OWNER)
Alternative names: JOHNSON CANYON LANDFILL, NORCAL / JOHNSON CANYON OPS, SALINAS VALLEY SOLID WASTE AUTHORITY
INCOTEC (425 ALTA ST UNIT B in GONZALES, CA)
STATE MASTER (California - Hazardous Waste Tracking) - HAZARDOU WASTE PROGRAM Small Quantity Generators, between 100 kg and 1000 kg of hazardous waste/month (Resource Conservation and Recovery Act (tracking hazardous waste)) Alternative names: ASGROW VEGETABLE SEED CO, INCOTEC INTEGRATED COATING & SEED TECH INC
FAIRVIEW MIDDLE (401 4TH ST. in GONZALES, CA)
(National Center for Education Statistics) - STATE ID-6026090 Organizations: GONZALES UNIFIED (SCHOOL DISTRICT)
LA GLORIA ELEMENTARY (220 ELKO ST. in GONZALES, CA)
(National Center for Education Statistics) - STATE ID-6066955 Organizations: GONZALES UNIFIED (SCHOOL DISTRICT)
GONZALES UNION SCHOOL DISTRICT (401 FOURTH ST in GONZALES, CA)
COMPLIANCE ACTIVITY (Tracking inspections of insecticide, fungicide, and rodenticide, and toxic substances) Small Quantity Generators, between 100 kg and 1000 kg of hazardous waste/month (Resource Conservation and Recovery Act (tracking hazardous waste)) Alternative names: GONZALES UNION SD
JOSEPH GALLO FARMS FEED LOT (31701 JOHNSON CANYON RD AT IVE in GONZALES, CA)
National Pollutant Discharge Elimination System NON-MAJOR (Tracking pollutant discharge elimination systems) - permit Business SIC classification: BEEF CATTLE FEEDLOTS Organizations: GALLO CATTLE COMPANY (CONTACT/OWNER)
Alternative names: GALLO CATTLE COMPANY
CANANDAIGUA WINE CO. (800 SOUTH ALTA ST. in GONZALES, CA)
HAZARDOUS WASTE BIENNIAL REPORTER (Resource Conservation and Recovery Act (tracking hazardous waste)) (Resource Conservation and Recovery Act (tracking hazardous waste))
CAMINO CLEANERS WASH AND DRY (851 5TH STREET UNIT X in GONZALES, CA)
CRITERIA AND HAZARDOUS AIR POLLUTANT INVENTORY (Inventory of air pollution sources) Small Quantity Generators, between 100 kg and 1000 kg of hazardous waste/month (Resource Conservation and Recovery Act (tracking hazardous waste)) - notification Business SIC classification: DRYCLEANING PLANTS, EXCEPT RUG CLEANING Organizations: RALPH SERRANO (CONTACT/OWNER)
GENERAL VINEYARD SRV (46 4TH in GONZALES, CA)
COMPLIANCE ACTIVITY (Tracking inspections of insecticide, fungicide, and rodenticide, and toxic substances) Alternative names: GENERAL VINYARD SERVICES
FARMERS EXXON MINI MART (800 JOHNSON CANYON ROAD in GONZALES, CA)
CRITERIA AND HAZARDOUS AIR POLLUTANT INVENTORY (Inventory of air pollution sources) Business SIC classification: GASOLINE SERVICE STATIONS
GARCIAS MARKET (800 NORTH ALTA in GONZALES, CA)
CRITERIA AND HAZARDOUS AIR POLLUTANT INVENTORY (Inventory of air pollution sources) Business SIC classification: GASOLINE SERVICE STATIONS
GONZALES UNION SCHOOL DISTRICT (300 ELKO ST in GONZALES, CA)
COMPLIANCE ACTIVITY (Tracking inspections of insecticide, fungicide, and rodenticide, and toxic substances)
Housing units lacking complete plumbing facilities: 1.1% Housing units lacking complete kitchen facilities: 3.5%
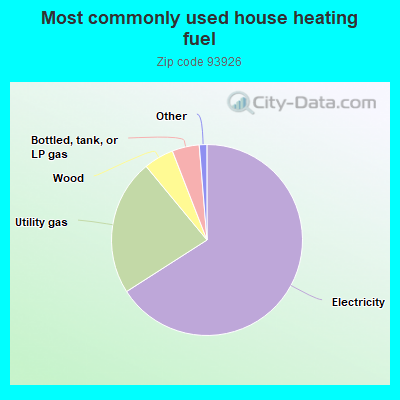
66.0%Electricity
23.1%Utility gas
5.1%Wood
4.6%Bottled, tank, or LP gas
0.8%No fuel used
0.5%Solar energy
Population in 1990: 12,842.
Place of birth for U.S.-born residents:
This state: 5,637
Northeast: 29
South: 132
West: 120
56% of the 93926 zip code residents lived in the same house 5 years ago. Out of people who lived in different houses, 87% lived in this county. Out of people who lived in different counties, 50% lived in California.
94% of the 93926 zip code residents lived in the same house 1 year ago. Out of people who lived in different houses, 58% moved from this county. Out of people who lived in different houses, 28% moved from different county within same state. Out of people who lived in different houses, 18% moved from different state.
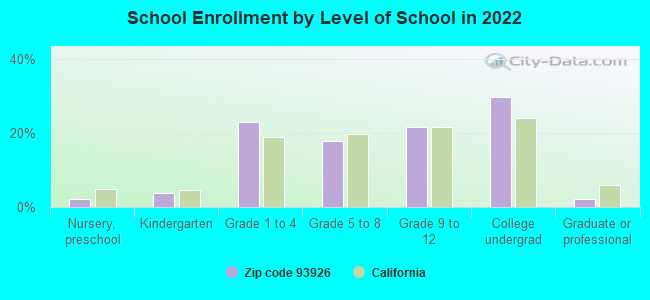
Private vs. public school enrollment:
Students in private schools in grades 1 to 8 (elementary and middle school):
Here:
0.0%
California:
10.5%
Students in private schools in grades 9 to 12 (high school): 31
Here:
6.0%
California:
8.5%
Students in private undergraduate colleges: 11
Here:
1.6%
California:
15.9%
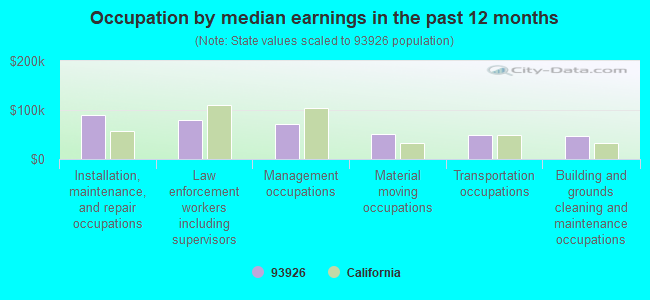
Occupation by median earnings in the past 12 months ($)
89,090Installation, maintenance, and repair occupations
80,576Law enforcement workers including supervisors
70,837Management occupations
50,187Material moving occupations
49,147Transportation occupations
46,100Building and grounds cleaning and maintenance occupations
Top industries in this zip code by the number of employees in 2005:
Other Services (except Public Administration): Commercial and Industrial Machinery and Equipment (except Automotive and Electronic) Repair and Maintenance (5-9: 4, 1-4: 1)
People in group quarters in 2010:
6 people in workers' group living quarters and job corps centers
People in group quarters in 2000:
34 people in agriculture workers' dormitories on farms
Fatal accident statistics in 2013:
Fatal accident count: 1
Vehicles involved in fatal accidents: 1
Fatal accidents caused by drunken drivers: 0
Fatalities: 1
Persons involved in fatal accidents: 1
Pedestrians involved in fatal accidents: 0
Fatal accident statistics in 2012:
Fatal accident count: 1
Vehicles involved in fatal accidents: 2
Fatal accidents caused by drunken drivers: 0
Fatalities: 1
Persons involved in fatal accidents: 2
Pedestrians involved in fatal accidents: 0
Home Mortgage Disclosure Act Aggregated Statistics For Year 2009 (Based on 6 partial tracts)
A) FHA, FSA/RHS & VA Home Purchase Loans
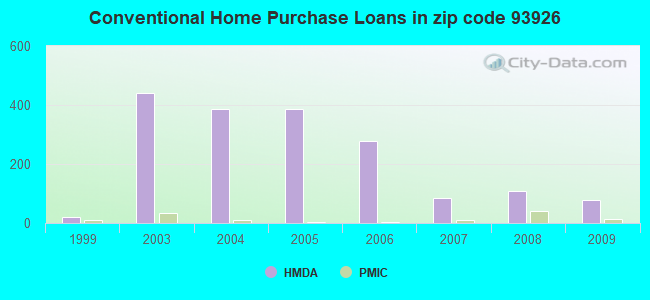
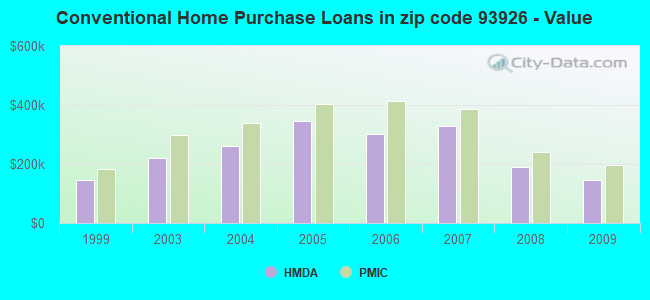
B) Conventional Home Purchase Loans
C) Refinancings
D) Home Improvement Loans
F) Non-occupant Loans on < 5 Family Dwellings (A B C & D)
G) Loans On Manufactured Home Dwelling (A B C & D)
Number
Average Value
Number
Average Value
Number
Average Value
Number
Average Value
Number
Average Value
Number
Average Value
LOANS ORIGINATED
181
$194,920
78
$146,646
52
$268,126
5
$88,262
41
$174,440
0
$0
APPLICATIONS APPROVED, NOT ACCEPTED
12
$208,641
10
$187,038
4
$228,640
0
$0
3
$166,047
1
$22,660
APPLICATIONS DENIED
29
$194,383
21
$195,030
51
$269,636
3
$122,567
11
$192,063
1
$121,350
APPLICATIONS WITHDRAWN
18
$192,504
11
$162,466
22
$205,334
1
$159,360
6
$120,880
0
$0
FILES CLOSED FOR INCOMPLETENESS
4
$190,805
5
$170,676
9
$242,447
0
$0
2
$108,300
0
$0
Aggregated Statistics For Year 2008 (Based on 6 partial tracts)
A) FHA, FSA/RHS & VA Home Purchase Loans
B) Conventional Home Purchase Loans
C) Refinancings
D) Home Improvement Loans
F) Non-occupant Loans on < 5 Family Dwellings (A B C & D)
G) Loans On Manufactured Home Dwelling (A B C & D)
Number
Average Value
Number
Average Value
Number
Average Value
Number
Average Value
Number
Average Value
Number
Average Value
LOANS ORIGINATED
69
$235,652
107
$189,456
58
$237,625
4
$85,908
42
$181,019
0
$0
APPLICATIONS APPROVED, NOT ACCEPTED
7
$215,271
27
$254,323
26
$296,713
2
$111,490
7
$197,870
1
$124,270
APPLICATIONS DENIED
32
$235,616
48
$228,656
143
$329,071
11
$134,863
19
$227,204
0
$0
APPLICATIONS WITHDRAWN
7
$214,461
13
$225,757
34
$278,619
2
$148,905
4
$220,030
0
$0
FILES CLOSED FOR INCOMPLETENESS
1
$263,890
8
$261,770
19
$317,445
0
$0
1
$74,560
0
$0
Aggregated Statistics For Year 2007 (Based on 6 partial tracts)
A) FHA, FSA/RHS & VA Home Purchase Loans
B) Conventional Home Purchase Loans
C) Refinancings
D) Home Improvement Loans
E) Loans on Dwellings For 5+ Families
F) Non-occupant Loans on < 5 Family Dwellings (A B C & D)
G) Loans On Manufactured Home Dwelling (A B C & D)
Number
Average Value
Number
Average Value
Number
Average Value
Number
Average Value
Number
Average Value
Number
Average Value
Number
Average Value
LOANS ORIGINATED
1
$237,570
86
$330,088
357
$340,360
38
$241,574
1
$3,251,120
42
$314,045
2
$83,045
APPLICATIONS APPROVED, NOT ACCEPTED
1
$119,880
39
$338,418
135
$343,378
14
$216,854
0
$0
9
$290,967
3
$151,073
APPLICATIONS DENIED
1
$300,440
69
$330,428
322
$383,095
61
$207,355
0
$0
32
$363,419
2
$110,380
APPLICATIONS WITHDRAWN
2
$206,140
24
$360,421
97
$349,621
9
$180,107
0
$0
9
$340,597
0
$0
FILES CLOSED FOR INCOMPLETENESS
0
$0
15
$278,747
29
$372,823
4
$198,712
0
$0
2
$146,930
0
$0
Aggregated Statistics For Year 2006 (Based on 6 partial tracts)
A) FHA, FSA/RHS & VA Home Purchase Loans
B) Conventional Home Purchase Loans
C) Refinancings
D) Home Improvement Loans
E) Loans on Dwellings For 5+ Families
F) Non-occupant Loans on < 5 Family Dwellings (A B C & D)
G) Loans On Manufactured Home Dwelling (A B C & D)
Number
Average Value
Number
Average Value
Number
Average Value
Number
Average Value
Number
Average Value
Number
Average Value
Number
Average Value
LOANS ORIGINATED
17
$205,844
279
$300,200
567
$354,836
100
$262,473
2
$329,295
63
$338,302
0
$0
APPLICATIONS APPROVED, NOT ACCEPTED
0
$0
55
$332,788
148
$366,010
16
$299,712
0
$0
15
$352,273
0
$0
APPLICATIONS DENIED
0
$0
150
$322,359
382
$395,216
68
$228,340
1
$365,500
34
$397,441
2
$88,225
APPLICATIONS WITHDRAWN
0
$0
56
$330,762
191
$399,328
22
$257,884
0
$0
16
$514,796
0
$0
FILES CLOSED FOR INCOMPLETENESS
0
$0
20
$290,112
58
$368,350
2
$406,675
0
$0
10
$320,657
0
$0
Aggregated Statistics For Year 2005 (Based on 6 partial tracts)
A) FHA, FSA/RHS & VA Home Purchase Loans
B) Conventional Home Purchase Loans
C) Refinancings
D) Home Improvement Loans
E) Loans on Dwellings For 5+ Families
F) Non-occupant Loans on < 5 Family Dwellings (A B C & D)
G) Loans On Manufactured Home Dwelling (A B C & D)
Number
Average Value
Number
Average Value
Number
Average Value
Number
Average Value
Number
Average Value
Number
Average Value
Number
Average Value
LOANS ORIGINATED
2
$190,210
385
$344,881
753
$333,173
83
$278,484
1
$1,169,600
85
$303,921
1
$7,310
APPLICATIONS APPROVED, NOT ACCEPTED
1
$107,420
62
$333,020
138
$321,982
16
$232,040
0
$0
10
$331,968
2
$59,150
APPLICATIONS DENIED
0
$0
151
$357,179
361
$347,680
62
$219,815
0
$0
35
$299,953
2
$241,410
APPLICATIONS WITHDRAWN
0
$0
59
$318,712
247
$332,197
22
$222,834
0
$0
14
$377,646
1
$222,220
FILES CLOSED FOR INCOMPLETENESS
0
$0
15
$437,971
58
$328,196
7
$267,337
0
$0
3
$303,280
0
$0
Aggregated Statistics For Year 2004 (Based on 6 partial tracts)
A) FHA, FSA/RHS & VA Home Purchase Loans
B) Conventional Home Purchase Loans
C) Refinancings
D) Home Improvement Loans
E) Loans on Dwellings For 5+ Families
F) Non-occupant Loans on < 5 Family Dwellings (A B C & D)
G) Loans On Manufactured Home Dwelling (A B C & D)
Number
Average Value
Number
Average Value
Number
Average Value
Number
Average Value
Number
Average Value
Number
Average Value
Number
Average Value
LOANS ORIGINATED
10
$206,792
386
$261,339
702
$261,017
59
$175,711
2
$325,165
68
$252,099
1
$8,950
APPLICATIONS APPROVED, NOT ACCEPTED
2
$213,815
81
$270,348
140
$252,259
7
$95,341
0
$0
11
$310,642
1
$95,760
APPLICATIONS DENIED
3
$235,137
106
$265,473
282
$274,042
35
$157,847
0
$0
20
$285,116
2
$66,275
APPLICATIONS WITHDRAWN
4
$187,135
73
$237,653
266
$253,447
29
$152,431
0
$0
18
$258,807
0
$0
FILES CLOSED FOR INCOMPLETENESS
1
$163,740
8
$276,769
56
$250,847
5
$114,528
0
$0
6
$244,412
0
$0
Aggregated Statistics For Year 2003 (Based on 6 partial tracts)
A) FHA, FSA/RHS & VA Home Purchase Loans
B) Conventional Home Purchase Loans
C) Refinancings
D) Home Improvement Loans
E) Loans on Dwellings For 5+ Families
F) Non-occupant Loans on < 5 Family Dwellings (A B C & D)
Number
Average Value
Number
Average Value
Number
Average Value
Number
Average Value
Number
Average Value
Number
Average Value
LOANS ORIGINATED
15
$252,995
442
$218,646
817
$197,189
22
$46,430
4
$514,505
62
$170,423
APPLICATIONS APPROVED, NOT ACCEPTED
2
$220,135
75
$211,312
161
$205,000
5
$47,846
0
$0
18
$208,548
APPLICATIONS DENIED
1
$46,390
74
$193,869
244
$198,110
18
$40,888
0
$0
16
$172,092
APPLICATIONS WITHDRAWN
1
$189,330
48
$208,370
207
$196,437
8
$34,365
1
$1,057,940
6
$189,390
FILES CLOSED FOR INCOMPLETENESS
0
$0
17
$271,103
42
$222,360
3
$49,707
0
$0
1
$411,550
Aggregated Statistics For Year 1999 (Based on 1 partial tract)
A) FHA, FSA/RHS & VA Home Purchase Loans
B) Conventional Home Purchase Loans
C) Refinancings
D) Home Improvement Loans
E) Loans on Dwellings For 5+ Families
F) Non-occupant Loans on < 5 Family Dwellings (A B C & D)
2002 - 2018 National Fire Incident Reporting System (NFIRS) incidents
Based on the data from the years 2002 - 2018 the average number of fires per year is 14. The highest number of fires - 47 took place in 2007, and the least - 0 in 2003. The data has a growing trend.
When looking into fire subcategories, the most reports belonged to: Outside Fires (49.2%), and Structure Fires (28.0%).
Fire incident types reported to NFIRS in Zip Code 93926


 Nearest zip codes: 93925, 93960, 93908, 93901, 93905, 93924.
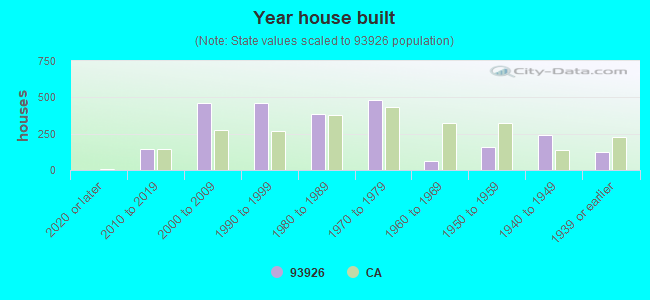


 Based on the data from the years 2002 - 2018 the average number of fires per year is 14. The highest number of fires - 47 took place in 2007, and the least - 0 in 2003. The data has a growing trend.
 When looking into fire subcategories, the most reports belonged to: Outside Fires (49.2%), and Structure Fires (28.0%).