Estimated zip code population in 2022: 26,310 Zip code population in 2010: 25,876 Zip code population in 2000: 25,563
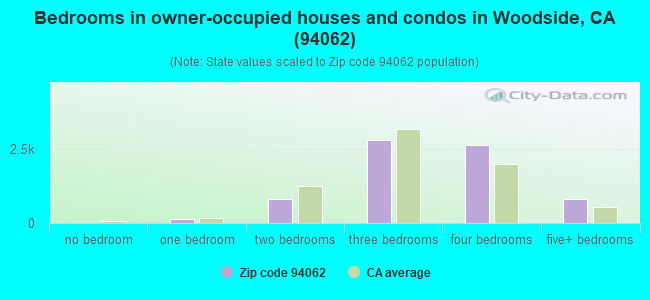
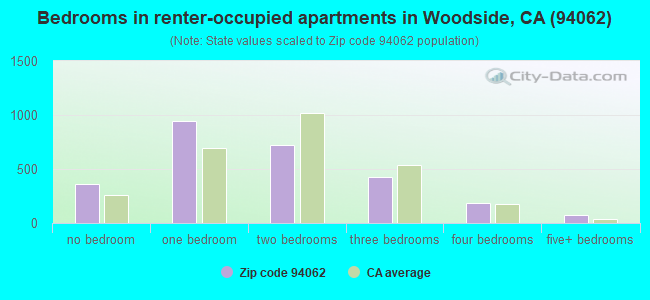
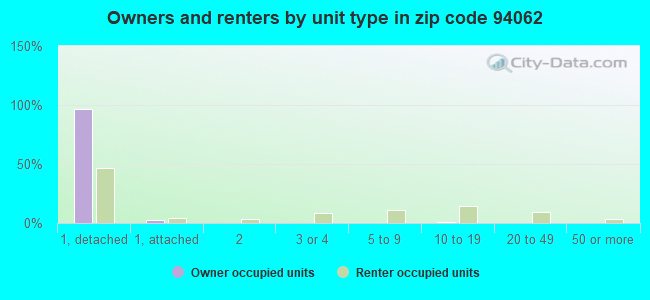
Houses and condos: 10,584 Renter-occupied apartments: 2,708
% of renters here:
27%
State:
44%
March 2022 cost of living index in zip code 94062: 131.1 (high, U.S. average is 100)
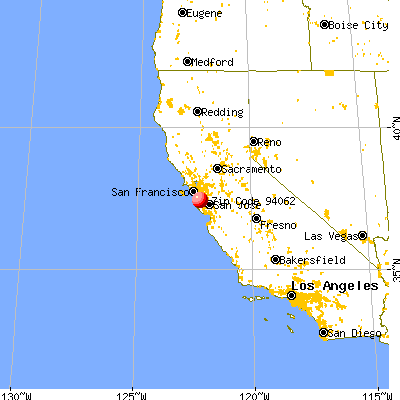
Land area: 70.9 sq. mi. Water area: 0.9 sq. mi.
Population density: 371 people per square mile
(very low).
OSM Map
General Map
Google Map
MSN Map
OSM Map
General Map
Google Map
MSN Map
OSM Map
General Map
Google Map
MSN Map
OSM Map
General Map
Google Map
MSN Map
Please wait while loading the map...
Real estate property taxes paid for housing units in 2022:
This zip code:
0.5% ($10,292)
California:
0.7% ($4,831)
Median real estate property taxes paid for housing units with mortgages in 2022: $10,330 (0.5%) Median real estate property taxes paid for housing units with no mortgage in 2022: $8,902 (0.4%)
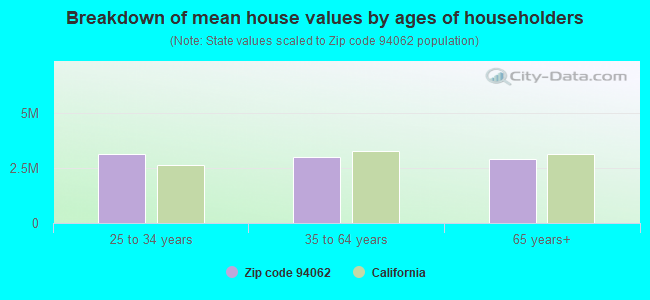
Estimated median house/condo value in 2022: $2,171,698
94062:
$2,171,698
California:
$715,900
According to our research of California and other state lists, there were 13 registered sex offenders living in 94062 zip code as of April 27, 2024. The ratio of all residents to sex offenders in zip code 94062 is 2,114 to 1. The ratio of registered sex offenders to all residents in this zip code is much lower than the state average.
Median resident age:
This zip code:
45.3 years
California median age:
37.9 years
Average household size:
This zip code:
2.6 people
California:
2.8 people
Averages for the 2020 tax year for zip code 94062, filed in 2021:
Average Adjusted Gross Income (AGI) in 2020: $558,599 (Individual Income Tax Returns)
Here:
$558,599
State:
$95,910
Salary/wage: $338,841 (reported on 74.1% of returns)
Here:
$338,841
State:
$77,331
(% of AGI for various income ranges: 1279.5% for AGIs below $25k, 4248.4% for AGIs $25k-50k, 7261.3% for AGIs $50k-75k, 10831.8% for AGIs $75k-100k, 20315.0% for AGIs $100k-200k, 331321.8% for AGIs over 200k)
Taxable interest for individuals: $15,366 (reported on 62.4% of returns)
This zip code:
$15,366
California:
$2,294
(% of AGI for various income ranges: 59.3% for AGIs below $25k, 140.0% for AGIs $25k-50k, 122.0% for AGIs $50k-75k, 190.4% for AGIs $75k-100k, 399.7% for AGIs $100k-200k, 13340.9% for AGIs over 200k)
Ordinary dividends: $103,114 (reported on 56.2% of returns)
Here:
$103,114
State:
$10,949
(% of AGI for various income ranges: 201.3% for AGIs below $25k, 366.8% for AGIs $25k-50k, 452.2% for AGIs $50k-75k, 770.4% for AGIs $75k-100k, 1602.1% for AGIs $100k-200k, 82675.2% for AGIs over 200k)
Net capital gain/loss in AGI: +$294,202 (reported on 54.8% of returns)
Here:
+$294,202
State:
+$49,306
(% of AGI for various income ranges: 94.5% for AGIs below $25k, 357.4% for AGIs $25k-50k, 379.0% for AGIs $50k-75k, 696.7% for AGIs $75k-100k, 1854.8% for AGIs $100k-200k, 235430.9% for AGIs over 200k)
Profit/loss from business: +$49,361 (reported on 21.9% of returns)
Here:
+$49,361
State:
+$15,671
(% of AGI for various income ranges: 292.3% for AGIs below $25k, 578.8% for AGIs $25k-50k, 536.1% for AGIs $50k-75k, 915.7% for AGIs $75k-100k, 1880.3% for AGIs $100k-200k, 12097.4% for AGIs over 200k)
Taxable individual retirement arrangement distribution: $39,556 (reported on 12.5% of returns)
94062:
$39,556
California:
$23,505
(% of AGI for various income ranges: 92.5% for AGIs below $25k, 223.9% for AGIs $25k-50k, 433.2% for AGIs $50k-75k, 548.0% for AGIs $75k-100k, 1604.7% for AGIs $100k-200k, 4544.7% for AGIs over 200k)
Self-employed (Keogh) retirement plans: $40,269 (reported on 4.4% of returns)
94062:
$40,269
California:
$30,163
(% of AGI for various income ranges: 54.8% for AGIs $25k-50k, 49.4% for AGIs $75k-100k, 185.4% for AGIs $100k-200k, 2336.1% for AGIs over 200k)
Total itemized deductions: $112,628 (reported on 36.1% of returns)
Here:
$112,628
State:
$39,517
(% of AGI for various income ranges: 449.9% for AGIs below $25k, 606.9% for AGIs $25k-50k, 1053.0% for AGIs $50k-75k, 1641.8% for AGIs $75k-100k, 3008.6% for AGIs $100k-200k, 53991.2% for AGIs over 200k)
Charity contributions: $86,641 (reported on 30.4% of returns)
Here:
$86,641
State:
$12,598
(% of AGI for various income ranges: 15.5% for AGIs below $25k, 35.3% for AGIs $25k-50k, 80.7% for AGIs $50k-75k, 150.4% for AGIs $75k-100k, 428.7% for AGIs $100k-200k, 38348.5% for AGIs over 200k)
Taxes paid: $9,471 (reported on 36.0% of returns)
94062:
$9,471
State:
$8,807
(% of AGI for various income ranges: 83.5% for AGIs below $25k, 122.6% for AGIs $25k-50k, 207.1% for AGIs $50k-75k, 367.8% for AGIs $75k-100k, 781.3% for AGIs $100k-200k, 3586.1% for AGIs over 200k)
Earned income credit: $1,251 (reported on 3.1% of returns)
Here:
$1,251
State:
$2,074
(% of AGI for various income ranges: 34.0% for AGIs below $25k, 21.6% for AGIs $25k-50k)
Percentage of individuals using paid preparers for their 2020 taxes: 92.0%
Here:
92%
State:
92%
(% for various income ranges: 87.5% for AGIs below $25k, 90.2% for AGIs $25k-50k, 92.1% for AGIs $50k-75k, 92.2% for AGIs $75k-100k, 93.4% for AGIs $100k-200k, 93.8% for AGIs over 200k)
Averages for the 2012 tax year for zip code 94062, filed in 2013:
Average Adjusted Gross Income (AGI) in 2012: $374,395 (Individual Income Tax Returns)
Here:
$374,395
State:
$72,726
Salary/wage: $196,048 (reported on 75.3% of returns)
Here:
$196,048
State:
$59,079
(% of AGI for various income ranges: 61.5% for AGIs below $25k, 69.3% for AGIs $25k-50k, 65.4% for AGIs $50k-75k, 61.4% for AGIs $75k-100k, 66.4% for AGIs $100k-200k, 35.5% for AGIs over 200k)
Taxable interest for individuals: $11,864 (reported on 60.1% of returns)
This zip code:
$11,864
California:
$2,146
(% of AGI for various income ranges: 3.8% for AGIs below $25k, 1.7% for AGIs $25k-50k, 1.5% for AGIs $50k-75k, 1.6% for AGIs $75k-100k, 1.3% for AGIs $100k-200k, 2.0% for AGIs over 200k)
Ordinary dividends: $36,204 (reported on 49.8% of returns)
Here:
$36,204
State:
$9,308
(% of AGI for various income ranges: 8.5% for AGIs below $25k, 3.8% for AGIs $25k-50k, 3.7% for AGIs $50k-75k, 3.9% for AGIs $75k-100k, 3.6% for AGIs $100k-200k, 4.9% for AGIs over 200k)
Net capital gain/loss in AGI: +$269,893 (reported on 46.9% of returns)
Here:
+$269,893
State:
+$30,460
(% of AGI for various income ranges: 1.0% for AGIs below $25k, 0.9% for AGIs $25k-50k, 1.4% for AGIs $50k-75k, 1.7% for AGIs $75k-100k, 2.6% for AGIs $100k-200k, 38.5% for AGIs over 200k)
Profit/loss from business: +$61,773 (reported on 23.6% of returns)
Here:
+$61,773
State:
+$17,064
(% of AGI for various income ranges: 14.7% for AGIs below $25k, 8.8% for AGIs $25k-50k, 7.8% for AGIs $50k-75k, 7.0% for AGIs $75k-100k, 8.0% for AGIs $100k-200k, 3.2% for AGIs over 200k)
Taxable individual retirement arrangement distribution: $43,897 (reported on 14.3% of returns)
94062:
$43,897
California:
$19,557
(% of AGI for various income ranges: 3.9% for AGIs below $25k, 3.4% for AGIs $25k-50k, 3.4% for AGIs $50k-75k, 4.9% for AGIs $75k-100k, 3.5% for AGIs $100k-200k, 1.4% for AGIs over 200k)
Self-employment retirement plans: $30,120 (reported on 4.9% of returns)
94062:
$30,120
California:
$24,530
(% of AGI for various income ranges: 0.8% for AGIs below $25k, 0.4% for AGIs $50k-75k, 0.4% for AGIs $75k-100k, 0.8% for AGIs $100k-200k, 0.4% for AGIs over 200k)
Total itemized deductions: $111,308 (18% of AGI, reported on 58.4% of returns)
Here:
$111,308
State:
$34,004
Here:
18.1% of AGI
State:
22.7% of AGI
(% of AGI for various income ranges: 28.8% for AGIs below $25k, 17.1% for AGIs $25k-50k, 17.4% for AGIs $50k-75k, 21.2% for AGIs $75k-100k, 22.3% for AGIs $100k-200k, 16.8% for AGIs over 200k)
Charity contributions: $25,974 (reported on 49.3% of returns)
Here:
$25,974
State:
$4,659
(% of AGI for various income ranges: 0.8% for AGIs below $25k, 1.1% for AGIs $25k-50k, 1.3% for AGIs $50k-75k, 1.6% for AGIs $75k-100k, 1.8% for AGIs $100k-200k, 3.7% for AGIs over 200k)
Taxes paid: $62,437 (reported on 58.2% of returns)
94062:
$62,437
State:
$14,448
(% of AGI for various income ranges: 7.6% for AGIs below $25k, 4.6% for AGIs $25k-50k, 5.3% for AGIs $50k-75k, 7.8% for AGIs $75k-100k, 9.5% for AGIs $100k-200k, 9.9% for AGIs over 200k)
Earned income credit: $1,320 (reported on 4.3% of returns)
Here:
$1,320
State:
$2,286
(% of AGI for various income ranges: 1.7% for AGIs below $25k, 0.2% for AGIs $25k-50k)
Percentage of individuals using paid preparers for their 2012 taxes: 62.7%
Here:
63%
State:
64%
(% for various income ranges: 54.7% for AGIs below $25k, 56.8% for AGIs $25k-50k, 59.3% for AGIs $50k-75k, 62.9% for AGIs $75k-100k, 63.5% for AGIs $100k-200k, 74.5% for AGIs over 200k)
Averages for the 2004 tax year for zip code 94062, filed in 2005:
Average Adjusted Gross Income (AGI) in 2004: $224,263 (Individual Income Tax Returns)
Here:
$224,263
State:
$58,600
Salary/wage: $160,284 (reported on 73.0% of returns)
Here:
$160,284
State:
$49,455
(% of AGI for various income ranges: 56.3% for AGIs $10k-25k, 68.7% for AGIs $25k-50k, 65.1% for AGIs $50k-75k, 67.8% for AGIs $75k-100k, 49.0% for AGIs over 100k)
Taxable interest for individuals: $10,841 (reported on 69.2% of returns)
This zip code:
$10,841
California:
$2,365
(% of AGI for various income ranges: 5.4% for AGIs $10k-25k, 3.5% for AGIs $25k-50k, 2.6% for AGIs $50k-75k, 2.8% for AGIs $75k-100k, 3.2% for AGIs over 100k)
Taxable dividends: $19,543 (reported on 53.4% of returns)
Here:
$19,543
State:
$4,746
(% of AGI for various income ranges: 5.5% for AGIs $10k-25k, 3.5% for AGIs $25k-50k, 3.3% for AGIs $50k-75k, 2.9% for AGIs $75k-100k, 4.6% for AGIs over 100k)
Net capital gain/loss: +$123,996 (reported on 49.5% of returns)
Here:
+$123,996
State:
+$23,418
(% of AGI for various income ranges: 1.7% for AGIs $10k-25k, 1.7% for AGIs $25k-50k, 2.1% for AGIs $50k-75k, 2.2% for AGIs $75k-100k, 29.3% for AGIs over 100k)
Profit/loss from business: +$37,938 (reported on 23.6% of returns)
Here:
+$37,938
State:
+$16,826
(% of AGI for various income ranges: 10.2% for AGIs $10k-25k, 8.5% for AGIs $25k-50k, 8.0% for AGIs $50k-75k, 8.5% for AGIs $75k-100k, 3.4% for AGIs over 100k)
IRA payment deduction: $3,614 (reported on 3.7% of returns)
94062:
$3,614
California:
$3,192
(% of AGI for various income ranges: 0.5% for AGIs $10k-25k, 0.3% for AGIs $25k-50k, 0.3% for AGIs $50k-75k, 0.3% for AGIs $75k-100k, 0.0% for AGIs over 100k)
Self-employed pension: $21,003 (reported on 5.6% of returns)
Here:
$21,003
California:
$17,688
(% of AGI for various income ranges: 0.3% for AGIs $10k-25k, 0.3% for AGIs $25k-50k, 0.6% for AGIs $50k-75k, 1.3% for AGIs $75k-100k, 0.5% for AGIs over 100k)
Total itemized deductions: $77,407 (21% of AGI, reported on 57.8% of returns)
Here:
$77,407
State:
$28,113
Here:
20.5% of AGI
State:
25.3% of AGI
(% of AGI for various income ranges: 26.7% for AGIs $10k-25k, 20.7% for AGIs $25k-50k, 22.8% for AGIs $50k-75k, 25.0% for AGIs $75k-100k, 18.9% for AGIs over 100k)
Charity contributions deductions: $23,745 (6% of AGI, reported on 52.1% of returns)
Here:
$23,745
State:
$3,923
Here:
5.8% of AGI
State:
3.3% of AGI
(% of AGI for various income ranges: 1.5% for AGIs $10k-25k, 1.6% for AGIs $25k-50k, 1.9% for AGIs $50k-75k, 2.2% for AGIs $75k-100k, 5.8% for AGIs over 100k)
Total tax: $53,604 (reported on 85.3% of returns)
94062:
$53,604
State:
$10,761
(% of AGI for various income ranges: 5.6% for AGIs $10k-25k, 8.9% for AGIs $25k-50k, 11.1% for AGIs $50k-75k, 11.7% for AGIs $75k-100k, 20.9% for AGIs over 100k)
Earned income credit: $1,019 (reported on 3.3% of returns)
Here:
$1,019
State:
$1,763
Percentage of individuals using paid preparers for their 2004 taxes: 65.3%
Here:
65%
State:
66%
(% for various income ranges: 57.2% for AGIs below $10k, 60.1% for AGIs $10k-25k, 60.2% for AGIs $25k-50k, 65.7% for AGIs $50k-75k, 65.5% for AGIs $75k-100k, 72.7% for AGIs over 100k)
Likely homosexual households (counted as self-reported same-sex unmarried-partner households)
Lesbian couples: 0.2% of all households
Gay men: 0.4% of all households
Household received Food Stamps/SNAP in the past 12 months: 161 Household did not receive Food Stamps/SNAP in the past 12 months: 9,455
Women who had a birth in the past 12 months: 331 (308 now married, 21 unmarried) Women who did not have a birth in the past 12 months: 5,475 (2,560 now married, 2,898 unmarried)
Housing units in zip code 94062 with a mortgage: 5,006 (902 second mortgage, 15 home equity loan, 788 both second mortgage and home equity loan) Houses without a mortgage: 46
Median monthly owner costs for units with a mortgage: $3,876 Median monthly owner costs for units without a mortgage: $1,439
Residents with income below the poverty level in 2022:
This zip code:
5.4%
Whole state:
12.2%
Residents with income below 50% of the poverty level in 2022:
This zip code:
1.8%
Whole state:
6.2%
Median number of rooms in houses and condos:
Here:
7.2
State:
6.0
Median number of rooms in apartments:
Here:
3.6
State:
3.9
Notable locations in this zip code not listed on our city pages
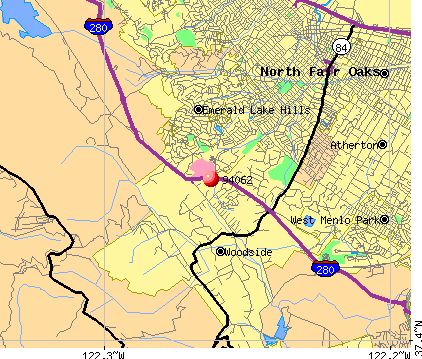
Notable locations in zip code 94062: Woodhaven Camp (A), Pulgas Water Temple (B), Pise Lookout (C), Old Woodside Store (D), Old Stage Day Camp (E), Filoli Mansion and Gardens (F), Allen Lookout (G), Corte Madera Ranch (H), Menlo Country Club (I), San Mateo County Jail (J), Woodside City Hall (K), Woodside Branch San Mateo County Library (L), Sequoia Hospital Health Sciences Library (M), Department of Forestry and Fire Protection Station 18 Cordilleras Fire Station (N), Woodside Fire Protection District Station 19 (O), Department of Forestry and Fire Protection Station 56 Kings Mountain Volunteer Fire Brigade (P), California Department of Forestry and Fire Protection Station 58 Skylonda Fire Station (Q), Woodside Fire Protection District Station 7 (R), Redwood City Fire Department Station 10 (S), Redwood City Fire Department Station 12 (T). Display/hide their locations on the map
Churches in zip code 94062 include: The Church of Jesus Christ of Latter Day Saints (A), Redeemer Lutheran Church (B), Salvation Army Temple (C), Saint Peter's Episcopal Church (D), Our Lady of Mount Carmel Church (E), First United Methodist Church (F). Display/hide their locations on the map
Lakes and reservoirs: Pearsons Pond (A), Schilling Lake (B), Upper Emerald Lake (C), Upper Crystal Springs Reservoir (D), Lower Emerald Lake (E). Display/hide their locations on the map
Creeks: Coal Creek (A), Dry Creek (B), Martin Creek (C), Sausal Creek (D), Weeks Creek (E), Spanish Ranch Creek (F), Alambique Creek (G), Laguna Creek (H). Display/hide their locations on the map
Parks in zip code 94062 include: Searsville Historical Marker (1), Stafford Park (2), Wellesley Park (3), Burleigh Murray Ranch State Park (4), Dave Beeger Park (5), Edgewood County Park (6), El Corte De Madera Open Space (7), Garrett Park (8), Pulgas Ridge Open Space Preserve (9). Display/hide their locations on the map
4,839 married couples with children.
496 single-parent households (140 men, 356 women).
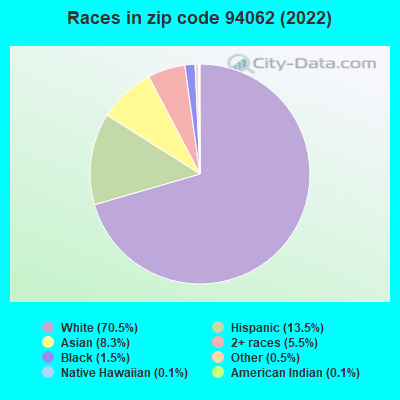
81.8% of residents of 94062 zip code speak English at home.
6.2% of residents speak Spanish at home (81% very well, 12% well, 7% not well).
7.4% of residents speak other Indo-European language at home (82% very well, 13% well, 5% not well).
3.7% of residents speak Asian or Pacific Island language at home (72% very well, 25% well, 3% not well).
0.7% of residents speak other language at home (72% very well, 28% well).
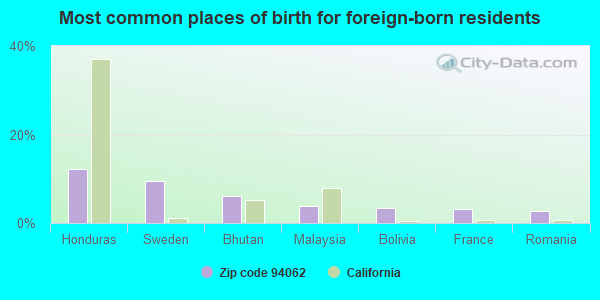
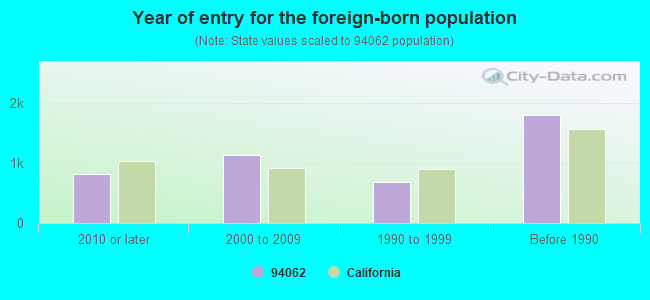
Foreign born population: 4,227 (16.1%) (58.8% of them are naturalized citizens)
Facilities with environmental interests located in this zip code:
CALTRANS DISTRICT 4 (5055 FARMHILL BLVD in WOODSIDE, CA) . Federal Facility
STATE MASTER (California - Hazardous Waste Tracking) - HAZARDOU WASTE PROGRAM Small Quantity Generators, between 100 kg and 1000 kg of hazardous waste/month (Resource Conservation and Recovery Act (tracking hazardous waste)) - notification Organizations: STATE OF CALIFORNIA (CONTACT/OWNER)
Alternative names: WOODSIDE MAINTENANCE STATION
GILL (JOHN) ELEMENTARY (555 AVE. DEL ORA in REDWOOD CITY, CA)
(National Center for Education Statistics) - STATE ID-6044523 Organizations: REDWOOD CITY ELEMENTARY (SCHOOL DISTRICT)
MCKINLEY INSTITUTE OF TECHNOLOGY (400 DUANE ST. in REDWOOD CITY, CA)
(National Center for Education Statistics) - STATE ID-6044556 Organizations: REDWOOD CITY ELEMENTARY (SCHOOL DISTRICT)
NORTH STAR ACADEMY (ELEM) (400 DUANE ST. in REDWOOD CITY, CA)
(National Center for Education Statistics) - STATE ID-6115026 Organizations: REDWOOD CITY ELEMENTARY (SCHOOL DISTRICT)
CHEVRON USA INC SERV STA (2950 WOODSIDE RD in WOODSIDE, CA)
(Resource Conservation and Recovery Act (tracking hazardous waste))
ENNOSAFE CLEANING PRODUCTS (3005 SUNNY RD in REDWOOD CITY, CA)
COMPLIANCE ACTIVITY (Tracking inspections of insecticide, fungicide, and rodenticide, and toxic substances)
LANGLEY HILL QUARRY (19500 SKYLINE BLVD in WOODSIDE, CA)
CRITERIA AND HAZARDOUS AIR POLLUTANT INVENTORY (Inventory of air pollution sources) Business SIC classification: ASPHALT PAVING MIXTURES AND BLOCKS
Housing units lacking complete plumbing facilities: 0.6% Housing units lacking complete kitchen facilities: 0.9%
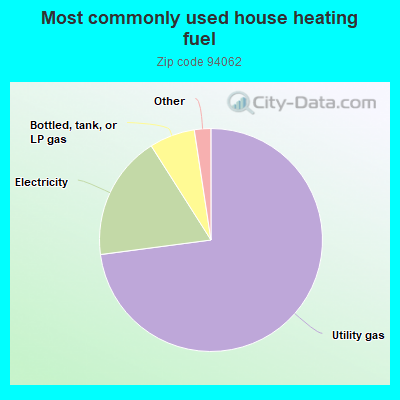
73.0%Utility gas
18.1%Electricity
6.6%Bottled, tank, or LP gas
0.9%Solar energy
0.5%Other fuel
0.5%Wood
Population in 1990: 24,947. Population change in the 1990s: +616 (+2.5%).
Place of birth for U.S.-born residents:
This state: 15,065
Northeast: 2,025
Midwest: 1,904
South: 1,423
West: 1,307
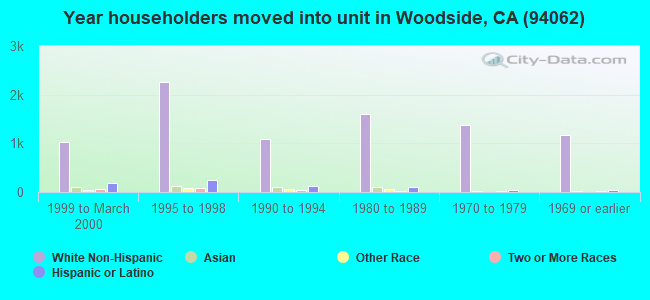
63% of the 94062 zip code residents lived in the same house 5 years ago. Out of people who lived in different houses, 60% lived in this county. Out of people who lived in different counties, 50% lived in California.
89% of the 94062 zip code residents lived in the same house 1 year ago. Out of people who lived in different houses, 38% moved from this county. Out of people who lived in different houses, 37% moved from different county within same state. Out of people who lived in different houses, 21% moved from different state. Out of people who lived in different houses, 5% moved from abroad.
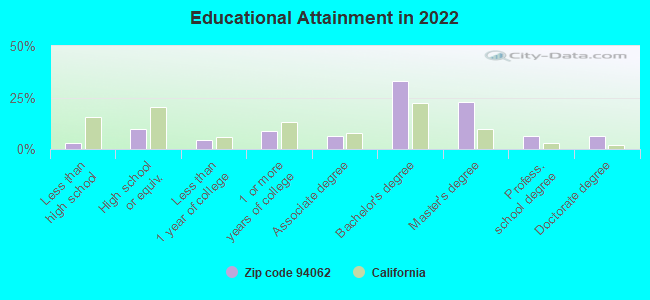
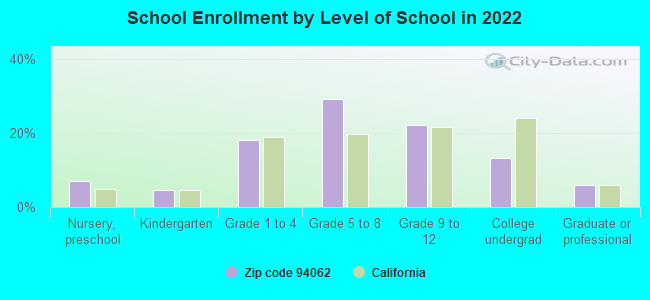
Private vs. public school enrollment:
Students in private schools in grades 1 to 8 (elementary and middle school): 1,143
Here:
39.8%
California:
10.5%
Students in private schools in grades 9 to 12 (high school): 447
Here:
34.3%
California:
8.5%
Students in private undergraduate colleges: 253
Here:
32.3%
California:
15.9%
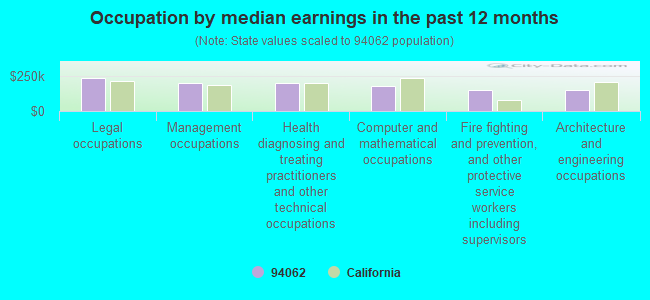
Occupation by median earnings in the past 12 months ($)
237,352Legal occupations
200,175Management occupations
197,889Health diagnosing and treating practitioners and other technical occupations
181,441Computer and mathematical occupations
151,082Fire fighting and prevention, and other protective service workers including supervisors
146,677Architecture and engineering occupations
Companies with federal contracts located in this zip code:
PRIMATE PRODUCTS, INC (11 STARWOOD ROAD in WOODSIDE, CA; small business) : $3,148,950 in 34 contractsfrom 2002 to 2006
Contracts for Live Animals, Not Raised for Food, Miscellaneous Items, Veterinary/Animal Care Services, Inspection Services (including commercial testing and lab services, except medical/dental) -- Live Animals, and moreby Army, National Institutes of Health, Uniformed Services University of the Health Sciences, Centers for Disease Control and Prevention, and others Signed by year:2000: $0; 2001: $0; 2002: $379,955; 2003: $230,108; 2004: $959,907; 2005: $1,503,668; 2006: $75,312.
Biggest contracts:
$909,390 with Army for Live Animals, Not Raised for Food. Taking place in MD. Signed on 2005-09-20. Completion date: 2006-04-26.
$364,483 with Army for Live Animals, Not Raised for Food. Taking place in FL. Signed on 2004-07-20. Completion date: 2005-09-14.
$250,270, same as above.Signed on 2002-09-30. Completion date: 2002-10-30.
$210,600, same as above.Signed on 2004-05-18. Completion date: 2005-05-17.
MARK MOORE ( in REDWOOD CITY, CA; small business) : $108,900 in 2 contractsfrom 2005 to 2006
$99,000 with National Institutes of Health for Other Professional Services. Taking place in MD. Signed on 2006-03-23. Effective on 2006-05-02. Completion date: 2006-11-01.
$9,900, same as above.Signed on 2005-11-03. Effective on 2005-11-01. Completion date: 2006-05-01.
ENTERPRISE RENT-A-CAR COMPANY (345 EL CAMINO REAL in REDWOOD CITY, CA)
$58,880 with Army for Passenger Motor Vehicles. Signed on 2000-06-20. Completion date: 2000-08-01.
MICRO PHASE PRODUCTS, INC (5 BARRETT DR in REDWOOD CITY, CA; small business)
$6,750 with Army for Converters, Electrical, Rotating. Signed on 2004-09-24. Completion date: 2004-10-22.
IKEDA, DEBRA M (2995 WOODSIDE RD SUITE 400 in REDWOOD CITY, CA; small business)
$1,774 with Army for Nursing Services. Taking place in HI. Signed on 2004-02-20. Completion date: 2004-02-20.
MMA PARTNERS, LLC (135 WOODSIDE DRIVE in WOODSIDE, CA; small business) : $0 in 2 contractsfrom 2000 to 2001
$60,300 with Navy for ADP Software. Signed on 2000-09-29. Completion date: 2000-12-30.
-$60,300, same as above.Signed on 2001-09-06. Completion date: 2001-11-20.
Top industries in this zip code by the number of employees in 2005:
Health Care and Social Assistance: General Medical and Surgical Hospitals (500-999 employees: 1 establishment)
Finance and Insurance: Portfolio Management (250-499: 1, 1-4: 5)
Health Care and Social Assistance: Offices of Physicians (except Mental Health Specialists) (20-49: 3, 10-19: 8, 5-9: 11, 1-4: 32)
Health Care and Social Assistance: Offices of Dentists (10-19: 2, 5-9: 17, 1-4: 17)
Health Care and Social Assistance: Residential Mental Health and Substance Abuse Facilities (100-249: 1, 10-19: 1)
2005 - 2018 National Fire Incident Reporting System (NFIRS) incidents
According to the data from the years 2005 - 2018 the average number of fires per year is 94. The highest number of reported fire incidents - 172 took place in 2008, and the least - 30 in 2012. The data has an increasing trend.
When looking into fire subcategories, the most incidents belonged to: Structure Fires (41.0%), and Outside Fires (34.8%).
Fire incident types reported to NFIRS in Zip Code 94062


 Nearest zip codes: 94061, 94070, 94074, 94028, 94027, 94002.


 . Federal Facility
 According to the data from the years 2005 - 2018 the average number of fires per year is 94. The highest number of reported fire incidents - 172 took place in 2008, and the least - 30 in 2012. The data has an increasing trend.
 When looking into fire subcategories, the most incidents belonged to: Structure Fires (41.0%), and Outside Fires (34.8%).