Estimated zip code population in 2022: 58,423 Zip code population in 2010: 54,293 Zip code population in 2000: 50,051
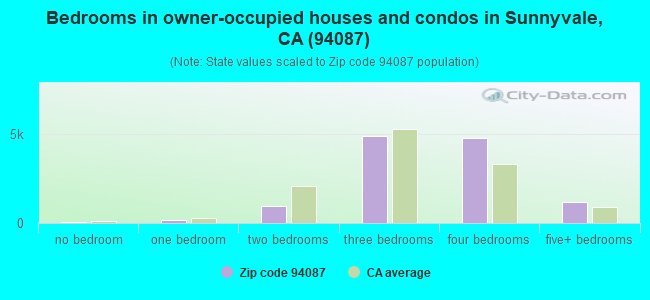
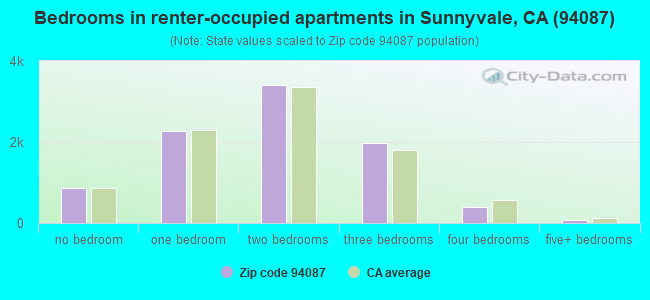
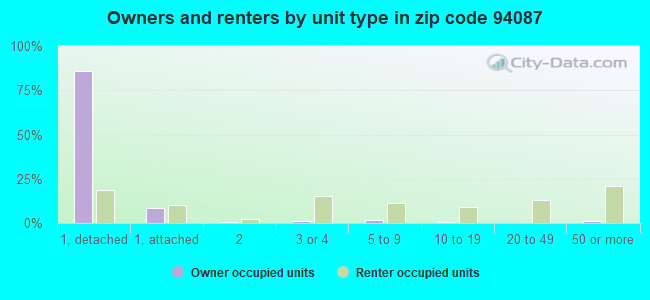
Houses and condos: 21,791 Renter-occupied apartments: 9,006
% of renters here:
43%
State:
44%
March 2022 cost of living index in zip code 94087: 127.1 (high, U.S. average is 100)
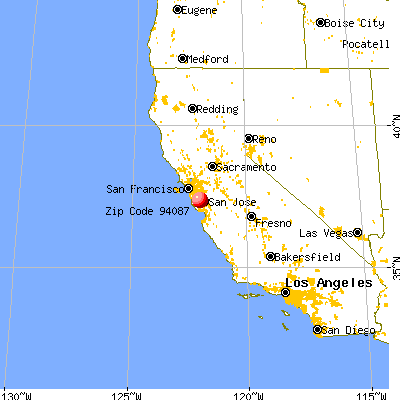
Land area: 6.6 sq. mi. Water area: 0.0 sq. mi.
Population density: 8,876 people per square mile
(high).
OSM Map
General Map
Google Map
MSN Map
OSM Map
General Map
Google Map
MSN Map
OSM Map
General Map
Google Map
MSN Map
OSM Map
General Map
Google Map
MSN Map
Please wait while loading the map...
Real estate property taxes paid for housing units in 2022:
This zip code:
0.5% ($10,228)
California:
0.7% ($4,831)
Median real estate property taxes paid for housing units with mortgages in 2022: $10,330 (0.5%) Median real estate property taxes paid for housing units with no mortgage in 2022: $6,082 (0.3%)
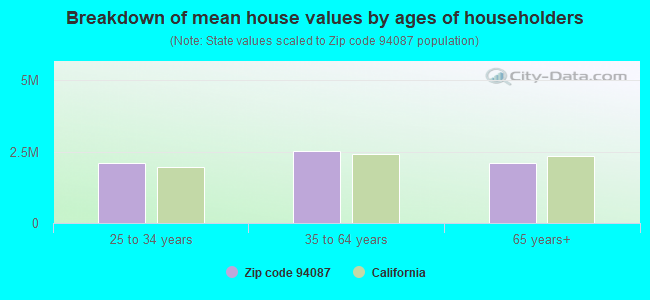
Estimated median house/condo value in 2022: $2,171,698
94087:
$2,171,698
California:
$715,900
According to our research of California and other state lists, there were 25 registered sex offenders living in 94087 zip code as of April 27, 2024. The ratio of all residents to sex offenders in zip code 94087 is 2,272 to 1. The ratio of registered sex offenders to all residents in this zip code is much lower than the state average.
Median resident age:
This zip code:
38.5 years
California median age:
37.9 years
Average household size:
This zip code:
2.8 people
California:
2.8 people
Averages for the 2020 tax year for zip code 94087, filed in 2021:
Average Adjusted Gross Income (AGI) in 2020: $258,717 (Individual Income Tax Returns)
Here:
$258,717
State:
$95,910
Salary/wage: $249,545 (reported on 80.8% of returns)
Here:
$249,545
State:
$77,331
(% of AGI for various income ranges: 1191.5% for AGIs below $25k, 3882.6% for AGIs $25k-50k, 6849.6% for AGIs $50k-75k, 10380.7% for AGIs $75k-100k, 20127.3% for AGIs $100k-200k, 189380.3% for AGIs over 200k)
Taxable interest for individuals: $2,503 (reported on 60.8% of returns)
This zip code:
$2,503
California:
$2,294
(% of AGI for various income ranges: 64.6% for AGIs below $25k, 91.7% for AGIs $25k-50k, 136.5% for AGIs $50k-75k, 187.8% for AGIs $75k-100k, 296.9% for AGIs $100k-200k, 1054.8% for AGIs over 200k)
Ordinary dividends: $10,448 (reported on 56.0% of returns)
Here:
$10,448
State:
$10,949
(% of AGI for various income ranges: 101.7% for AGIs below $25k, 195.8% for AGIs $25k-50k, 365.0% for AGIs $50k-75k, 551.8% for AGIs $75k-100k, 957.5% for AGIs $100k-200k, 4723.8% for AGIs over 200k)
Net capital gain/loss in AGI: +$53,414 (reported on 55.0% of returns)
Here:
+$53,414
State:
+$49,306
(% of AGI for various income ranges: 54.7% for AGIs below $25k, 204.2% for AGIs $25k-50k, 335.3% for AGIs $50k-75k, 469.5% for AGIs $75k-100k, 1235.3% for AGIs $100k-200k, 30831.1% for AGIs over 200k)
Profit/loss from business: +$23,075 (reported on 15.0% of returns)
Here:
+$23,075
State:
+$15,671
(% of AGI for various income ranges: 196.1% for AGIs below $25k, 328.4% for AGIs $25k-50k, 303.0% for AGIs $50k-75k, 397.5% for AGIs $75k-100k, 647.2% for AGIs $100k-200k, 2303.2% for AGIs over 200k)
Taxable individual retirement arrangement distribution: $28,532 (reported on 10.9% of returns)
94087:
$28,532
California:
$23,505
(% of AGI for various income ranges: 86.7% for AGIs below $25k, 236.6% for AGIs $25k-50k, 426.5% for AGIs $50k-75k, 702.8% for AGIs $75k-100k, 1148.2% for AGIs $100k-200k, 1320.0% for AGIs over 200k)
Self-employed (Keogh) retirement plans: $29,448 (reported on 1.9% of returns)
94087:
$29,448
California:
$30,163
(% of AGI for various income ranges: 8.8% for AGIs below $25k, 45.0% for AGIs $50k-75k, 77.2% for AGIs $100k-200k, 493.1% for AGIs over 200k)
Total itemized deductions: $40,665 (reported on 23.7% of returns)
Here:
$40,665
State:
$39,517
(% of AGI for various income ranges: 167.9% for AGIs below $25k, 329.1% for AGIs $25k-50k, 508.1% for AGIs $50k-75k, 931.8% for AGIs $75k-100k, 1442.3% for AGIs $100k-200k, 7958.4% for AGIs over 200k)
Charity contributions: $12,389 (reported on 19.6% of returns)
Here:
$12,389
State:
$12,598
(% of AGI for various income ranges: 4.7% for AGIs below $25k, 29.2% for AGIs $25k-50k, 69.4% for AGIs $50k-75k, 115.9% for AGIs $75k-100k, 271.1% for AGIs $100k-200k, 2281.0% for AGIs over 200k)
Taxes paid: $9,440 (reported on 23.6% of returns)
94087:
$9,440
State:
$8,807
(% of AGI for various income ranges: 30.2% for AGIs below $25k, 68.9% for AGIs $25k-50k, 109.9% for AGIs $50k-75k, 219.9% for AGIs $75k-100k, 406.6% for AGIs $100k-200k, 1780.6% for AGIs over 200k)
Earned income credit: $1,335 (reported on 4.0% of returns)
Here:
$1,335
State:
$2,074
(% of AGI for various income ranges: 32.8% for AGIs below $25k, 30.7% for AGIs $25k-50k)
Percentage of individuals using paid preparers for their 2020 taxes: 90.9%
Here:
91%
State:
92%
(% for various income ranges: 86.7% for AGIs below $25k, 90.0% for AGIs $25k-50k, 91.2% for AGIs $50k-75k, 89.7% for AGIs $75k-100k, 90.6% for AGIs $100k-200k, 93.7% for AGIs over 200k)
Averages for the 2012 tax year for zip code 94087, filed in 2013:
Average Adjusted Gross Income (AGI) in 2012: $140,123 (Individual Income Tax Returns)
Here:
$140,123
State:
$72,726
Salary/wage: $136,542 (reported on 81.5% of returns)
Here:
$136,542
State:
$59,079
(% of AGI for various income ranges: 71.1% for AGIs below $25k, 71.7% for AGIs $25k-50k, 71.1% for AGIs $50k-75k, 70.6% for AGIs $75k-100k, 81.0% for AGIs $100k-200k, 81.0% for AGIs over 200k)
Taxable interest for individuals: $1,623 (reported on 60.9% of returns)
This zip code:
$1,623
California:
$2,146
(% of AGI for various income ranges: 2.4% for AGIs below $25k, 1.5% for AGIs $25k-50k, 1.1% for AGIs $50k-75k, 1.1% for AGIs $75k-100k, 0.7% for AGIs $100k-200k, 0.5% for AGIs over 200k)
Ordinary dividends: $7,021 (reported on 47.4% of returns)
Here:
$7,021
State:
$9,308
(% of AGI for various income ranges: 4.9% for AGIs below $25k, 3.3% for AGIs $25k-50k, 3.0% for AGIs $50k-75k, 3.1% for AGIs $75k-100k, 2.3% for AGIs $100k-200k, 2.2% for AGIs over 200k)
Net capital gain/loss in AGI: +$17,472 (reported on 45.5% of returns)
Here:
+$17,472
State:
+$30,460
(% of AGI for various income ranges: 0.7% for AGIs $25k-50k, 0.8% for AGIs $50k-75k, 0.9% for AGIs $75k-100k, 1.1% for AGIs $100k-200k, 8.8% for AGIs over 200k)
Profit/loss from business: +$26,250 (reported on 15.8% of returns)
Here:
+$26,250
State:
+$17,064
(% of AGI for various income ranges: 11.4% for AGIs below $25k, 5.0% for AGIs $25k-50k, 3.6% for AGIs $50k-75k, 4.5% for AGIs $75k-100k, 3.5% for AGIs $100k-200k, 2.2% for AGIs over 200k)
Taxable individual retirement arrangement distribution: $22,843 (reported on 13.2% of returns)
94087:
$22,843
California:
$19,557
(% of AGI for various income ranges: 5.4% for AGIs below $25k, 5.3% for AGIs $25k-50k, 5.2% for AGIs $50k-75k, 4.7% for AGIs $75k-100k, 2.9% for AGIs $100k-200k, 1.1% for AGIs over 200k)
Self-employment retirement plans: $22,381 (reported on 2.1% of returns)
94087:
$22,381
California:
$24,530
(% of AGI for various income ranges: 0.3% for AGIs $25k-50k, 0.1% for AGIs $50k-75k, 0.3% for AGIs $75k-100k, 0.4% for AGIs $100k-200k, 0.3% for AGIs over 200k)
Total itemized deductions: $40,251 (18% of AGI, reported on 51.7% of returns)
Here:
$40,251
State:
$34,004
Here:
17.7% of AGI
State:
22.7% of AGI
(% of AGI for various income ranges: 16.6% for AGIs below $25k, 11.6% for AGIs $25k-50k, 12.4% for AGIs $50k-75k, 13.2% for AGIs $75k-100k, 15.8% for AGIs $100k-200k, 15.0% for AGIs over 200k)
Charity contributions: $3,920 (reported on 42.5% of returns)
Here:
$3,920
State:
$4,659
(% of AGI for various income ranges: 0.8% for AGIs below $25k, 0.9% for AGIs $25k-50k, 1.2% for AGIs $50k-75k, 1.3% for AGIs $75k-100k, 1.5% for AGIs $100k-200k, 1.1% for AGIs over 200k)
Taxes paid: $22,972 (reported on 51.6% of returns)
94087:
$22,972
State:
$14,448
(% of AGI for various income ranges: 3.2% for AGIs below $25k, 3.1% for AGIs $25k-50k, 3.6% for AGIs $50k-75k, 5.1% for AGIs $75k-100k, 7.7% for AGIs $100k-200k, 9.9% for AGIs over 200k)
Earned income credit: $1,657 (reported on 5.8% of returns)
Here:
$1,657
State:
$2,286
(% of AGI for various income ranges: 3.0% for AGIs below $25k, 0.5% for AGIs $25k-50k)
Percentage of individuals using paid preparers for their 2012 taxes: 48.8%
Here:
49%
State:
64%
(% for various income ranges: 45.9% for AGIs below $25k, 52.8% for AGIs $25k-50k, 53.8% for AGIs $50k-75k, 52.2% for AGIs $75k-100k, 46.9% for AGIs $100k-200k, 47.6% for AGIs over 200k)
Averages for the 2004 tax year for zip code 94087, filed in 2005:
Average Adjusted Gross Income (AGI) in 2004: $96,486 (Individual Income Tax Returns)
Here:
$96,486
State:
$58,600
Salary/wage: $92,757 (reported on 80.1% of returns)
Here:
$92,757
State:
$49,455
(% of AGI for various income ranges: 298.5% for AGIs below $10k, 64.2% for AGIs $10k-25k, 71.9% for AGIs $25k-50k, 71.4% for AGIs $50k-75k, 79.2% for AGIs $75k-100k, 77.6% for AGIs over 100k)
Taxable interest for individuals: $2,079 (reported on 68.8% of returns)
This zip code:
$2,079
California:
$2,365
(% of AGI for various income ranges: 34.2% for AGIs below $10k, 4.8% for AGIs $10k-25k, 2.7% for AGIs $25k-50k, 2.1% for AGIs $50k-75k, 1.5% for AGIs $75k-100k, 1.1% for AGIs over 100k)
Taxable dividends: $3,741 (reported on 48.9% of returns)
Here:
$3,741
State:
$4,746
(% of AGI for various income ranges: 29.9% for AGIs below $10k, 4.2% for AGIs $10k-25k, 2.7% for AGIs $25k-50k, 2.5% for AGIs $50k-75k, 1.7% for AGIs $75k-100k, 1.6% for AGIs over 100k)
Net capital gain/loss: +$16,831 (reported on 46.7% of returns)
Here:
+$16,831
State:
+$23,418
(% of AGI for various income ranges: -13.9% for AGIs below $10k, 0.8% for AGIs $10k-25k, 0.7% for AGIs $25k-50k, 1.0% for AGIs $50k-75k, 1.0% for AGIs $75k-100k, 10.8% for AGIs over 100k)
Profit/loss from business: +$21,255 (reported on 15.9% of returns)
Here:
+$21,255
State:
+$16,826
(% of AGI for various income ranges: -1.1% for AGIs below $10k, 7.2% for AGIs $10k-25k, 5.3% for AGIs $25k-50k, 4.7% for AGIs $50k-75k, 4.0% for AGIs $75k-100k, 3.0% for AGIs over 100k)
IRA payment deduction: $3,470 (reported on 4.6% of returns)
94087:
$3,470
California:
$3,192
(% of AGI for various income ranges: 1.3% for AGIs below $10k, 0.4% for AGIs $10k-25k, 0.4% for AGIs $25k-50k, 0.3% for AGIs $50k-75k, 0.3% for AGIs $75k-100k, 0.1% for AGIs over 100k)
Self-employed pension: $14,972 (reported on 2.6% of returns)
Here:
$14,972
California:
$17,688
(% of AGI for various income ranges: 1.3% for AGIs below $10k, 0.3% for AGIs $25k-50k, 0.3% for AGIs $50k-75k, 0.4% for AGIs $75k-100k, 0.4% for AGIs over 100k)
Total itemized deductions: $30,203 (19% of AGI, reported on 50.2% of returns)
Here:
$30,203
State:
$28,113
Here:
19.4% of AGI
State:
25.3% of AGI
(% of AGI for various income ranges: 84.2% for AGIs below $10k, 17.3% for AGIs $10k-25k, 13.1% for AGIs $25k-50k, 14.7% for AGIs $50k-75k, 15.9% for AGIs $75k-100k, 15.8% for AGIs over 100k)
Charity contributions deductions: $3,295 (2% of AGI, reported on 44.2% of returns)
Here:
$3,295
State:
$3,923
Here:
2.0% of AGI
State:
3.3% of AGI
(% of AGI for various income ranges: 3.2% for AGIs below $10k, 1.3% for AGIs $10k-25k, 1.3% for AGIs $25k-50k, 1.6% for AGIs $50k-75k, 1.6% for AGIs $75k-100k, 1.5% for AGIs over 100k)
Total tax: $18,479 (reported on 85.4% of returns)
94087:
$18,479
State:
$10,761
(% of AGI for various income ranges: 10.3% for AGIs below $10k, 4.7% for AGIs $10k-25k, 8.2% for AGIs $25k-50k, 11.1% for AGIs $50k-75k, 12.1% for AGIs $75k-100k, 18.6% for AGIs over 100k)
Earned income credit: $1,218 (reported on 4.5% of returns)
Here:
$1,218
State:
$1,763
Percentage of individuals using paid preparers for their 2004 taxes: 47.8%
Here:
48%
State:
66%
(% for various income ranges: 42.2% for AGIs below $10k, 51.4% for AGIs $10k-25k, 51.1% for AGIs $25k-50k, 50.8% for AGIs $50k-75k, 45.1% for AGIs $75k-100k, 46.6% for AGIs over 100k)
Likely homosexual households (counted as self-reported same-sex unmarried-partner households)
Lesbian couples: 0.0% of all households
Gay men: 0.1% of all households
Household received Food Stamps/SNAP in the past 12 months: 535 Household did not receive Food Stamps/SNAP in the past 12 months: 19,925
Women who had a birth in the past 12 months: 559 (484 now married, 73 unmarried) Women who did not have a birth in the past 12 months: 13,405 (7,435 now married, 5,881 unmarried)
Housing units in zip code 94087 with a mortgage: 7,313 (938 second mortgage, 14 home equity loan, 723 both second mortgage and home equity loan) Houses without a mortgage: 76
Median monthly owner costs for units with a mortgage: $3,876 Median monthly owner costs for units without a mortgage: $971
Residents with income below the poverty level in 2022:
This zip code:
4.1%
Whole state:
12.2%
Residents with income below 50% of the poverty level in 2022:
This zip code:
1.9%
Whole state:
6.2%
Median number of rooms in houses and condos:
Here:
6.1
State:
6.0
Median number of rooms in apartments:
Here:
3.7
State:
3.9
Notable locations in this zip code not listed on our city pages
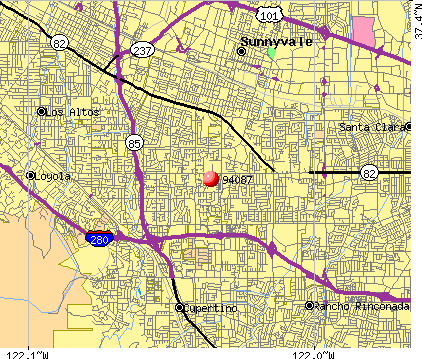
Notable locations in zip code 94087: Sunnyvale Department of Public Safety Station 3 (A), Sunnyvale Community Center (B). Display/hide their locations on the map
Shopping Centers: Paolina Plaza Shopping Center (1), La Hacienda Shopping Center (2), Holiday Center Shopping Center (3), Fremont Corners Shopping Center (4), Sunnyvale Shopping Center (5), Westmoor Village Shopping Center (6), De Anza Square Shopping Center (7), Oakmont Square Shopping Center (8), Loehmanns Plaza Shopping Center (9). Display/hide their locations on the map
Churches in zip code 94087 include: Church of Christ (A), First Orthodox Presbyterian Church (B), Kingdom Hall of Jehovahs Witnesses (C), Saint Johns Lutheran Church (D), United Pentecostal Church of Sunnyvale (E), Unity Missionary Baptist Church (F), The Church of Jesus Christ of Latter Day Saints (G), Church of the Nazarene (H), Church of Resurrection (I). Display/hide their locations on the map
Parks in zip code 94087 include: De Anza Park (1), Mango Park (2), San Antonio Park (3), Serra Park (4), Las Palmas Park (5), Sunnyvale Tennis Center (6), Ortega Park (7), Panama Park (8), Raynor Park (9). Display/hide their locations on the map
11,857 married couples with children.
1,571 single-parent households (425 men, 1,146 women).
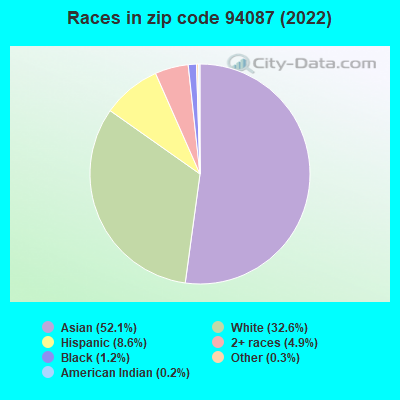
43.1% of residents of 94087 zip code speak English at home.
6.5% of residents speak Spanish at home (77% very well, 17% well, 6% not well).
14.8% of residents speak other Indo-European language at home (80% very well, 15% well, 4% not well, 1% not at all).
31.3% of residents speak Asian or Pacific Island language at home (67% very well, 21% well, 10% not well, 2% not at all).
5.2% of residents speak other language at home (85% very well, 6% well, 7% not well, 2% not at all).
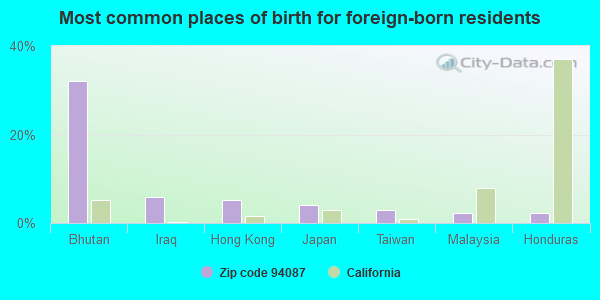
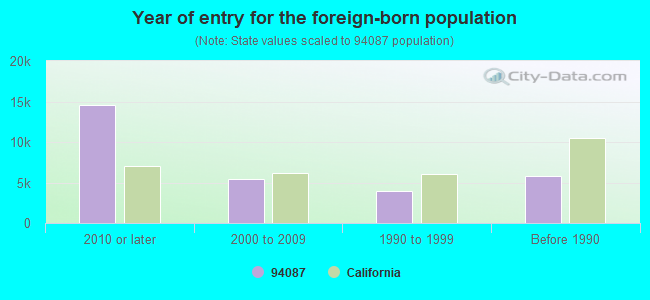
Foreign born population: 27,401 (46.9%) (43.3% of them are naturalized citizens)
Major facilities with environmental interests located in this zip code:
JIFFY LUBE (999 W. EL CAMINO REAL in SUNNYVALE, CA)
Small Quantity Generators, between 100 kg and 1000 kg of hazardous waste/month (Resource Conservation and Recovery Act (tracking hazardous waste)) STATE MASTER (California - Used Oil Recycling System ) - USED OIL RECYCLING, USED OIL PROGRAM Alternative names: JIFFY LUBE #295
LONGS DRUG STORE NO 70 (576 E EL CAMINO REAL in SUNNYVALE, CA)
STATE MASTER (California - Hazardous Waste Tracking) - HAZARDOU WASTE PROGRAM Small Quantity Generators, between 100 kg and 1000 kg of hazardous waste/month (Resource Conservation and Recovery Act (tracking hazardous waste)) - notification Organizations: LONGS DRUG STORES CAL (CONTACT/OWNER)
Alternative names: LONGS DRUG STORE #70
FREMONT HIGH SCHOOL (1278 SUNNYVALE-SARATOGA RD in SUNNYVALE, CA)
STATE MASTER (California - Hazardous Waste Tracking) - HAZARDOU WASTE PROGRAM Small Quantity Generators, between 100 kg and 1000 kg of hazardous waste/month (Resource Conservation and Recovery Act (tracking hazardous waste)) Alternative names: FUHSD - FREMONT HIGH SCHOOL
LONGS DRUG STORE NO 198 (1675 HOLLENBECK AVE in SUNNYVALE, CA)
STATE MASTER (California - Hazardous Waste Tracking) - HAZARDOU WASTE PROGRAM Small Quantity Generators, between 100 kg and 1000 kg of hazardous waste/month (Resource Conservation and Recovery Act (tracking hazardous waste)) - notification Organizations: LONGS DRUG STORES C A (CONTACT/OWNER)
Alternative names: LONGS DRUG STORE #198
NIMITZ ELEMENTARY (545 E. CHEYENNE DR. in SUNNYVALE, CA)
(National Center for Education Statistics) - STATE ID-6046742 Organizations: CUPERTINO UNION SCHOOL (SCHOOL DISTRICT)
CHERRY CHASE ELEMENTARY (1138 HEATHERSTONE WAY in SUNNYVALE, CA)
(National Center for Education Statistics) - STATE ID-6049167 Organizations: SUNNYVALE ELEMENTARY (SCHOOL DISTRICT)
FREMONT HIGH (1279 SUNNYVALE-SARATOGA in SUNNYVALE, CA)
(National Center for Education Statistics) - STATE ID-4332474 Organizations: FREMONT UNION HIGH (SCHOOL DISTRICT)
ISK MOUNTAINVIEW RESEARCH CENTER (1195 WEST FREMONT AVENUE in SUNNYVALE, CA)
(Resource Conservation and Recovery Act (tracking hazardous waste)) Organizations: ISKMOUNTAINVIEW RESEARCH CENTER (CONTACT/OWNER)
GESTETNER CORP (510 E EL CAMINO REAL in SUNNYVALE, CA)
(Resource Conservation and Recovery Act (tracking hazardous waste)) Organizations: MARDESICH CO (CONTACT/OWNER)
LOCKHEED MISSILES & SPACE CO (270 CARIBBIAN DR BLDG 587 in SUNNYVALE, CA)
(Resource Conservation and Recovery Act (tracking hazardous waste)) Organizations: LOCKHEED M&S CO (CONTACT/OWNER)
BAES HOLIDAY CLEANERS (820 W EL CAMINO REAL in SUNNYVALE, CA)
CRITERIA AND HAZARDOUS AIR POLLUTANT INVENTORY (Inventory of air pollution sources) Small Quantity Generators, between 100 kg and 1000 kg of hazardous waste/month (Resource Conservation and Recovery Act (tracking hazardous waste)) - notification Business SIC classification: DRYCLEANING PLANTS, EXCEPT RUG CLEANING Organizations: BAE HYUNG SAM (CONTACT/OWNER)
LLOYDS CLEANERS (526 SOUTH MURPHY AVENUE in SUNNYVALE, CA)
CRITERIA AND HAZARDOUS AIR POLLUTANT INVENTORY (Inventory of air pollution sources) Small Quantity Generators, between 100 kg and 1000 kg of hazardous waste/month (Resource Conservation and Recovery Act (tracking hazardous waste)) - notification Business SIC classification: DRYCLEANING PLANTS, EXCEPT RUG CLEANING Organizations: CHONG HO LEE AND YOUNG LEE (CONTACT/OWNER)
ACC U TUNE & BRAKE (1004 W EL CAMINO REAL in SUNNYVALE, CA)
Small Quantity Generators, between 100 kg and 1000 kg of hazardous waste/month (Resource Conservation and Recovery Act (tracking hazardous waste)) - notification Organizations: ROCKY PARIS (CONTACT/OWNER)
Housing units lacking complete plumbing facilities: 0.5% Housing units lacking complete kitchen facilities: 1.2%
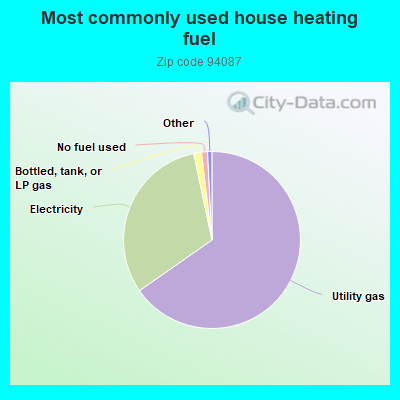
65.3%Utility gas
31.4%Electricity
1.4%Bottled, tank, or LP gas
1.1%No fuel used
Population in 1990: 47,813. Population change in the 1990s: +2,238 (+4.7%).
Place of birth for U.S.-born residents:
This state: 21,426
Northeast: 2,481
Midwest: 2,914
South: 1,912
West: 1,400
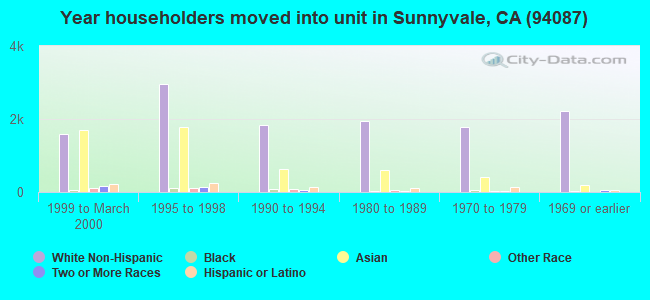
62% of the 94087 zip code residents lived in the same house 5 years ago. Out of people who lived in different houses, 61% lived in this county. Out of people who lived in different counties, 50% lived in California.
86% of the 94087 zip code residents lived in the same house 1 year ago. Out of people who lived in different houses, 58% moved from this county. Out of people who lived in different houses, 12% moved from different county within same state. Out of people who lived in different houses, 9% moved from different state. Out of people who lived in different houses, 21% moved from abroad.
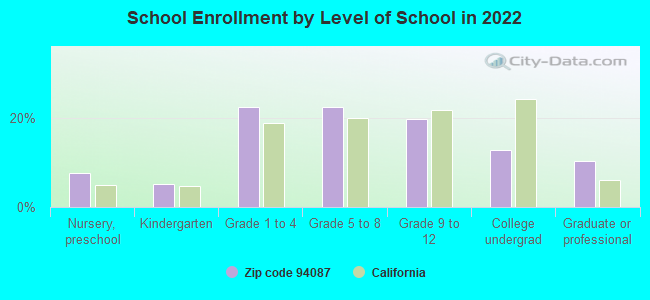
Private vs. public school enrollment:
Students in private schools in grades 1 to 8 (elementary and middle school): 1,201
Here:
17.6%
California:
10.5%
Students in private schools in grades 9 to 12 (high school): 357
Here:
12.0%
California:
8.5%
Students in private undergraduate colleges: 290
Here:
15.2%
California:
15.9%
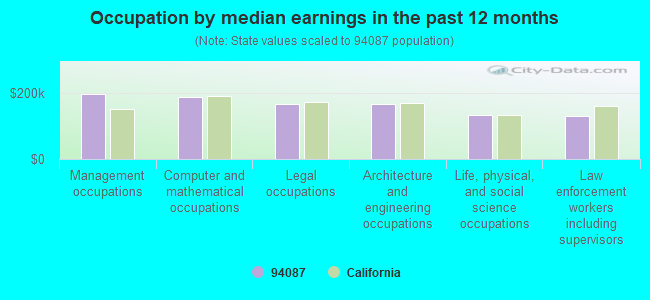
Occupation by median earnings in the past 12 months ($)
197,176Management occupations
185,651Computer and mathematical occupations
167,200Legal occupations
164,955Architecture and engineering occupations
131,840Life, physical, and social science occupations
129,527Law enforcement workers including supervisors
Companies with federal contracts located in this zip code (SUNNYVALE, CA):
ARCSIGHT, INC (1309 S MARY AVE; small business) : $6,257,805 in 14 contractsfrom 2004 to 2006
Contracts for Other ADP and Telecommunications Services (includes data storage on tapes, compact disks, etc.), ADP Software, Maintenance, Repair and Rebuilding of Equipment -- Automatic Data Processing Equipment (Including Firmware), Software, Supplies and Support Equipment, ADP Support Equipment, and moreby Defense Information Systems Agency, Department of Defense, U.S. Customs Service, Air Force, and others Signed by year:2000: $0; 2001: $0; 2002: $0; 2003: $0; 2004: $3,616,568; 2005: $1,530,188; 2006: $1,111,049.
Biggest contracts:
$1,815,299 with Defense Information Systems Agency for Other ADP and Telecommunications Services (includes data storage on tapes, compact disks, etc.). Taking place in VA. Signed on 2004-05-25. Completion date: 2004-05-11.
$1,100,490, same as above.Signed on 2004-01-12. Completion date: 2004-05-11.
$968,787 with Department of Defense for Other ADP and Telecommunications Services (includes data storage on tapes, compact disks, etc.). Taking place in VA. Signed on 2005-07-13. Completion date: 2004-05-11.
$780,787 with Defense Information Systems Agency for Other ADP and Telecommunications Services (includes data storage on tapes, compact disks, etc.). Taking place in VA. Signed on 2006-05-11. Completion date: 2004-05-11.
MONITOR SYSTEMS INC (690 W FREEMONT AVE STE 18; small business) : $490,383 in 2 contractsfrom 2001 to 2005
$347,783 with Navy for Programming Services. Signed on 2001-07-31. Completion date: 2003-03-31.
$142,600, same as above.Signed on 2005-09-26. Completion date: 2006-10-30.
IDZAP LLC (1443 KNOWLTON DRIVE; small business)
$99,973 with Air Force for Physical Sciences -- Management and Support (R&D). Signed on 2004-09-01. Completion date: 2005-06-30.
ALEXANDER H DELANEY (1572 BEDFORD AVE; small business)
$71,200 with Army for ADP Software. Signed on 2001-09-27. Completion date: 2002-04-30.
STRAWBERRY TREE INC (949 CASCADE DR; small business) : $36,870 in 3 contractsfrom 2004 to 2005
$19,190 with Bureau of Reclamation for Liquid and Gas Flow, Liquid Level, and Mechanical Motion Measuring Instruments. Taking place in OH. Signed on 2004-04-22. Completion date: 2004-11-01.
$17,600 with Navy for Maintenance, Repair and Rebuilding of Equipment -- Automatic Data Processing Equipment (Including Firmware), Software, Supplies and Support Equipment. Signed on 2005-04-05. Completion date: 2005-03-22.
$80, same as above.Signed on 2005-06-27. Completion date: 2005-03-22.
SCOTT-JOSHUA CORPORATION (732 GLENCOE CT; small business)
$35,425 with Air Force for Metal Heat Treating and Non-Thermal Treating Equipment. Taking place in OK. Signed on 2003-03-04. Completion date: 2003-07-31.
Top industries in this zip code by the number of employees in 2005:
2002 - 2018 National Fire Incident Reporting System (NFIRS) incidents
According to the data from the years 2002 - 2018 the average number of fire incidents per year is 41. The highest number of fire incidents - 85 took place in 2005, and the least - 0 in 2003. The data has a decreasing trend.
When looking into fire subcategories, the most incidents belonged to: Structure Fires (39.2%), and Outside Fires (36.9%).
Fire incident types reported to NFIRS in Zip Code 94087


 Nearest zip codes: 94086, 94085, 95051, 94041, 94040, 94024.


 According to the data from the years 2002 - 2018 the average number of fire incidents per year is 41. The highest number of fire incidents - 85 took place in 2005, and the least - 0 in 2003. The data has a decreasing trend.
 When looking into fire subcategories, the most incidents belonged to: Structure Fires (39.2%), and Outside Fires (36.9%).