Estimated zip code population in 2022: 25,932 Zip code population in 2010: 23,981 Zip code population in 2000: 23,373
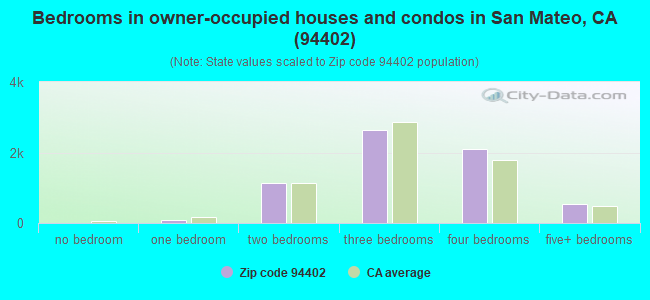
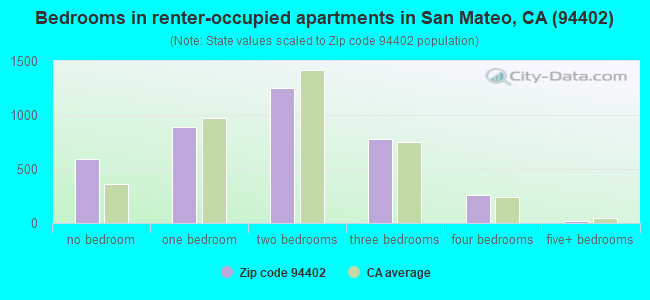
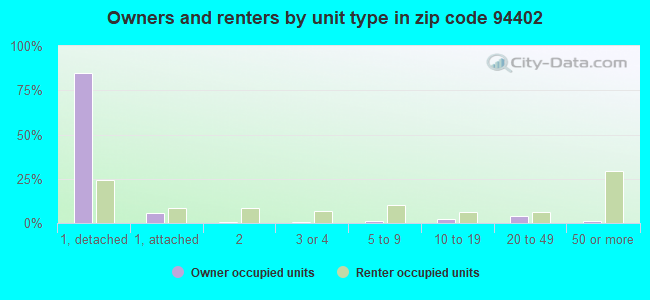
Houses and condos: 10,841 Renter-occupied apartments: 3,769
% of renters here:
37%
State:
44%
March 2022 cost of living index in zip code 94402: 135.3 (high, U.S. average is 100)
Land area: 4.9 sq. mi. Water area: 0.0 sq. mi.
Population density: 5,332 people per square mile
(average).
OSM Map
General Map
Google Map
MSN Map
OSM Map
General Map
Google Map
MSN Map
OSM Map
General Map
Google Map
MSN Map
OSM Map
General Map
Google Map
MSN Map
Please wait while loading the map...
Real estate property taxes paid for housing units in 2022:
This zip code:
0.5% ($10,292)
California:
0.7% ($4,831)
Median real estate property taxes paid for housing units with mortgages in 2022: $10,330 (0.5%) Median real estate property taxes paid for housing units with no mortgage in 2022: $7,861 (0.4%)
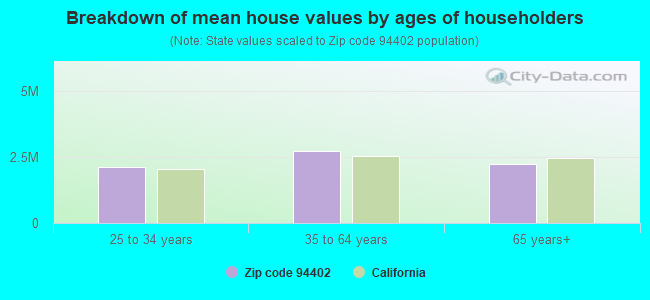
Estimated median house/condo value in 2022: $2,171,698
94402:
$2,171,698
California:
$715,900
According to our research of California and other state lists, there were 8 registered sex offenders living in 94402 zip code as of April 27, 2024. The ratio of all residents to sex offenders in zip code 94402 is 3,109 to 1. The ratio of registered sex offenders to all residents in this zip code is much lower than the state average.
Median resident age:
This zip code:
42.2 years
California median age:
37.9 years
Average household size:
This zip code:
2.5 people
California:
2.8 people
Averages for the 2020 tax year for zip code 94402, filed in 2021:
Average Adjusted Gross Income (AGI) in 2020: $337,587 (Individual Income Tax Returns)
Here:
$337,587
State:
$95,910
Salary/wage: $250,481 (reported on 75.6% of returns)
Here:
$250,481
State:
$77,331
(% of AGI for various income ranges: 1298.4% for AGIs below $25k, 4144.8% for AGIs $25k-50k, 7805.6% for AGIs $50k-75k, 10723.5% for AGIs $75k-100k, 21476.7% for AGIs $100k-200k, 233553.6% for AGIs over 200k)
Taxable interest for individuals: $5,579 (reported on 59.5% of returns)
This zip code:
$5,579
California:
$2,294
(% of AGI for various income ranges: 70.9% for AGIs below $25k, 121.2% for AGIs $25k-50k, 145.1% for AGIs $50k-75k, 209.8% for AGIs $75k-100k, 397.0% for AGIs $100k-200k, 3948.1% for AGIs over 200k)
Ordinary dividends: $25,189 (reported on 53.6% of returns)
Here:
$25,189
State:
$10,949
(% of AGI for various income ranges: 177.3% for AGIs below $25k, 222.2% for AGIs $25k-50k, 391.6% for AGIs $50k-75k, 704.6% for AGIs $75k-100k, 1365.2% for AGIs $100k-200k, 17037.7% for AGIs over 200k)
Net capital gain/loss in AGI: +$152,824 (reported on 50.9% of returns)
Here:
+$152,824
State:
+$49,306
(% of AGI for various income ranges: 90.4% for AGIs below $25k, 154.4% for AGIs $25k-50k, 324.8% for AGIs $50k-75k, 549.6% for AGIs $75k-100k, 1410.0% for AGIs $100k-200k, 112349.7% for AGIs over 200k)
Profit/loss from business: +$50,920 (reported on 19.3% of returns)
Here:
+$50,920
State:
+$15,671
(% of AGI for various income ranges: 368.5% for AGIs below $25k, 469.2% for AGIs $25k-50k, 640.7% for AGIs $50k-75k, 633.7% for AGIs $75k-100k, 1326.7% for AGIs $100k-200k, 11033.4% for AGIs over 200k)
Taxable individual retirement arrangement distribution: $33,713 (reported on 11.7% of returns)
94402:
$33,713
California:
$23,505
(% of AGI for various income ranges: 89.1% for AGIs below $25k, 206.6% for AGIs $25k-50k, 326.7% for AGIs $50k-75k, 664.4% for AGIs $75k-100k, 1415.7% for AGIs $100k-200k, 2997.5% for AGIs over 200k)
Self-employed (Keogh) retirement plans: $35,398 (reported on 4.1% of returns)
94402:
$35,398
California:
$30,163
(% of AGI for various income ranges: 90.4% for AGIs $50k-75k, 152.1% for AGIs $100k-200k, 1869.7% for AGIs over 200k)
Total itemized deductions: $58,631 (reported on 30.0% of returns)
Here:
$58,631
State:
$39,517
(% of AGI for various income ranges: 379.0% for AGIs below $25k, 501.0% for AGIs $25k-50k, 771.2% for AGIs $50k-75k, 1328.9% for AGIs $75k-100k, 2439.3% for AGIs $100k-200k, 20488.2% for AGIs over 200k)
Charity contributions: $27,240 (reported on 25.0% of returns)
Here:
$27,240
State:
$12,598
(% of AGI for various income ranges: 11.0% for AGIs below $25k, 38.4% for AGIs $25k-50k, 80.0% for AGIs $50k-75k, 148.8% for AGIs $75k-100k, 296.6% for AGIs $100k-200k, 9495.6% for AGIs over 200k)
Taxes paid: $9,355 (reported on 29.9% of returns)
94402:
$9,355
State:
$8,807
(% of AGI for various income ranges: 72.0% for AGIs below $25k, 94.7% for AGIs $25k-50k, 177.0% for AGIs $50k-75k, 327.7% for AGIs $75k-100k, 653.1% for AGIs $100k-200k, 2773.2% for AGIs over 200k)
Earned income credit: $1,430 (reported on 3.5% of returns)
Here:
$1,430
State:
$2,074
(% of AGI for various income ranges: 43.0% for AGIs below $25k, 24.8% for AGIs $25k-50k)
Percentage of individuals using paid preparers for their 2020 taxes: 92.1%
Here:
92%
State:
92%
(% for various income ranges: 87.0% for AGIs below $25k, 89.3% for AGIs $25k-50k, 91.9% for AGIs $50k-75k, 92.7% for AGIs $75k-100k, 93.8% for AGIs $100k-200k, 94.8% for AGIs over 200k)
Averages for the 2012 tax year for zip code 94402, filed in 2013:
Average Adjusted Gross Income (AGI) in 2012: $181,692 (Individual Income Tax Returns)
Here:
$181,692
State:
$72,726
Salary/wage: $151,852 (reported on 75.4% of returns)
Here:
$151,852
State:
$59,079
(% of AGI for various income ranges: 64.1% for AGIs below $25k, 68.3% for AGIs $25k-50k, 65.5% for AGIs $50k-75k, 63.1% for AGIs $75k-100k, 67.2% for AGIs $100k-200k, 61.6% for AGIs over 200k)
Taxable interest for individuals: $3,621 (reported on 58.7% of returns)
This zip code:
$3,621
California:
$2,146
(% of AGI for various income ranges: 2.9% for AGIs below $25k, 1.6% for AGIs $25k-50k, 1.7% for AGIs $50k-75k, 1.6% for AGIs $75k-100k, 1.3% for AGIs $100k-200k, 1.0% for AGIs over 200k)
Ordinary dividends: $12,378 (reported on 47.0% of returns)
Here:
$12,378
State:
$9,308
(% of AGI for various income ranges: 5.7% for AGIs below $25k, 3.7% for AGIs $25k-50k, 3.9% for AGIs $50k-75k, 4.0% for AGIs $75k-100k, 3.6% for AGIs $100k-200k, 2.9% for AGIs over 200k)
Net capital gain/loss in AGI: +$54,902 (reported on 43.4% of returns)
Here:
+$54,902
State:
+$30,460
(% of AGI for various income ranges: 0.5% for AGIs below $25k, 0.5% for AGIs $25k-50k, 0.6% for AGIs $50k-75k, 1.6% for AGIs $75k-100k, 2.1% for AGIs $100k-200k, 17.8% for AGIs over 200k)
Profit/loss from business: +$39,865 (reported on 20.7% of returns)
Here:
+$39,865
State:
+$17,064
(% of AGI for various income ranges: 15.6% for AGIs below $25k, 9.2% for AGIs $25k-50k, 6.7% for AGIs $50k-75k, 6.7% for AGIs $75k-100k, 6.4% for AGIs $100k-200k, 3.4% for AGIs over 200k)
Taxable individual retirement arrangement distribution: $28,546 (reported on 15.3% of returns)
94402:
$28,546
California:
$19,557
(% of AGI for various income ranges: 4.3% for AGIs below $25k, 3.4% for AGIs $25k-50k, 4.5% for AGIs $50k-75k, 4.3% for AGIs $75k-100k, 4.3% for AGIs $100k-200k, 1.7% for AGIs over 200k)
Self-employment retirement plans: $29,614 (reported on 3.9% of returns)
94402:
$29,614
California:
$24,530
(% of AGI for various income ranges: 0.9% for AGIs $25k-50k, 0.3% for AGIs $50k-75k, 0.5% for AGIs $75k-100k, 0.8% for AGIs $100k-200k, 0.6% for AGIs over 200k)
Total itemized deductions: $55,619 (19% of AGI, reported on 55.1% of returns)
Here:
$55,619
State:
$34,004
Here:
18.7% of AGI
State:
22.7% of AGI
(% of AGI for various income ranges: 24.1% for AGIs below $25k, 15.6% for AGIs $25k-50k, 16.7% for AGIs $50k-75k, 18.5% for AGIs $75k-100k, 20.1% for AGIs $100k-200k, 15.9% for AGIs over 200k)
Charity contributions: $5,583 (reported on 46.7% of returns)
Here:
$5,583
State:
$4,659
(% of AGI for various income ranges: 0.9% for AGIs below $25k, 1.0% for AGIs $25k-50k, 1.3% for AGIs $50k-75k, 1.5% for AGIs $75k-100k, 1.6% for AGIs $100k-200k, 1.4% for AGIs over 200k)
Taxes paid: $31,723 (reported on 54.8% of returns)
94402:
$31,723
State:
$14,448
(% of AGI for various income ranges: 5.6% for AGIs below $25k, 4.0% for AGIs $25k-50k, 5.0% for AGIs $50k-75k, 6.9% for AGIs $75k-100k, 8.8% for AGIs $100k-200k, 10.5% for AGIs over 200k)
Earned income credit: $1,586 (reported on 5.4% of returns)
Here:
$1,586
State:
$2,286
(% of AGI for various income ranges: 2.4% for AGIs below $25k, 0.4% for AGIs $25k-50k)
Percentage of individuals using paid preparers for their 2012 taxes: 61.6%
Here:
62%
State:
64%
(% for various income ranges: 57.1% for AGIs below $25k, 57.6% for AGIs $25k-50k, 58.7% for AGIs $50k-75k, 60.0% for AGIs $75k-100k, 63.7% for AGIs $100k-200k, 70.1% for AGIs over 200k)
Averages for the 2004 tax year for zip code 94402, filed in 2005:
Average Adjusted Gross Income (AGI) in 2004: $117,927 (Individual Income Tax Returns)
Here:
$117,927
State:
$58,600
Salary/wage: $94,876 (reported on 72.6% of returns)
Here:
$94,876
State:
$49,455
(% of AGI for various income ranges: 58.5% for AGIs $10k-25k, 69.2% for AGIs $25k-50k, 66.2% for AGIs $50k-75k, 66.9% for AGIs $75k-100k, 55.3% for AGIs over 100k)
Taxable interest for individuals: $4,053 (reported on 66.6% of returns)
This zip code:
$4,053
California:
$2,365
(% of AGI for various income ranges: 5.2% for AGIs $10k-25k, 2.9% for AGIs $25k-50k, 3.1% for AGIs $50k-75k, 2.7% for AGIs $75k-100k, 2.0% for AGIs over 100k)
Taxable dividends: $6,953 (reported on 51.5% of returns)
Here:
$6,953
State:
$4,746
(% of AGI for various income ranges: 6.4% for AGIs $10k-25k, 3.7% for AGIs $25k-50k, 3.3% for AGIs $50k-75k, 3.4% for AGIs $75k-100k, 2.7% for AGIs over 100k)
Net capital gain/loss: +$25,450 (reported on 46.8% of returns)
Here:
+$25,450
State:
+$23,418
(% of AGI for various income ranges: 0.8% for AGIs $10k-25k, 1.1% for AGIs $25k-50k, 1.8% for AGIs $50k-75k, 2.3% for AGIs $75k-100k, 12.3% for AGIs over 100k)
Profit/loss from business: +$36,580 (reported on 20.3% of returns)
Here:
+$36,580
State:
+$16,826
(% of AGI for various income ranges: 10.9% for AGIs $10k-25k, 7.6% for AGIs $25k-50k, 6.3% for AGIs $50k-75k, 7.1% for AGIs $75k-100k, 5.9% for AGIs over 100k)
IRA payment deduction: $3,477 (reported on 4.0% of returns)
94402:
$3,477
California:
$3,192
(% of AGI for various income ranges: 0.5% for AGIs $10k-25k, 0.4% for AGIs $25k-50k, 0.3% for AGIs $50k-75k, 0.2% for AGIs $75k-100k, 0.1% for AGIs over 100k)
Self-employed pension: $21,115 (reported on 4.5% of returns)
Here:
$21,115
California:
$17,688
(% of AGI for various income ranges: 0.4% for AGIs $10k-25k, 0.3% for AGIs $25k-50k, 0.5% for AGIs $50k-75k, 0.5% for AGIs $75k-100k, 0.9% for AGIs over 100k)
Total itemized deductions: $41,231 (21% of AGI, reported on 53.7% of returns)
Here:
$41,231
State:
$28,113
Here:
21.3% of AGI
State:
25.3% of AGI
(% of AGI for various income ranges: 31.9% for AGIs $10k-25k, 19.3% for AGIs $25k-50k, 19.8% for AGIs $50k-75k, 21.9% for AGIs $75k-100k, 17.7% for AGIs over 100k)
Charity contributions deductions: $5,649 (3% of AGI, reported on 47.4% of returns)
Here:
$5,649
State:
$3,923
Here:
2.7% of AGI
State:
3.3% of AGI
(% of AGI for various income ranges: 1.3% for AGIs $10k-25k, 1.5% for AGIs $25k-50k, 1.8% for AGIs $50k-75k, 2.1% for AGIs $75k-100k, 2.4% for AGIs over 100k)
Total tax: $25,506 (reported on 84.2% of returns)
94402:
$25,506
State:
$10,761
(% of AGI for various income ranges: 5.5% for AGIs $10k-25k, 8.7% for AGIs $25k-50k, 11.0% for AGIs $50k-75k, 12.0% for AGIs $75k-100k, 20.3% for AGIs over 100k)
Earned income credit: $1,268 (reported on 4.3% of returns)
Here:
$1,268
State:
$1,763
Percentage of individuals using paid preparers for their 2004 taxes: 63.6%
Here:
64%
State:
66%
(% for various income ranges: 56.7% for AGIs below $10k, 62.8% for AGIs $10k-25k, 59.4% for AGIs $25k-50k, 63.3% for AGIs $50k-75k, 63.2% for AGIs $75k-100k, 70.2% for AGIs over 100k)
Likely homosexual households (counted as self-reported same-sex unmarried-partner households)
Lesbian couples: 0.4% of all households
Gay men: 0.6% of all households
Household received Food Stamps/SNAP in the past 12 months: 260 Household did not receive Food Stamps/SNAP in the past 12 months: 9,767
Women who had a birth in the past 12 months: 459 (428 now married, 28 unmarried) Women who did not have a birth in the past 12 months: 5,488 (2,373 now married, 3,106 unmarried)
Housing units in zip code 94402 with a mortgage: 4,315 (608 second mortgage, 52 home equity loan, 553 both second mortgage and home equity loan) Houses without a mortgage: 87
Median monthly owner costs for units with a mortgage: $3,876 Median monthly owner costs for units without a mortgage: $1,134
Residents with income below the poverty level in 2022:
This zip code:
5.7%
Whole state:
12.2%
Residents with income below 50% of the poverty level in 2022:
This zip code:
2.4%
Whole state:
6.2%
Median number of rooms in houses and condos:
Here:
6.8
State:
6.0
Median number of rooms in apartments:
Here:
3.9
State:
3.9
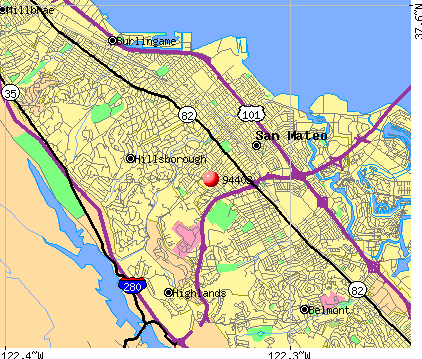
Notable locations in this zip code not listed on our city pages
Notable locations in zip code 94402: Crystal Springs Rehabilitation Center (A), San Mateo County Library (B), City of San Mateo Fire Department Station 27 (C), Hillcrest Detention Home (D), Department of Forestry and Fire Protection Station 17 Belmont Fire Station (E). Display/hide their locations on the map
4,049 married couples with children.
1,188 single-parent households (392 men, 796 women).
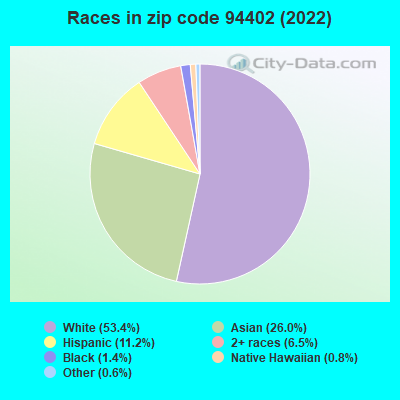
70.3% of residents of 94402 zip code speak English at home.
6.3% of residents speak Spanish at home (59% very well, 33% well, 6% not well, 2% not at all).
8.2% of residents speak other Indo-European language at home (87% very well, 10% well, 2% not well, 1% not at all).
14.5% of residents speak Asian or Pacific Island language at home (68% very well, 25% well, 6% not well).
1.0% of residents speak other language at home (100% very well).
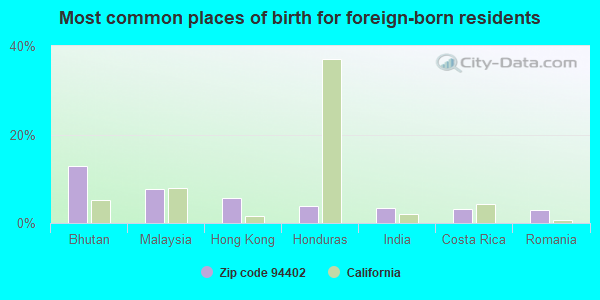
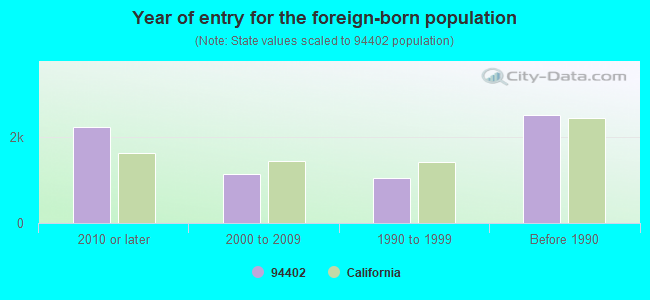
Foreign born population: 6,568 (25.3%) (57.2% of them are naturalized citizens)
Major facilities with environmental interests located in this zip code:
ARAGON HIGH SCHOOL (900 ALAMEDA DE LAS PULGAS in SAN MATEO, CA)
(Geographic Names Information System) (National Center for Education Statistics) - STATE ID-4130217 Organizations: SAN MATEO UNION HIGH (SCHOOL DISTRICT)
CHEVRON STATION NO 92038 (790 PULHEMUS RD in SAN MATEO, CA)
STATE MASTER (California - Hazardous Waste Tracking) - HAZARDOU WASTE PROGRAM Small Quantity Generators, between 100 kg and 1000 kg of hazardous waste/month (Resource Conservation and Recovery Act (tracking hazardous waste)) - notification Organizations: CHEVRON PRODUCTS CO (CONTACT/OWNER)
HIGHLANDS ELEMENTARY (2320 NEWPORT ST. in SAN MATEO, CA)
(National Center for Education Statistics) - STATE ID-6044911 Organizations: SAN MATEO-FOSTER CITY ELEMENTARY (SCHOOL DISTRICT)
JUVENILE HALL/COMMUNITY (21 TOWER ROAD in SAN MATEO, CA)
(National Center for Education Statistics) - STATE ID-4130076 Organizations: SAN MATEO CO. OFF. OF EDUCATION (SCHOOL DISTRICT)
EXXON CO USA SAN MATEO BULK PLT (320 PENINSULA in SAN MATEO, CA)
HILLS CLEANERS (746 POLHEMUS ROAD in SAN MATEO, CA)
CRITERIA AND HAZARDOUS AIR POLLUTANT INVENTORY (Inventory of air pollution sources) Small Quantity Generators, between 100 kg and 1000 kg of hazardous waste/month (Resource Conservation and Recovery Act (tracking hazardous waste)) Business SIC classification: DRYCLEANING PLANTS, EXCEPT RUG CLEANING Organizations: JON EMERY (CONTACT/OWNER)
Alternative names: HOLIDAY CLEANERS
NEW LOOK AUTO BODY AND PAINT (609 SOUTH CLAREMONT STREET in SAN MATEO, CA)
CRITERIA AND HAZARDOUS AIR POLLUTANT INVENTORY (Inventory of air pollution sources) Small Quantity Generators, between 100 kg and 1000 kg of hazardous waste/month (Resource Conservation and Recovery Act (tracking hazardous waste)) - notification Business SIC classification: TOP, BODY, AND UPHOLSTERY REPAIR SHOPS AND PAINT SHOPS Organizations: ROGER ALTIZER (CONTACT/OWNER)
ALL CAR AUTO PAINTING AND BODY REPAIR (501 9TH AVENUE in SAN MATEO, CA)
CRITERIA AND HAZARDOUS AIR POLLUTANT INVENTORY (Inventory of air pollution sources) Small Quantity Generators, between 100 kg and 1000 kg of hazardous waste/month (Resource Conservation and Recovery Act (tracking hazardous waste)) - notification Business SIC classification: TOP, BODY, AND UPHOLSTERY REPAIR SHOPS AND PAINT SHOPS Organizations: RODNEY A DOWAIT (CONTACT/OWNER)
EXXON CO USA #74135 (1801 S. DELAWARE STREET in SAN MATEO, CA)
(Resource Conservation and Recovery Act (tracking hazardous waste))
MASTER CRAFT (1214 S AMPHLETT BLVD in SAN MATEO, CA)
Small Quantity Generators, between 100 kg and 1000 kg of hazardous waste/month (Resource Conservation and Recovery Act (tracking hazardous waste)) - notification Organizations: JOAN HARALSON (CONTACT/OWNER)
MCLELLAN ESTATE CO TEXACO (4095 PACIFIC BLVD in SAN MATEO, CA)
Small Quantity Generators, between 100 kg and 1000 kg of hazardous waste/month (Resource Conservation and Recovery Act (tracking hazardous waste)) - notification
CAL TRANS MATERIALS LAB DIST 4 (1116 SO AMPHLETT BLVD in SAN MATEO, CA)
Small Quantity Generators, between 100 kg and 1000 kg of hazardous waste/month (Resource Conservation and Recovery Act (tracking hazardous waste)) - notification Organizations: STATE OF CALIF DOT (CONTACT/OWNER)
CALIFORNIA CLEANERS (1620 PALM AVE in SAN MATEO, CA)
Small Quantity Generators, between 100 kg and 1000 kg of hazardous waste/month (Resource Conservation and Recovery Act (tracking hazardous waste)) Organizations: ROBERT YUEN (CONTACT/OWNER)
Housing units lacking complete plumbing facilities: 0.1% Housing units lacking complete kitchen facilities: 1.0%
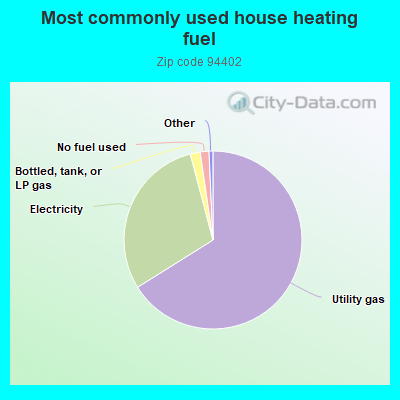
66.1%Utility gas
29.8%Electricity
1.8%Bottled, tank, or LP gas
1.6%No fuel used
Population in 1990: 23,838.
Place of birth for U.S.-born residents:
This state: 13,930
Northeast: 1,752
Midwest: 1,485
South: 1,135
West: 794
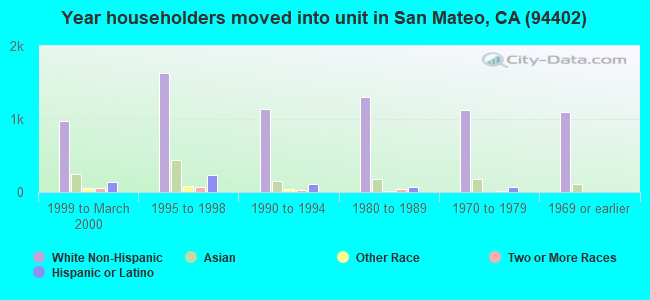
65% of the 94402 zip code residents lived in the same house 5 years ago. Out of people who lived in different houses, 60% lived in this county. Out of people who lived in different counties, 50% lived in California.
88% of the 94402 zip code residents lived in the same house 1 year ago. Out of people who lived in different houses, 41% moved from this county. Out of people who lived in different houses, 33% moved from different county within same state. Out of people who lived in different houses, 21% moved from different state. Out of people who lived in different houses, 7% moved from abroad.
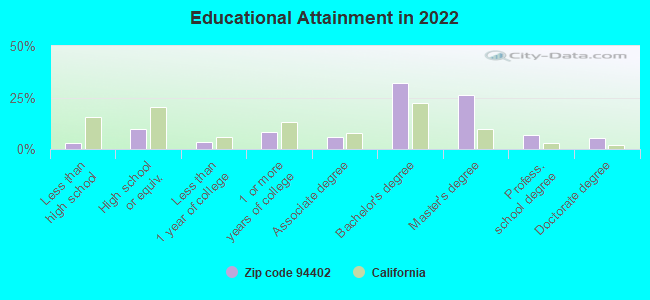
Private vs. public school enrollment:
Students in private schools in grades 1 to 8 (elementary and middle school): 1,018
Here:
39.5%
California:
10.5%
Students in private schools in grades 9 to 12 (high school): 277
Here:
20.5%
California:
8.5%
Students in private undergraduate colleges: 275
Here:
24.9%
California:
15.9%
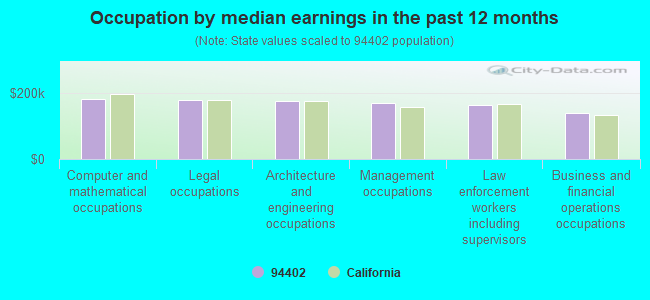
Occupation by median earnings in the past 12 months ($)
182,520Computer and mathematical occupations
177,900Legal occupations
177,726Architecture and engineering occupations
169,475Management occupations
165,457Law enforcement workers including supervisors
140,029Business and financial operations occupations
Companies with biggest federal contracts located in this zip code (SAN MATEO, CA):
FORTERRA SYSTEMS, INC (1855 SOUTH GRANT STREET, 3; small business) : $3,989,989 in 17 contractsfrom 2003 to 2006
Contracts for Other Medical -- Basic Research (R&D), Services -- Applied Research and Exploratory Development (R&D) by Army, Navy Signed by year:2000: $0; 2001: $0; 2002: $0; 2003: $1,334,338; 2004: $378,807; 2005: $1,128,612; 2006: $1,148,232.
Biggest contracts:
$728,232 with Army for Other Medical -- Basic Research (R&D). Signed on 2006-02-28. Completion date: 2005-11-13.
$725,000 with Navy for Services -- Applied Research and Exploratory Development (R&D). Signed on 2005-01-13. Completion date: 2006-01-12.
$724,338, same as above.Signed on 2003-02-24. Completion date: 2004-02-24.
$550,000, same as above.Signed on 2003-10-29. Completion date: 2003-02-10.
ON SITE DENTAL CARE (1730 S AMPHLETT BLVD; small business) : $3,740,066 in 108 contractsfrom 2003 to 2006
Contracts for Dentistry Services, Personal Care Services (includes such services as barber and beauty shop, shoe repairs, tailoring, etc.), Dental Instruments, Equipment, and Supplies, Lease or Rental of Equipment -- Medical, Dental, and Veterinary Equipment and Supplies, and moreby Army Signed by year:2000: $0; 2001: $0; 2002: $0; 2003: $30,600; 2004: $642,021; 2005: $1,838,739; 2006: $1,228,706.
Biggest contracts:
$388,196 with Army for Dentistry Services. Taking place in MN. Signed on 2005-09-20. Completion date: 2005-04-30.
$196,000 with Army for Personal Care Services (includes such services as barber and beauty shop, shoe repairs, tailoring, etc.). Signed on 2004-11-04. Completion date: 2004-10-26.
$187,034, same as above.Signed on 2004-08-26. Completion date: 2004-08-10.
$171,850 with Army for Dental Instruments, Equipment, and Supplies. Signed on 2006-07-06. Completion date: 2006-07-09.
QUIMBA SOFTWARE INC (FOUR WEST FOURTH AVE STE A; small business) : $1,246,115 in 8 contractsfrom 2002 to 2006
Contracts for Other Defense -- Applied Research and Exploratory Development (R&D), Other Defense -- Basic Research (R&D) by Air Force, Army Signed by year:2000: $0; 2001: $0; 2002: $99,002; 2003: $298,868; 2004: $99,997; 2005: $505,000; 2006: $243,248.
Biggest contracts:
$375,000 with Air Force for Other Defense -- Applied Research and Exploratory Development (R&D). Signed on 2005-04-18. Completion date: 2007-04-17.
$243,248, same as above.Signed on 2006-04-06. Completion date: 2007-04-17.
$130,000, same as above.Signed on 2005-09-23. Completion date: 2007-04-17.
$124,950 with Air Force for Other Defense -- Basic Research (R&D). Signed on 2003-10-23. Completion date: 2005-04-18.
GLENBOROUGH CORPORATION (400 S EL CAMINO REAL STE; small business) 160 employees, $8526481 revenue. : $443,545 in 40 contractsfrom 2001 to 2006
Contracts for Lease or Rental of Facilities -- Office Buildings by Public Buildings Service Signed by year:2000: $0; 2001: $50,000; 2002: $75,000; 2003: $105,456; 2004: $27,381; 2005: $110,388; 2006: $75,320.
Biggest contracts:
$25,000 with Public Buildings Service for Lease or Rental of Facilities -- Office Buildings. Taking place in FL. Signed on 2001-09-15. Completion date: 2001-09-15.
$25,000, same as above.Signed on 2002-09-15. Completion date: 2002-09-15.
$25,000, same as above.Signed on 2001-12-15. Completion date: 2001-12-15.
$25,000, same as above.Signed on 2002-06-15. Completion date: 2002-06-15.
SENSITRON INC (1300 S EL CAMINO REAL 502; small business)
$104,000 with Army for Other Professional Services. Taking place in MD. Signed on 2002-09-25. Completion date: 2003-09-29.
AMERICAN TELENETICS COMPANY (1720 SOUTH ANTHLETT BLVD S; small business)
$99,983 with Navy for Other Defense -- Operational Systems Development (R&D). Signed on 2004-08-24. Completion date: 2005-02-28.
CODE COMPLETE SOFTWARE INC (1670 S AMPHLETT BLVD STE 2; small business) : $55,904 in 6 contractsfrom 2003 to 2006
Contracts for ADP Software, Other ADP and Telecommunications Services (includes data storage on tapes, compact disks, etc.), ADP Input/Output and Storage Devices by Air Force, Army, Defense Finance and Accounting Service Signed by year:2000: $0; 2001: $0; 2002: $0; 2003: $2,295; 2004: $8,970; 2005: $37,159; 2006: $7,480.
Biggest contracts:
$22,606 with Air Force for ADP Software. Signed on 2005-05-23. Completion date: 2005-06-22.
$10,881 with Army for ADP Software. Signed on 2005-09-27. Completion date: 2006-09-27.
$8,970 with Army for Other ADP and Telecommunications Services (includes data storage on tapes, compact disks, etc.). Signed on 2004-07-07. Completion date: 2005-07-06.
$7,480 with Defense Finance and Accounting Service for ADP Software. Signed on 2006-04-28. Completion date: 2006-05-03.
E PIPHANY, INC (475 CONCAR DR 2ND FL) : $34,444 in 2 contractsin 2005
$30,731 with Army for ADP Software. Signed on 2005-11-21. Completion date: 2006-09-30.
$3,713 with Army for ADP Software. Taking place in KY. Signed on 2005-12-01. Completion date: 2006-09-30.
GOLDEN GATE PIANO & ORGAN CO (1011 N AMPHLETT BLVD; small business)
$29,895 with Army for Construction of Structures and Facilities -- Miscellaneous Buildings. Signed on 2002-09-16. Completion date: 2002-09-06.
ONE SOURCE ENGINEERING (2205 BUNKER HILL DR; small business)
$13,843 with Navy for Maintenance, Repair or Alteration of Real Property -- Heating and Cooling Plants. Signed on 2005-07-20. Completion date: 2005-08-12.
Top industries in this zip code by the number of employees in 2005:
Administrative and Support and Waste Management and Remediation Services: Temporary Help Services (250-499 employees: 1 establishment, 100-249 employees: 3 establishments, 50-99 employees: 2 establishments, 20-49 employees: 1 establishment, 10-19 employees: 1 establishment, 5-9 employees: 1 establishment, 1-4 employees: 5 establishments)
Accommodation and Food Services: Hotels (except Casino Hotels) and Motels (500-999: 1, 100-249: 1)
2005 - 2018 National Fire Incident Reporting System (NFIRS) incidents
Based on the data from the years 2005 - 2018 the average number of fire incidents per year is 16. The highest number of fire incidents - 30 took place in 2008, and the least - 8 in 2015. The data has a dropping trend.
When looking into fire subcategories, the most incidents belonged to: Mobile Property/Vehicle Fires (37.6%), and Outside Fires (31.4%).
Fire incident types reported to NFIRS in Zip Code 94402


 Nearest zip codes: 94403, 94002, 94010, 94401, 94070, 94404.


 Based on the data from the years 2005 - 2018 the average number of fire incidents per year is 16. The highest number of fire incidents - 30 took place in 2008, and the least - 8 in 2015. The data has a dropping trend.
 When looking into fire subcategories, the most incidents belonged to: Mobile Property/Vehicle Fires (37.6%), and Outside Fires (31.4%).