Estimated zip code population in 2022: 43,097 Zip code population in 2010: 40,737 Zip code population in 2000: 40,328
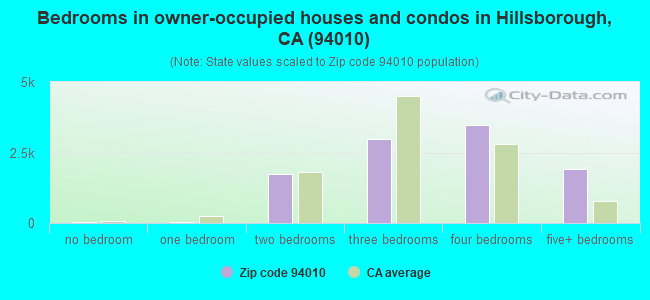
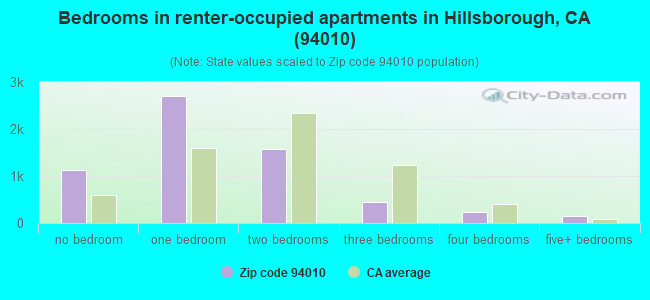
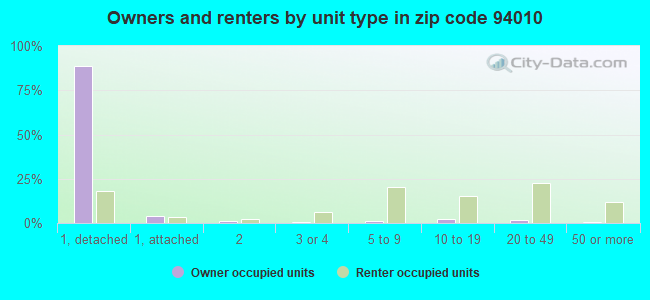
Houses and condos: 17,702 Renter-occupied apartments: 6,200
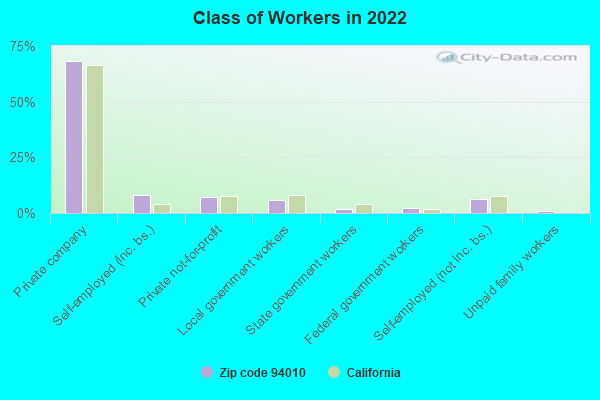
% of renters here:
38%
State:
44%
March 2022 cost of living index in zip code 94010: 133.5 (high, U.S. average is 100)
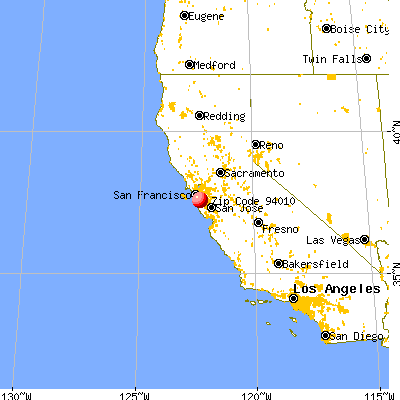
Land area: 11.8 sq. mi. Water area: 0.1 sq. mi.
Population density: 3,640 people per square mile
(average).
OSM Map
General Map
Google Map
MSN Map
OSM Map
General Map
Google Map
MSN Map
OSM Map
General Map
Google Map
MSN Map
OSM Map
General Map
Google Map
MSN Map
Please wait while loading the map...
Real estate property taxes paid for housing units in 2022:
This zip code:
0.5% ($10,292)
California:
0.7% ($4,831)
Median real estate property taxes paid for housing units with mortgages in 2022: $10,330 (0.5%) Median real estate property taxes paid for housing units with no mortgage in 2022: $10,572 (0.5%)
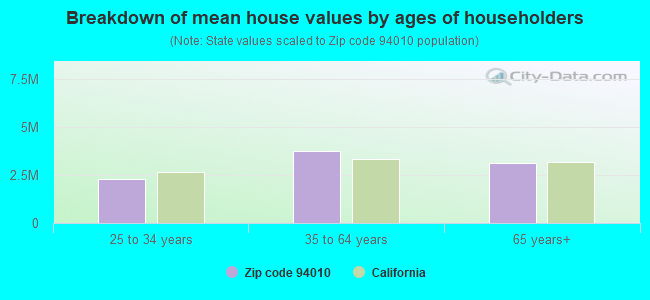
Estimated median house/condo value in 2022: $2,171,698
94010:
$2,171,698
California:
$715,900
According to our research of California and other state lists, there were 11 registered sex offenders living in 94010 zip code as of April 27, 2024. The ratio of all residents to sex offenders in zip code 94010 is 3,925 to 1. The ratio of registered sex offenders to all residents in this zip code is much lower than the state average.
Median resident age:
This zip code:
42.6 years
California median age:
37.9 years
Average household size:
This zip code:
2.6 people
California:
2.8 people
Averages for the 2020 tax year for zip code 94010, filed in 2021:
Average Adjusted Gross Income (AGI) in 2020: $534,788 (Individual Income Tax Returns)
Here:
$534,788
State:
$95,910
Salary/wage: $335,769 (reported on 74.9% of returns)
Here:
$335,769
State:
$77,331
(% of AGI for various income ranges: 1533.3% for AGIs below $25k, 4222.5% for AGIs $25k-50k, 7873.5% for AGIs $50k-75k, 11569.0% for AGIs $75k-100k, 22158.5% for AGIs $100k-200k, 371255.3% for AGIs over 200k)
Taxable interest for individuals: $10,911 (reported on 60.3% of returns)
This zip code:
$10,911
California:
$2,294
(% of AGI for various income ranges: 74.7% for AGIs below $25k, 104.8% for AGIs $25k-50k, 169.1% for AGIs $50k-75k, 251.0% for AGIs $75k-100k, 504.1% for AGIs $100k-200k, 9838.7% for AGIs over 200k)
Ordinary dividends: $39,260 (reported on 55.3% of returns)
Here:
$39,260
State:
$10,949
(% of AGI for various income ranges: 211.2% for AGIs below $25k, 270.9% for AGIs $25k-50k, 464.5% for AGIs $50k-75k, 616.2% for AGIs $75k-100k, 1456.9% for AGIs $100k-200k, 33002.2% for AGIs over 200k)
Net capital gain/loss in AGI: +$313,497 (reported on 53.3% of returns)
Here:
+$313,497
State:
+$49,306
(% of AGI for various income ranges: 114.9% for AGIs below $25k, 267.5% for AGIs $25k-50k, 325.9% for AGIs $50k-75k, 617.7% for AGIs $75k-100k, 1778.6% for AGIs $100k-200k, 275081.9% for AGIs over 200k)
Profit/loss from business: +$64,949 (reported on 21.1% of returns)
Here:
+$64,949
State:
+$15,671
(% of AGI for various income ranges: 337.4% for AGIs below $25k, 582.3% for AGIs $25k-50k, 316.5% for AGIs $50k-75k, 611.3% for AGIs $75k-100k, 1563.8% for AGIs $100k-200k, 19248.4% for AGIs over 200k)
Taxable individual retirement arrangement distribution: $42,650 (reported on 10.5% of returns)
94010:
$42,650
California:
$23,505
(% of AGI for various income ranges: 93.8% for AGIs below $25k, 178.5% for AGIs $25k-50k, 253.8% for AGIs $50k-75k, 528.1% for AGIs $75k-100k, 1250.6% for AGIs $100k-200k, 5074.0% for AGIs over 200k)
Self-employed (Keogh) retirement plans: $44,165 (reported on 4.6% of returns)
94010:
$44,165
California:
$30,163
(% of AGI for various income ranges: 12.3% for AGIs below $25k, 22.5% for AGIs $50k-75k, 47.5% for AGIs $75k-100k, 212.8% for AGIs $100k-200k, 3021.7% for AGIs over 200k)
Total itemized deductions: $88,267 (reported on 32.2% of returns)
Here:
$88,267
State:
$39,517
(% of AGI for various income ranges: 291.4% for AGIs below $25k, 491.5% for AGIs $25k-50k, 798.4% for AGIs $50k-75k, 1216.6% for AGIs $75k-100k, 2781.6% for AGIs $100k-200k, 41519.1% for AGIs over 200k)
Charity contributions: $56,891 (reported on 27.9% of returns)
Here:
$56,891
State:
$12,598
(% of AGI for various income ranges: 10.0% for AGIs below $25k, 42.6% for AGIs $25k-50k, 103.4% for AGIs $50k-75k, 140.3% for AGIs $75k-100k, 348.0% for AGIs $100k-200k, 25764.0% for AGIs over 200k)
Taxes paid: $9,466 (reported on 32.1% of returns)
94010:
$9,466
State:
$8,807
(% of AGI for various income ranges: 61.8% for AGIs below $25k, 105.5% for AGIs $25k-50k, 174.9% for AGIs $50k-75k, 285.6% for AGIs $75k-100k, 686.2% for AGIs $100k-200k, 3693.2% for AGIs over 200k)
Earned income credit: $1,483 (reported on 3.6% of returns)
Here:
$1,483
State:
$2,074
(% of AGI for various income ranges: 44.0% for AGIs below $25k, 35.1% for AGIs $25k-50k)
Percentage of individuals using paid preparers for their 2020 taxes: 91.9%
Here:
92%
State:
92%
(% for various income ranges: 87.7% for AGIs below $25k, 91.3% for AGIs $25k-50k, 91.0% for AGIs $50k-75k, 92.3% for AGIs $75k-100k, 92.3% for AGIs $100k-200k, 94.3% for AGIs over 200k)
Averages for the 2012 tax year for zip code 94010, filed in 2013:
Average Adjusted Gross Income (AGI) in 2012: $309,874 (Individual Income Tax Returns)
Here:
$309,874
State:
$72,726
Salary/wage: $210,188 (reported on 75.1% of returns)
Here:
$210,188
State:
$59,079
(% of AGI for various income ranges: 66.4% for AGIs below $25k, 69.9% for AGIs $25k-50k, 71.0% for AGIs $50k-75k, 69.3% for AGIs $75k-100k, 64.3% for AGIs $100k-200k, 48.2% for AGIs over 200k)
Taxable interest for individuals: $9,270 (reported on 60.5% of returns)
This zip code:
$9,270
California:
$2,146
(% of AGI for various income ranges: 3.1% for AGIs below $25k, 1.9% for AGIs $25k-50k, 1.9% for AGIs $50k-75k, 2.0% for AGIs $75k-100k, 1.8% for AGIs $100k-200k, 1.8% for AGIs over 200k)
Ordinary dividends: $31,218 (reported on 48.7% of returns)
Here:
$31,218
State:
$9,308
(% of AGI for various income ranges: 7.2% for AGIs below $25k, 3.5% for AGIs $25k-50k, 3.8% for AGIs $50k-75k, 3.4% for AGIs $75k-100k, 4.1% for AGIs $100k-200k, 5.1% for AGIs over 200k)
Net capital gain/loss in AGI: +$124,298 (reported on 46.2% of returns)
Here:
+$124,298
State:
+$30,460
(% of AGI for various income ranges: 1.1% for AGIs below $25k, 1.4% for AGIs $25k-50k, 1.3% for AGIs $50k-75k, 1.6% for AGIs $75k-100k, 2.7% for AGIs $100k-200k, 21.5% for AGIs over 200k)
Profit/loss from business: +$54,591 (reported on 20.6% of returns)
Here:
+$54,591
State:
+$17,064
(% of AGI for various income ranges: 13.5% for AGIs below $25k, 9.1% for AGIs $25k-50k, 5.9% for AGIs $50k-75k, 5.4% for AGIs $75k-100k, 6.9% for AGIs $100k-200k, 3.0% for AGIs over 200k)
Taxable individual retirement arrangement distribution: $47,522 (reported on 12.9% of returns)
94010:
$47,522
California:
$19,557
(% of AGI for various income ranges: 3.7% for AGIs below $25k, 3.0% for AGIs $25k-50k, 2.6% for AGIs $50k-75k, 3.3% for AGIs $75k-100k, 3.9% for AGIs $100k-200k, 1.7% for AGIs over 200k)
Self-employment retirement plans: $34,405 (reported on 4.7% of returns)
94010:
$34,405
California:
$24,530
(% of AGI for various income ranges: 0.3% for AGIs $25k-50k, 0.3% for AGIs $50k-75k, 0.3% for AGIs $75k-100k, 0.7% for AGIs $100k-200k, 0.5% for AGIs over 200k)
Total itemized deductions: $102,005 (19% of AGI, reported on 54.9% of returns)
Here:
$102,005
State:
$34,004
Here:
19.2% of AGI
State:
22.7% of AGI
(% of AGI for various income ranges: 23.1% for AGIs below $25k, 13.3% for AGIs $25k-50k, 15.6% for AGIs $50k-75k, 16.7% for AGIs $75k-100k, 21.5% for AGIs $100k-200k, 17.9% for AGIs over 200k)
Charity contributions: $20,225 (reported on 46.5% of returns)
Here:
$20,225
State:
$4,659
(% of AGI for various income ranges: 1.0% for AGIs below $25k, 0.9% for AGIs $25k-50k, 1.3% for AGIs $50k-75k, 1.5% for AGIs $75k-100k, 1.8% for AGIs $100k-200k, 3.3% for AGIs over 200k)
Taxes paid: $58,938 (reported on 54.8% of returns)
94010:
$58,938
State:
$14,448
(% of AGI for various income ranges: 7.3% for AGIs below $25k, 4.2% for AGIs $25k-50k, 4.9% for AGIs $50k-75k, 6.9% for AGIs $75k-100k, 9.8% for AGIs $100k-200k, 10.9% for AGIs over 200k)
Earned income credit: $1,556 (reported on 4.8% of returns)
Here:
$1,556
State:
$2,286
(% of AGI for various income ranges: 2.3% for AGIs below $25k, 0.3% for AGIs $25k-50k)
Percentage of individuals using paid preparers for their 2012 taxes: 64.2%
Here:
64%
State:
64%
(% for various income ranges: 57.4% for AGIs below $25k, 56.0% for AGIs $25k-50k, 56.1% for AGIs $50k-75k, 59.8% for AGIs $75k-100k, 66.2% for AGIs $100k-200k, 78.5% for AGIs over 200k)
Averages for the 2004 tax year for zip code 94010, filed in 2005:
Average Adjusted Gross Income (AGI) in 2004: $182,818 (Individual Income Tax Returns)
Here:
$182,818
State:
$58,600
Salary/wage: $143,161 (reported on 72.0% of returns)
Here:
$143,161
State:
$49,455
(% of AGI for various income ranges: 62.9% for AGIs $10k-25k, 72.0% for AGIs $25k-50k, 69.6% for AGIs $50k-75k, 66.9% for AGIs $75k-100k, 53.0% for AGIs over 100k)
Taxable interest for individuals: $6,819 (reported on 67.0% of returns)
This zip code:
$6,819
California:
$2,365
(% of AGI for various income ranges: 6.0% for AGIs $10k-25k, 3.0% for AGIs $25k-50k, 3.1% for AGIs $50k-75k, 3.1% for AGIs $75k-100k, 2.2% for AGIs over 100k)
Taxable dividends: $14,817 (reported on 52.9% of returns)
Here:
$14,817
State:
$4,746
(% of AGI for various income ranges: 5.8% for AGIs $10k-25k, 3.3% for AGIs $25k-50k, 3.5% for AGIs $50k-75k, 3.3% for AGIs $75k-100k, 4.2% for AGIs over 100k)
Net capital gain/loss: +$57,638 (reported on 48.8% of returns)
Here:
+$57,638
State:
+$23,418
(% of AGI for various income ranges: 2.2% for AGIs $10k-25k, 1.2% for AGIs $25k-50k, 1.1% for AGIs $50k-75k, 2.2% for AGIs $75k-100k, 17.1% for AGIs over 100k)
Profit/loss from business: +$47,780 (reported on 20.4% of returns)
Here:
+$47,780
State:
+$16,826
(% of AGI for various income ranges: 10.3% for AGIs $10k-25k, 7.5% for AGIs $25k-50k, 6.7% for AGIs $50k-75k, 7.1% for AGIs $75k-100k, 4.9% for AGIs over 100k)
IRA payment deduction: $3,633 (reported on 3.7% of returns)
94010:
$3,633
California:
$3,192
(% of AGI for various income ranges: 0.3% for AGIs $10k-25k, 0.4% for AGIs $25k-50k, 0.2% for AGIs $50k-75k, 0.2% for AGIs $75k-100k, 0.0% for AGIs over 100k)
Self-employed pension: $24,493 (reported on 5.1% of returns)
Here:
$24,493
California:
$17,688
(% of AGI for various income ranges: 0.2% for AGIs $10k-25k, 0.2% for AGIs $25k-50k, 0.4% for AGIs $50k-75k, 0.7% for AGIs $75k-100k, 0.7% for AGIs over 100k)
Total itemized deductions: $62,318 (19% of AGI, reported on 52.0% of returns)
Here:
$62,318
State:
$28,113
Here:
19.0% of AGI
State:
25.3% of AGI
(% of AGI for various income ranges: 23.7% for AGIs $10k-25k, 15.7% for AGIs $25k-50k, 19.7% for AGIs $50k-75k, 21.7% for AGIs $75k-100k, 16.9% for AGIs over 100k)
Charity contributions deductions: $11,511 (3% of AGI, reported on 46.8% of returns)
Here:
$11,511
State:
$3,923
Here:
3.3% of AGI
State:
3.3% of AGI
(% of AGI for various income ranges: 1.6% for AGIs $10k-25k, 1.4% for AGIs $25k-50k, 1.8% for AGIs $50k-75k, 2.0% for AGIs $75k-100k, 3.1% for AGIs over 100k)
Total tax: $46,410 (reported on 84.9% of returns)
94010:
$46,410
State:
$10,761
(% of AGI for various income ranges: 5.6% for AGIs $10k-25k, 9.4% for AGIs $25k-50k, 11.7% for AGIs $50k-75k, 12.4% for AGIs $75k-100k, 22.7% for AGIs over 100k)
Earned income credit: $1,128 (reported on 3.8% of returns)
Here:
$1,128
State:
$1,763
Percentage of individuals using paid preparers for their 2004 taxes: 66.7%
Here:
67%
State:
66%
(% for various income ranges: 62.5% for AGIs below $10k, 63.6% for AGIs $10k-25k, 57.7% for AGIs $25k-50k, 59.9% for AGIs $50k-75k, 62.5% for AGIs $75k-100k, 78.5% for AGIs over 100k)
Likely homosexual households (counted as self-reported same-sex unmarried-partner households)
Lesbian couples: 0.3% of all households
Gay men: 0.2% of all households
Household received Food Stamps/SNAP in the past 12 months: 306 Household did not receive Food Stamps/SNAP in the past 12 months: 15,667
Women who had a birth in the past 12 months: 392 (389 now married, 0 unmarried) Women who did not have a birth in the past 12 months: 8,721 (4,488 now married, 4,190 unmarried)
Housing units in zip code 94010 with a mortgage: 6,981 (1,202 second mortgage, 36 home equity loan, 1,110 both second mortgage and home equity loan) Houses without a mortgage: 73
Median monthly owner costs for units with a mortgage: $3,876 Median monthly owner costs for units without a mortgage: $1,556
Residents with income below the poverty level in 2022:
This zip code:
4.7%
Whole state:
12.2%
Residents with income below 50% of the poverty level in 2022:
This zip code:
1.6%
Whole state:
6.2%
Median number of rooms in houses and condos:
Here:
7.3
State:
6.0
Median number of rooms in apartments:
Here:
3.3
State:
3.9
Notable locations in this zip code not listed on our city pages
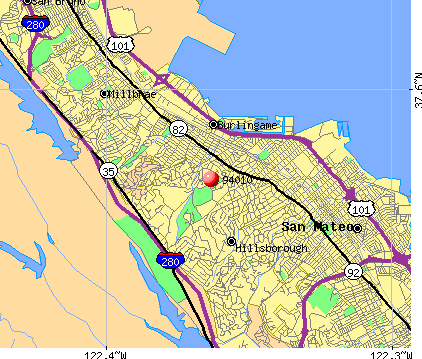
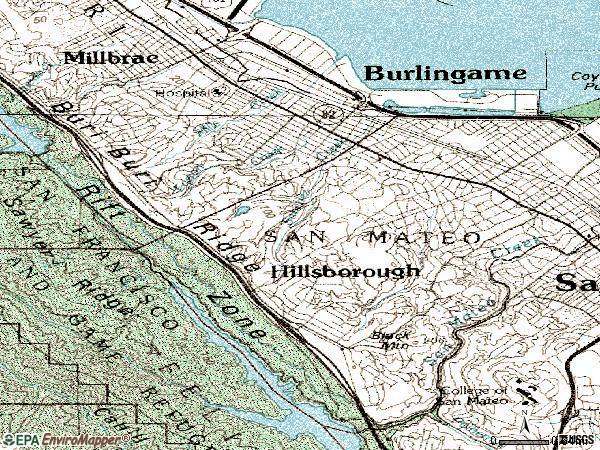
Notable locations in zip code 94010: Burlingame Country Club (A), Peninsula Tennis Club (B), Hillsborough Racquet Club (C), Carol Chateau (D), Easton Drive Branch Burlingame Public Library (E), Central County Fire Department Station 36 (F), Central County Fire Department Station 34 (G), Burlingame Community Center (H), Peninsula Hospital Health Sciences Library (I), House-on-the-Hill (J), American Medical Response San Mateo County (K), Central County Fire Department Station 33 (L), Central County Fire Department Station 35 (M), Central County Fire Department Station 32 (N). Display/hide their locations on the map
Shopping Centers: Fox Mall Shopping Center (1), Crosby Commons Shopping Center (2), Friendship Plaza Shopping Center (3), Burlingame Plaza Shopping Center (4). Display/hide their locations on the map
Churches in zip code 94010 include: Kingdom Hall of Jehovahs Witnesses (A), Peninsula Temple Sholom (B), Shinnyo-En California Buddhist Temple (C), Assembly of God Church (D), Burlingame United Methodist Church (E), First Baptist Church of Burlingame (F), First Church of Christ Scientist (G), First Presbyterian Church (H), Good Shepherd Lutheran Church (I). Display/hide their locations on the map
Parks in zip code 94010 include: Ray Park (1), Washington Park (2), Hoover Playground (3), Cuernavaca Park (4), Mills Creek Canyon Park (5), Skyline Park (6), Victoria Park (7), Alpine Park (8), Bayfront Park (9). Display/hide their locations on the map
8,553 married couples with children.
1,092 single-parent households (407 men, 685 women).
63.7% of residents of 94010 zip code speak English at home.
7.8% of residents speak Spanish at home (62% very well, 26% well, 9% not well, 3% not at all).
9.6% of residents speak other Indo-European language at home (80% very well, 15% well, 2% not well, 3% not at all).
17.0% of residents speak Asian or Pacific Island language at home (63% very well, 23% well, 11% not well, 4% not at all).
2.2% of residents speak other language at home (83% very well, 7% well, 9% not well, 1% not at all).
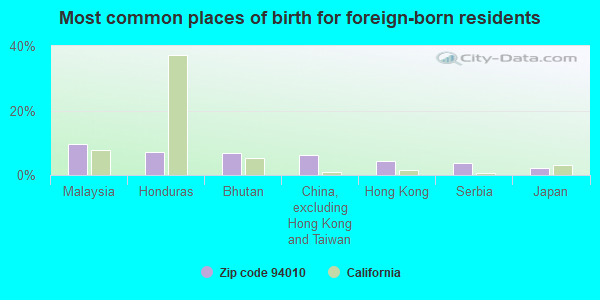
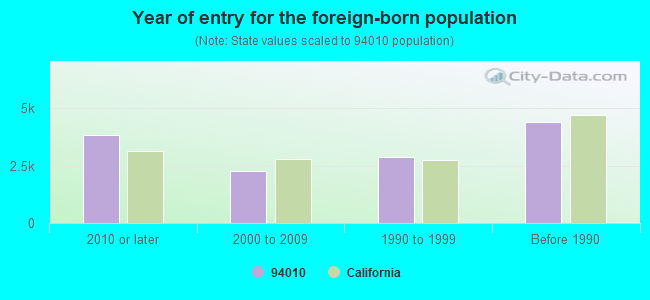
Foreign born population: 12,590 (29.2%) (63.7% of them are naturalized citizens)
Major facilities with environmental interests located in this zip code:
HANSON'S AUTO REPAIR (1222 ROLLINS ROAD in BURLINGAME, CA)
STATE MASTER (California - Hazardous Waste Tracking) - HAZARDOU WASTE PROGRAM CRITERIA AND HAZARDOUS AIR POLLUTANT INVENTORY (Inventory of air pollution sources) Small Quantity Generators, between 100 kg and 1000 kg of hazardous waste/month (Resource Conservation and Recovery Act (tracking hazardous waste)) - notification Business SIC classification: TOP, BODY, AND UPHOLSTERY REPAIR SHOPS AND PAINT SHOPS Business NAICS classification: AUTOMOTIVE BODY, PAINT, AND INTERIOR REPAIR AND MAINTENANCE. Organizations: JOE FISHER (CONTACT/OWNER)
Alternative names: HANSON'S AUTOBODY REPAIR
EDMOND SCREEN PRINTING (1212 ROLLINGS RD in BURLINGAME, CA)
STATE MASTER (California - Hazardous Waste Tracking) - HAZARDOU WASTE PROGRAM Large Quantity Generators, more that 1000 kg of hazardous waste/month (Resource Conservation and Recovery Act (tracking hazardous waste)) - notification Organizations: EDMOND CHANG (CONTACT/OWNER)
HOLIDAY CLEANERS (1883 EL CAMINO REAL in BURLINGAME, CA)
STATE MASTER (California - Hazardous Waste Tracking) - HAZARDOU WASTE PROGRAM CRITERIA AND HAZARDOUS AIR POLLUTANT INVENTORY (Inventory of air pollution sources) Small Quantity Generators, between 100 kg and 1000 kg of hazardous waste/month (Resource Conservation and Recovery Act (tracking hazardous waste)) Business SIC classification: DRYCLEANING PLANTS, EXCEPT RUG CLEANING
ENVIRONMENTAL HEALTH RESEARCH TESTING (1240 BAYSHORE HWY STE 210 in BURLINGAME, CA)
(Resource Conservation and Recovery Act (tracking hazardous waste)) Organizations: P S SABHARWAL (CONTACT/OWNER)
, SABHARWAL PRITAM (CONTACT/OWNER)
Alternative names: SITE INC
CHEVRON STATION 91909 (1101 BROADWAY in BURLINGAME, CA)
STATE MASTER (California - Hazardous Waste Tracking) - HAZARDOU WASTE PROGRAM Small Quantity Generators, between 100 kg and 1000 kg of hazardous waste/month (Resource Conservation and Recovery Act (tracking hazardous waste)) - notification Organizations: CHEVRON PRODUCTS CO (CONTACT/OWNER)
CHEVRON STATION 90571 (260 EL CAMINO REAL in BURLINGAME, CA)
STATE MASTER (California - Hazardous Waste Tracking) - HAZARDOU WASTE PROGRAM Small Quantity Generators, between 100 kg and 1000 kg of hazardous waste/month (Resource Conservation and Recovery Act (tracking hazardous waste)) - notification Organizations: CHEVRON PRODUCTS CO (CONTACT/OWNER)
FRANKLIN ELEMENTARY (2385 TROUSDALE DR. in BURLINGAME, CA)
(National Center for Education Statistics) - STATE ID-6043541 Organizations: BURLINGAME ELEMENTARY (SCHOOL DISTRICT)
NORTH HILLSBOROUGH (ELEM) (545 EUCALYPTUS AVE. in HILLSBOROUGH, CA)
(National Center for Education Statistics) - STATE ID-6043673 Organizations: HILLSBOROUGH CITY ELEMENTARY (SCHOOL DISTRICT)
LINCOLN ELEMENTARY (1801 DEVEREUX DR. in BURLINGAME, CA)
(National Center for Education Statistics) - STATE ID-6043566 Organizations: BURLINGAME ELEMENTARY (SCHOOL DISTRICT)
MCKINLEY ELEMENTARY (701 PALOMA AVE. in BURLINGAME, CA)
(National Center for Education Statistics) - STATE ID-6043574 Organizations: BURLINGAME ELEMENTARY (SCHOOL DISTRICT)
AESCULAP INSTRUMENTS CORP (857 HINCKLEY RD in BURLINGAME, CA)
(Resource Conservation and Recovery Act (tracking hazardous waste)) Organizations: AESCULAP AG (CONTACT/OWNER)
AESCULAP INSTRUMENTS CORP (875 STANTON RD in BURLINGAME, CA)
(Resource Conservation and Recovery Act (tracking hazardous waste)) Organizations: AESCULAP A G (CONTACT/OWNER)
CHEMETRICS CORP (197 AIRPORT BLVD in BURLINGAME, CA)
Housing units lacking complete plumbing facilities: 0.5% Housing units lacking complete kitchen facilities: 1.3%
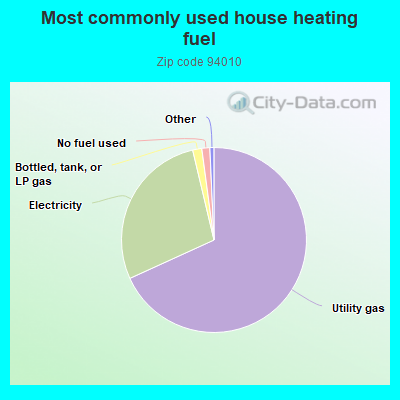
68.2%Utility gas
28.1%Electricity
1.6%Bottled, tank, or LP gas
1.4%No fuel used
Population in 1990: 38,444. Population change in the 1990s: +1,884 (+4.9%).
Place of birth for U.S.-born residents:
This state: 22,894
Northeast: 2,224
Midwest: 2,231
South: 1,368
West: 1,115
62% of the 94010 zip code residents lived in the same house 5 years ago. Out of people who lived in different houses, 50% lived in this county. Out of people who lived in different counties, 50% lived in California.
90% of the 94010 zip code residents lived in the same house 1 year ago. Out of people who lived in different houses, 43% moved from this county. Out of people who lived in different houses, 38% moved from different county within same state. Out of people who lived in different houses, 9% moved from different state. Out of people who lived in different houses, 12% moved from abroad.
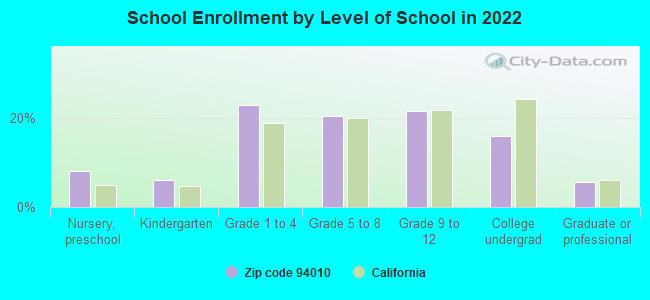
Private vs. public school enrollment:
Students in private schools in grades 1 to 8 (elementary and middle school): 1,011
Here:
20.6%
California:
10.5%
Students in private schools in grades 9 to 12 (high school): 760
Here:
31.5%
California:
8.5%
Students in private undergraduate colleges: 487
Here:
27.2%
California:
15.9%
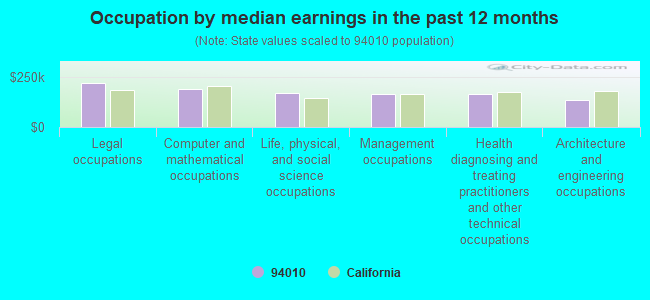
Occupation by median earnings in the past 12 months ($)
219,417Legal occupations
191,918Computer and mathematical occupations
167,994Life, physical, and social science occupations
164,808Management occupations
164,534Health diagnosing and treating practitioners and other technical occupations
137,028Architecture and engineering occupations
Companies with biggest federal contracts located in this zip code (BURLINGAME, CA):
ENVIRONMENTAL CHEMICAL CORPORA (1240 BAYSHORE HWY; small business) : $875,568,629 in 1033 contractsfrom 1999 to 2006
Contracts for Trash/Garbage Collection Services - Including Portable Sanitation Services, Demolition of Structures or Facilities (Other than Buildings), Other Architect and Engineering Services, Hazardous Substance Removal, Cleanup, and Disposal Services and Operational Support, and moreby Army, Air Force, U.S. Army Corps of Engineers - civil program financing only, Navy, and others Signed by year:2000: $48,716,347; 2001: $70,114,165; 2002: $49,041,393; 2003: $65,630,192; 2004: $84,301,087; 2005: $344,228,501; 2006: $195,887,873.
Biggest contracts:
$160,400,949 with Army for Trash/Garbage Collection Services - Including Portable Sanitation Services. Taking place in LA. Signed on 2005-11-16. Completion date: 2005-10-04.
$57,103,523 with Army for Demolition of Structures or Facilities (Other than Buildings). Taking place in LA. Signed on 2006-05-03. Completion date: 2006-06-30.
$56,399,850 with Army for Trash/Garbage Collection Services - Including Portable Sanitation Services. Taking place in LA. Signed on 2006-02-28. Completion date: 2006-04-30.
$23,076,950, same as above.Signed on 2005-12-20. Completion date: 2005-12-27.
CALIFORNIA PACIFIC ASSOCIATES, (1801 MURCHISON DRIVE STE 3; small business) : $103,339,803 in 168 contractsfrom 1999 to 2006
Contracts for Food Items For Resale, Food Services, Non-Food Items For Resale, Meat, Poultry, and Fish by Department of Defense, Defense Commissary Agency Signed by year:2000: $14,931,946; 2001: $15,501,839; 2002: $20,381,435; 2003: $13,623,251; 2004: $16,681,585; 2005: $9,451,476; 2006: $4,510,441.
Biggest contracts:
$6,733,828 with Department of Defense for Food Items For Resale. Signed on 2002-11-01. Completion date: 2003-05-31.
$4,160,575, same as above.Signed on 2001-07-01. Completion date: 2001-05-31.
$3,338,511 with Defense Commissary Agency for Food Items For Resale. Signed on 2004-10-01. Completion date: 2005-02-28.
$3,327,582 with Department of Defense for Food Items For Resale. Signed on 2002-01-01. Completion date: 2002-08-31.
ARES CORPORATION (1440 CHAPIN AVENUE, SUITE; small business) : $95,282,015 in 140 contractsfrom 1999 to 2006
Contracts for Engineering and Technical Services, Other Defense -- Applied Research and Exploratory Development (R&D), Program Management/Support Services, Electrical and Electronic Properties Measuring and Testing Instruments, and moreby NASA, Department of Defense, Defense Threat Reduction Agency, Missile Defense Agency, and others Signed by year:2000: $175,000; 2001: $880,000; 2002: $1,705,627; 2003: $4,456,421; 2004: $39,792,385; 2005: $20,948,407; 2006: $25,624,175.
Biggest contracts:
$11,175,000 with NASA for Engineering and Technical Services. Taking place in TX. Signed on 2004-03-03. Completion date: 2008-09-30.
$9,866,000, same as above.Signed on 2006-01-25. Completion date: 2008-09-30.
$9,500,000, same as above.Signed on 2004-12-16. Completion date: 2008-09-30.
$8,943,000, same as above.Signed on 2006-04-17. Completion date: 2008-09-30.
$7,697,500 with U.S. Army Corps of Engineers - civil program financing only for Trash/Garbage Collection Services - Including Portable Sanitation Services. Taking place in LA. Signed on 2005-09-27. Completion date: 2006-03-27.
$3,612,300, same as above.Signed on 2005-09-27. Completion date: 2005-12-27.
$750,000, same as above.Signed on 2005-09-19. Completion date: 2005-09-22.
JACOBS CONSULTANCY (555 AIRPORT BLVD STE 300) : $2,964,303 in 7 contractsfrom 2004 to 2006
Contracts for Operations Research and Quantitative Analysis Services, Air Quality Analyses by Transportation Security Administration, Army Signed by year:2000: $0; 2001: $0; 2002: $0; 2003: $0; 2004: $1,693,200; 2005: $1,279,164; 2006: -$8,061.
Biggest contracts:
$1,693,200 with Transportation Security Administration for Operations Research and Quantitative Analysis Services. Signed on 2004-09-28. Completion date: 2005-03-31.
$441,662, same as above.Signed on 2005-08-12. Completion date: 2005-08-31.
$424,051, same as above.Signed on 2005-09-02. Completion date: 2006-02-28.
$355,451, same as above.Signed on 2005-09-02. Completion date: 2006-02-28.
M C M ENGINEERING INC (845 HINCKLEY RD; small business) : $838,195 in 10 contractsfrom 2000 to 2006
Contracts for Electrical and Electronic Properties Measuring and Testing Instruments, Converters, Electrical, Rotating, Miscellaneous Electric Power and Distribution Equipment, Construction of Structures and Facilities -- Miscellaneous Buildings, and moreby Army, Navy, Defense Logistics Agency Signed by year:2000: $51,765; 2001: $0; 2002: $28,900; 2003: $424,440; 2004: $14,410; 2005: $312,180; 2006: $6,500.
Biggest contracts:
$344,647 with Army for Electrical and Electronic Properties Measuring and Testing Instruments. Signed on 2003-08-26. Completion date: 2003-12-29.
$312,180 with Navy for Converters, Electrical, Rotating. Signed on 2005-09-29. Completion date: 2005-07-31.
$54,336 with Defense Logistics Agency for Miscellaneous Electric Power and Distribution Equipment. Signed on 2003-10-24. Completion date: 2003-12-08.
$51,765, same as above.Signed on 2000-10-20. Completion date: 2001-01-12.
TOUT ABOUT TOYS INC (1530 GILBRETH ROAD; small business) : $803,329 in 19 contractsfrom 2001 to 2006
Contracts for Textile Fabrics, Games, Toys and Wheeled Goods, Household Furniture, Books and Pamphlets, and moreby Federal Supply Service, Air Force, Army, Navy, and others Signed by year:2000: $0; 2001: $41,696; 2002: $62,318; 2003: $2,559; 2004: $15,525; 2005: $668,150; 2006: $13,081.
Biggest contracts:
$568,252 with Federal Supply Service for Textile Fabrics. Signed on 2005-09-06. Completion date: 2005-09-07.
$62,318 with Air Force for Games, Toys and Wheeled Goods. Signed on 2002-09-24. Completion date: 2002-12-13.
$41,696, same as above.Signed on 2001-08-01. Completion date: 2001-08-29.
$30,461 with Army for Games, Toys and Wheeled Goods. Signed on 2005-09-28. Completion date: 2005-10-28.
MERADOR, LLC (119 NEWTON DRIVE; small business) : $713,750 in 6 contractsfrom 2004 to 2005
Contracts for ADP Software, Other Professional Services by Army Signed by year:2000: $0; 2001: $0; 2002: $0; 2003: $0; 2004: $555,000; 2005: $158,750; 2006: $0.
Biggest contracts:
$500,000 with Army for ADP Software. Signed on 2004-12-01. Completion date: 2006-11-14.
$83,750 with Army for Other Professional Services. Taking place in VA. Signed on 2005-11-28. Completion date: 2006-02-28.
$75,000 with Army for ADP Software. Signed on 2005-09-27. Completion date: 2006-11-14.
$23,000 with Army for Other Professional Services. Taking place in DC. Signed on 2004-08-27. Completion date: 2005-02-18.
ATHOC, INC (1350 BAYSHORE HWY , SUITE; small business) : $326,500 in 4 contractsfrom 2004 to 2006
$252,500 with Air Force for ADP Software. Signed on 2004-10-28. Completion date: 2005-11-01.
$51,500 with Army for ADP Input/Output and Storage Devices. Signed on 2005-09-27. Completion date: 2005-09-26.
$15,000 with Air Force for ADP Software. Signed on 2005-05-04. Completion date: 2005-11-01.
$7,500 with Air Force for ADP Software. Taking place in AK. Signed on 2006-01-25. Completion date: 2006-04-30.
ITEDO SOFTWARE LLC (111 ANZA BLVD STE 300; small business) : $312,719 in 13 contractsfrom 2001 to 2006
Contracts for ADP Software, ADPE System Configuration, Miscellaneous Items, Other ADP and Telecommunications Services (includes data storage on tapes, compact disks, etc.) by Navy, Air Force Signed by year:2000: $0; 2001: $106,500; 2002: $68,480; 2003: $37,819; 2004: $86,280; 2005: $8,710; 2006: $4,930.
Biggest contracts:
$55,500 with Navy for ADP Software. Signed on 2001-08-03. Completion date: 2001-08-17.
$51,000 with Navy for ADPE System Configuration. Signed on 2001-10-18. Completion date: 2002-09-30.
$37,819 with Navy for Miscellaneous Items. Signed on 2003-10-01. Completion date: 2004-09-30.
$37,760, same as above.Signed on 2002-10-01. Completion date: 2003-09-30.
Top industries in this zip code by the number of employees in 2005:
Administrative and Support and Waste Management and Remediation Services: Temporary Help Services (over 1000 employees: 1 establishment, 50-99 employees: 2 establishments, 20-49 employees: 2 establishments, 10-19 employees: 1 establishment, 1-4 employees: 1 establishment)
Health Care and Social Assistance: General Medical and Surgical Hospitals (over 1000: 1)
2005 - 2018 National Fire Incident Reporting System (NFIRS) incidents
According to the data from the years 2005 - 2018 the average number of fire incidents per year is 80. The highest number of fire incidents - 114 took place in 2005, and the least - 18 in 2012. The data has a decreasing trend.
When looking into fire subcategories, the most incidents belonged to: Structure Fires (44.4%), and Outside Fires (28.3%).
Fire incident types reported to NFIRS in Zip Code 94010


 Nearest zip codes: 94030, 94401, 94402, 94128, 94403, 94002.
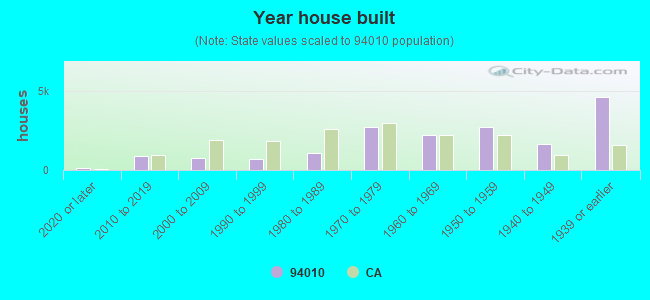


 According to the data from the years 2005 - 2018 the average number of fire incidents per year is 80. The highest number of fire incidents - 114 took place in 2005, and the least - 18 in 2012. The data has a decreasing trend.
 When looking into fire subcategories, the most incidents belonged to: Structure Fires (44.4%), and Outside Fires (28.3%).