Estimated zip code population in 2022: 35,098 Zip code population in 2010: 34,429 Zip code population in 2000: 32,484
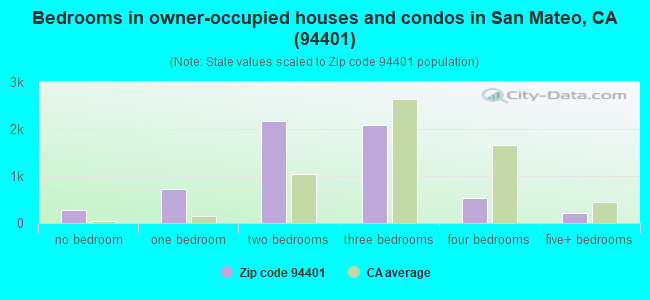
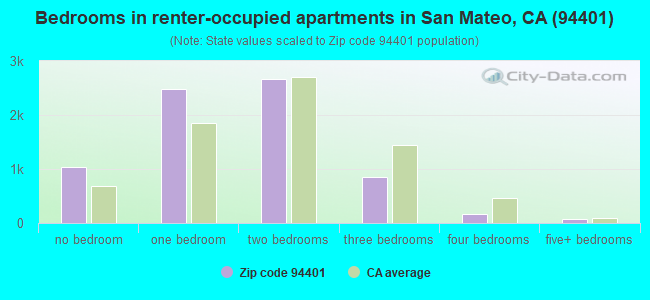
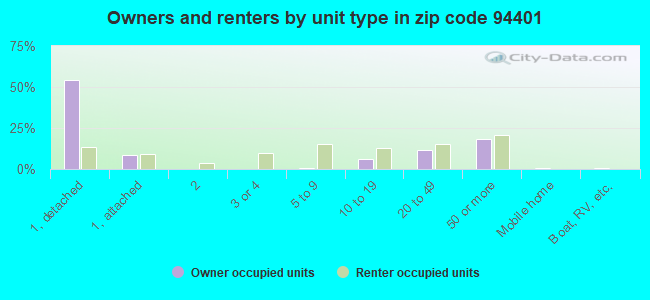
Houses and condos: 14,198 Renter-occupied apartments: 7,224
% of renters here:
55%
State:
44%
March 2022 cost of living index in zip code 94401: 131.7 (high, U.S. average is 100)
Land area: 3.1 sq. mi. Water area: 1.1 sq. mi.
Population density: 11,155 people per square mile
(high).
OSM Map
General Map
Google Map
MSN Map
OSM Map
General Map
Google Map
MSN Map
OSM Map
General Map
Google Map
MSN Map
OSM Map
General Map
Google Map
MSN Map
Please wait while loading the map...
Real estate property taxes paid for housing units in 2022:
This zip code:
0.6% ($7,209)
California:
0.7% ($4,831)
Median real estate property taxes paid for housing units with mortgages in 2022: $8,315 (0.7%) Median real estate property taxes paid for housing units with no mortgage in 2022: $5,836 (0.5%)
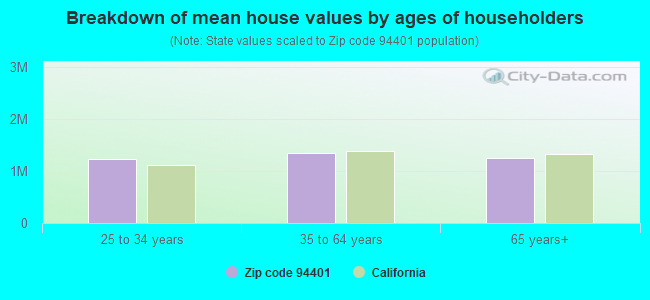
Estimated median house/condo value in 2022: $1,187,267
94401:
$1,187,267
California:
$715,900
According to our research of California and other state lists, there were 25 registered sex offenders living in 94401 zip code as of April 27, 2024. The ratio of all residents to sex offenders in zip code 94401 is 1,485 to 1. The ratio of registered sex offenders to all residents in this zip code is lower than the state average.
Median resident age:
This zip code:
36.2 years
California median age:
37.9 years
Average household size:
This zip code:
2.6 people
California:
2.8 people
Averages for the 2020 tax year for zip code 94401, filed in 2021:
Average Adjusted Gross Income (AGI) in 2020: $118,198 (Individual Income Tax Returns)
Here:
$118,198
State:
$95,910
Salary/wage: $109,055 (reported on 79.5% of returns)
Here:
$109,055
State:
$77,331
(% of AGI for various income ranges: 1408.1% for AGIs below $25k, 4413.9% for AGIs $25k-50k, 7864.8% for AGIs $50k-75k, 11878.7% for AGIs $75k-100k, 21714.2% for AGIs $100k-200k, 149681.3% for AGIs over 200k)
Taxable interest for individuals: $2,157 (reported on 38.5% of returns)
This zip code:
$2,157
California:
$2,294
(% of AGI for various income ranges: 27.8% for AGIs below $25k, 32.9% for AGIs $25k-50k, 78.1% for AGIs $50k-75k, 111.6% for AGIs $75k-100k, 123.2% for AGIs $100k-200k, 1668.7% for AGIs over 200k)
Ordinary dividends: $7,957 (reported on 29.0% of returns)
Here:
$7,957
State:
$10,949
(% of AGI for various income ranges: 59.7% for AGIs below $25k, 62.9% for AGIs $25k-50k, 157.1% for AGIs $50k-75k, 301.5% for AGIs $75k-100k, 509.2% for AGIs $100k-200k, 4476.0% for AGIs over 200k)
Net capital gain/loss in AGI: +$41,381 (reported on 27.7% of returns)
Here:
+$41,381
State:
+$49,306
(% of AGI for various income ranges: 23.3% for AGIs below $25k, 49.6% for AGIs $25k-50k, 153.1% for AGIs $50k-75k, 270.3% for AGIs $75k-100k, 684.5% for AGIs $100k-200k, 33772.1% for AGIs over 200k)
Profit/loss from business: +$18,723 (reported on 19.8% of returns)
Here:
+$18,723
State:
+$15,671
(% of AGI for various income ranges: 510.6% for AGIs below $25k, 467.1% for AGIs $25k-50k, 404.0% for AGIs $50k-75k, 560.3% for AGIs $75k-100k, 595.2% for AGIs $100k-200k, 4270.2% for AGIs over 200k)
Taxable individual retirement arrangement distribution: $21,742 (reported on 6.6% of returns)
94401:
$21,742
California:
$23,505
(% of AGI for various income ranges: 46.6% for AGIs below $25k, 93.1% for AGIs $25k-50k, 160.1% for AGIs $50k-75k, 289.0% for AGIs $75k-100k, 507.1% for AGIs $100k-200k, 1619.6% for AGIs over 200k)
Self-employed (Keogh) retirement plans: $27,571 (reported on 1.0% of returns)
94401:
$27,571
California:
$30,163
(% of AGI for various income ranges: 38.1% for AGIs $50k-75k, 45.6% for AGIs $100k-200k, 642.6% for AGIs over 200k)
Total itemized deductions: $36,902 (reported on 17.5% of returns)
Here:
$36,902
State:
$39,517
(% of AGI for various income ranges: 167.5% for AGIs below $25k, 253.9% for AGIs $25k-50k, 542.2% for AGIs $50k-75k, 1055.4% for AGIs $75k-100k, 1780.8% for AGIs $100k-200k, 10481.9% for AGIs over 200k)
Charity contributions: $9,947 (reported on 13.5% of returns)
Here:
$9,947
State:
$12,598
(% of AGI for various income ranges: 6.2% for AGIs below $25k, 22.6% for AGIs $25k-50k, 58.1% for AGIs $50k-75k, 128.6% for AGIs $75k-100k, 207.8% for AGIs $100k-200k, 3214.9% for AGIs over 200k)
Taxes paid: $9,330 (reported on 17.3% of returns)
94401:
$9,330
State:
$8,807
(% of AGI for various income ranges: 36.8% for AGIs below $25k, 67.1% for AGIs $25k-50k, 155.7% for AGIs $50k-75k, 322.9% for AGIs $75k-100k, 554.4% for AGIs $100k-200k, 2164.0% for AGIs over 200k)
Earned income credit: $1,899 (reported on 8.3% of returns)
Here:
$1,899
State:
$2,074
(% of AGI for various income ranges: 81.0% for AGIs below $25k, 46.9% for AGIs $25k-50k)
Percentage of individuals using paid preparers for their 2020 taxes: 89.4%
Here:
89%
State:
92%
(% for various income ranges: 82.2% for AGIs below $25k, 88.3% for AGIs $25k-50k, 91.2% for AGIs $50k-75k, 92.1% for AGIs $75k-100k, 93.8% for AGIs $100k-200k, 94.8% for AGIs over 200k)
Averages for the 2012 tax year for zip code 94401, filed in 2013:
Average Adjusted Gross Income (AGI) in 2012: $71,130 (Individual Income Tax Returns)
Here:
$71,130
State:
$72,726
Salary/wage: $65,130 (reported on 80.7% of returns)
Here:
$65,130
State:
$59,079
(% of AGI for various income ranges: 71.8% for AGIs below $25k, 80.4% for AGIs $25k-50k, 77.7% for AGIs $50k-75k, 78.3% for AGIs $75k-100k, 80.1% for AGIs $100k-200k, 63.6% for AGIs over 200k)
Taxable interest for individuals: $1,773 (reported on 36.5% of returns)
This zip code:
$1,773
California:
$2,146
(% of AGI for various income ranges: 1.2% for AGIs below $25k, 0.7% for AGIs $25k-50k, 0.8% for AGIs $50k-75k, 0.7% for AGIs $75k-100k, 0.8% for AGIs $100k-200k, 1.1% for AGIs over 200k)
Ordinary dividends: $7,663 (reported on 21.8% of returns)
Here:
$7,663
State:
$9,308
(% of AGI for various income ranges: 2.1% for AGIs below $25k, 1.3% for AGIs $25k-50k, 1.6% for AGIs $50k-75k, 1.8% for AGIs $75k-100k, 2.3% for AGIs $100k-200k, 3.3% for AGIs over 200k)
Net capital gain/loss in AGI: +$17,364 (reported on 19.1% of returns)
Here:
+$17,364
State:
+$30,460
(% of AGI for various income ranges: 0.2% for AGIs $25k-50k, 0.7% for AGIs $50k-75k, 1.1% for AGIs $75k-100k, 1.4% for AGIs $100k-200k, 12.8% for AGIs over 200k)
Profit/loss from business: +$19,307 (reported on 18.1% of returns)
Here:
+$19,307
State:
+$17,064
(% of AGI for various income ranges: 16.7% for AGIs below $25k, 6.7% for AGIs $25k-50k, 4.9% for AGIs $50k-75k, 3.9% for AGIs $75k-100k, 3.0% for AGIs $100k-200k, 3.9% for AGIs over 200k)
Taxable individual retirement arrangement distribution: $19,708 (reported on 8.1% of returns)
94401:
$19,708
California:
$19,557
(% of AGI for various income ranges: 1.9% for AGIs below $25k, 1.7% for AGIs $25k-50k, 2.0% for AGIs $50k-75k, 2.5% for AGIs $75k-100k, 2.5% for AGIs $100k-200k, 2.3% for AGIs over 200k)
Self-employment retirement plans: $19,773 (reported on 0.9% of returns)
94401:
$19,773
California:
$24,530
(% of AGI for various income ranges: 0.2% for AGIs below $25k, 0.2% for AGIs $50k-75k, 0.2% for AGIs $100k-200k, 0.5% for AGIs over 200k)
Total itemized deductions: $31,068 (22% of AGI, reported on 35.0% of returns)
Here:
$31,068
State:
$34,004
Here:
22.4% of AGI
State:
22.7% of AGI
(% of AGI for various income ranges: 10.4% for AGIs below $25k, 10.0% for AGIs $25k-50k, 14.0% for AGIs $50k-75k, 16.6% for AGIs $75k-100k, 17.2% for AGIs $100k-200k, 16.7% for AGIs over 200k)
Charity contributions: $3,163 (reported on 26.7% of returns)
Here:
$3,163
State:
$4,659
(% of AGI for various income ranges: 0.6% for AGIs below $25k, 0.7% for AGIs $25k-50k, 1.0% for AGIs $50k-75k, 1.4% for AGIs $75k-100k, 1.3% for AGIs $100k-200k, 1.4% for AGIs over 200k)
Taxes paid: $13,991 (reported on 34.9% of returns)
94401:
$13,991
State:
$14,448
(% of AGI for various income ranges: 2.2% for AGIs below $25k, 2.4% for AGIs $25k-50k, 4.4% for AGIs $50k-75k, 6.2% for AGIs $75k-100k, 7.6% for AGIs $100k-200k, 10.0% for AGIs over 200k)
Earned income credit: $1,960 (reported on 11.5% of returns)
Here:
$1,960
State:
$2,286
(% of AGI for various income ranges: 3.9% for AGIs below $25k, 0.6% for AGIs $25k-50k)
Percentage of individuals using paid preparers for their 2012 taxes: 60.9%
Here:
61%
State:
64%
(% for various income ranges: 63.3% for AGIs below $25k, 61.8% for AGIs $25k-50k, 59.3% for AGIs $50k-75k, 55.1% for AGIs $75k-100k, 56.9% for AGIs $100k-200k, 68.4% for AGIs over 200k)
Averages for the 2004 tax year for zip code 94401, filed in 2005:
Average Adjusted Gross Income (AGI) in 2004: $53,576 (Individual Income Tax Returns)
Here:
$53,576
State:
$58,600
Salary/wage: $49,833 (reported on 80.5% of returns)
Here:
$49,833
State:
$49,455
(% of AGI for various income ranges: 128.5% for AGIs below $10k, 73.3% for AGIs $10k-25k, 81.8% for AGIs $25k-50k, 81.2% for AGIs $50k-75k, 81.7% for AGIs $75k-100k, 65.7% for AGIs over 100k)
Taxable interest for individuals: $2,266 (reported on 46.8% of returns)
This zip code:
$2,266
California:
$2,365
(% of AGI for various income ranges: 10.0% for AGIs below $10k, 3.0% for AGIs $10k-25k, 1.7% for AGIs $25k-50k, 1.7% for AGIs $50k-75k, 1.5% for AGIs $75k-100k, 2.1% for AGIs over 100k)
Taxable dividends: $4,650 (reported on 26.3% of returns)
Here:
$4,650
State:
$4,746
(% of AGI for various income ranges: 10.8% for AGIs below $10k, 2.4% for AGIs $10k-25k, 1.6% for AGIs $25k-50k, 1.7% for AGIs $50k-75k, 1.7% for AGIs $75k-100k, 2.9% for AGIs over 100k)
Net capital gain/loss: +$12,237 (reported on 23.3% of returns)
Here:
+$12,237
State:
+$23,418
(% of AGI for various income ranges: -5.5% for AGIs below $10k, -0.5% for AGIs $10k-25k, 0.1% for AGIs $25k-50k, 0.6% for AGIs $50k-75k, 1.0% for AGIs $75k-100k, 12.5% for AGIs over 100k)
Profit/loss from business: +$14,972 (reported on 15.9% of returns)
Here:
+$14,972
State:
+$16,826
(% of AGI for various income ranges: 28.0% for AGIs below $10k, 10.4% for AGIs $10k-25k, 5.2% for AGIs $25k-50k, 3.9% for AGIs $50k-75k, 2.4% for AGIs $75k-100k, 3.6% for AGIs over 100k)
IRA payment deduction: $2,889 (reported on 2.7% of returns)
94401:
$2,889
California:
$3,192
(% of AGI for various income ranges: 0.6% for AGIs below $10k, 0.2% for AGIs $10k-25k, 0.3% for AGIs $25k-50k, 0.2% for AGIs $50k-75k, 0.1% for AGIs $75k-100k, 0.1% for AGIs over 100k)
Self-employed pension: $15,609 (reported on 1.2% of returns)
Here:
$15,609
California:
$17,688
(% of AGI for various income ranges: 0.1% for AGIs $10k-25k, 0.2% for AGIs $25k-50k, 0.2% for AGIs $50k-75k, 0.1% for AGIs $75k-100k, 0.6% for AGIs over 100k)
Total itemized deductions: $24,466 (27% of AGI, reported on 37.9% of returns)
Here:
$24,466
State:
$28,113
Here:
26.6% of AGI
State:
25.3% of AGI
(% of AGI for various income ranges: 52.5% for AGIs below $10k, 14.1% for AGIs $10k-25k, 13.5% for AGIs $25k-50k, 18.5% for AGIs $50k-75k, 20.4% for AGIs $75k-100k, 17.3% for AGIs over 100k)
Charity contributions deductions: $2,629 (3% of AGI, reported on 32.5% of returns)
Here:
$2,629
State:
$3,923
Here:
2.7% of AGI
State:
3.3% of AGI
(% of AGI for various income ranges: 2.0% for AGIs below $10k, 0.8% for AGIs $10k-25k, 1.0% for AGIs $25k-50k, 1.5% for AGIs $50k-75k, 1.6% for AGIs $75k-100k, 2.0% for AGIs over 100k)
Total tax: $8,492 (reported on 80.4% of returns)
94401:
$8,492
State:
$10,761
(% of AGI for various income ranges: 8.4% for AGIs below $10k, 4.7% for AGIs $10k-25k, 7.8% for AGIs $25k-50k, 10.7% for AGIs $50k-75k, 11.6% for AGIs $75k-100k, 17.7% for AGIs over 100k)
Earned income credit: $1,536 (reported on 9.7% of returns)
Here:
$1,536
State:
$1,763
Percentage of individuals using paid preparers for their 2004 taxes: 63.5%
Here:
64%
State:
66%
(% for various income ranges: 60.4% for AGIs below $10k, 68.7% for AGIs $10k-25k, 63.1% for AGIs $25k-50k, 61.9% for AGIs $50k-75k, 60.7% for AGIs $75k-100k, 63.7% for AGIs over 100k)
Likely homosexual households (counted as self-reported same-sex unmarried-partner households)
Lesbian couples: 0.3% of all households
Gay men: 0.4% of all households
Household received Food Stamps/SNAP in the past 12 months: 603 Household did not receive Food Stamps/SNAP in the past 12 months: 12,387
Women who had a birth in the past 12 months: 511 (448 now married, 61 unmarried) Women who did not have a birth in the past 12 months: 8,116 (3,307 now married, 4,804 unmarried)
Housing units in zip code 94401 with a mortgage: 3,887 (609 second mortgage, 1 home equity loan, 510 both second mortgage and home equity loan) Houses without a mortgage: 29
Median monthly owner costs for units with a mortgage: $3,445 Median monthly owner costs for units without a mortgage: $978
Residents with income below the poverty level in 2022:
This zip code:
9.8%
Whole state:
12.2%
Residents with income below 50% of the poverty level in 2022:
This zip code:
5.6%
Whole state:
6.2%
Median number of rooms in houses and condos:
Here:
5.0
State:
6.0
Median number of rooms in apartments:
Here:
3.5
State:
3.9
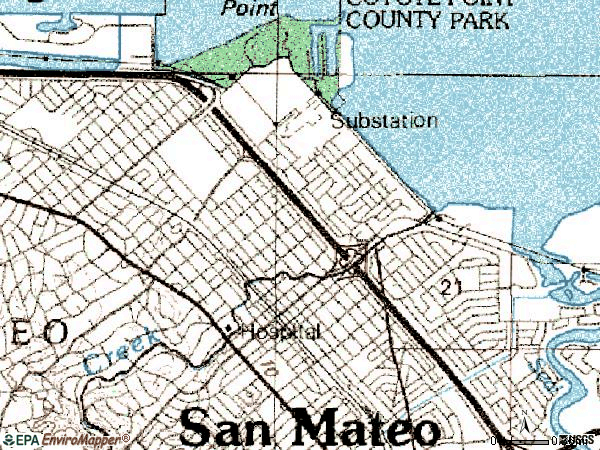
Notable locations in this zip code not listed on our city pages
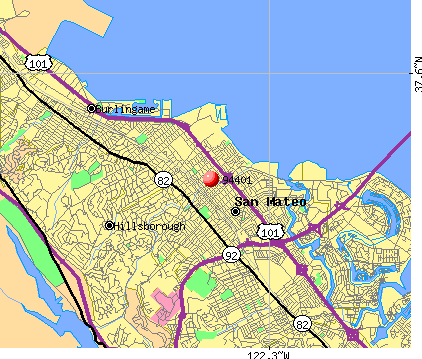
Notable locations in zip code 94401: San Mateo Municipal Golf Course (A), Coyote Point Marina (B), San Mateo Performing Arts Center (C), San Mateo City Hall (D), Peninsula Animal Shelter (E), Grace and Truth Hall (F), Coyote Point Museum (G), City of San Mateo Fire Department Station 21 (H), City of San Mateo Fire Department Station 24 (I). Display/hide their locations on the map
Shopping Centers: Woodlake Shopping Center (1), Parkside Plaza Shopping Center (2), Wood Lake Shopping Center (3), Shoreview Shopping Center (4). Display/hide their locations on the map
Churches in zip code 94401 include: Chinese Baptist Church (A), First Church of Christ Scientist (B), First Methodist Church (C), Four Square Church (D), Macedonia Church of God in Christ (E), Pilgrim Baptist Church (F), Saint James African Methodist Episcopal Church (G), Saint Matthews Episcopal Church (H), Saint Mathews Roman Catholic Church (I). Display/hide their locations on the map
Parks in zip code 94401 include: Central Park (1), Coyote Point County Park (2), Eastside Park (3), Ryder Court Park (4), Shoreview Park (5), Harbor View Park (6), Japanese Gardens (7). Display/hide their locations on the map
3,695 married couples with children.
2,104 single-parent households (590 men, 1,514 women).
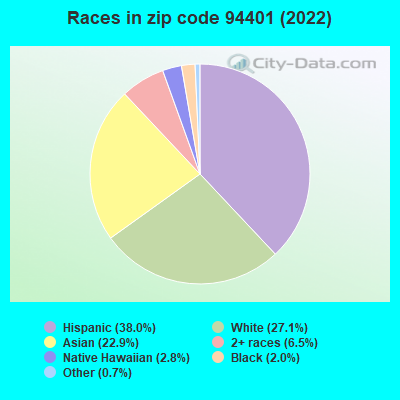
43.9% of residents of 94401 zip code speak English at home.
32.3% of residents speak Spanish at home (50% very well, 23% well, 17% not well, 10% not at all).
7.3% of residents speak other Indo-European language at home (63% very well, 23% well, 9% not well, 4% not at all).
16.2% of residents speak Asian or Pacific Island language at home (64% very well, 20% well, 10% not well, 6% not at all).
0.7% of residents speak other language at home (50% very well, 35% well, 15% not well).
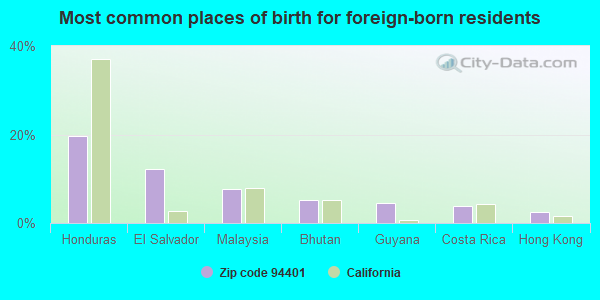
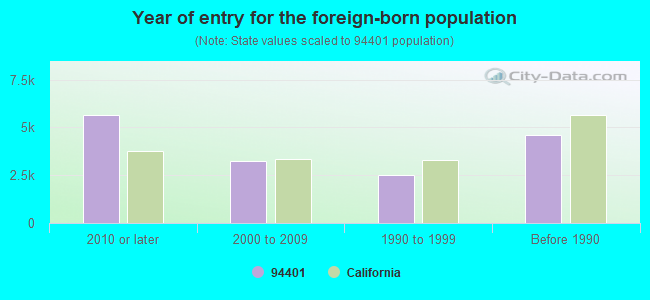
Foreign born population: 15,064 (42.9%) (42.4% of them are naturalized citizens)
Major facilities with environmental interests located in this zip code:
EAST 3RD AVE LANDFILL (1950 E 3RD AVE in SAN MATEO, CA)
STATE MASTER (California - Hazardous Waste Tracking) - HAZARDOU WASTE PROGRAM Large Quantity Generators, more that 1000 kg of hazardous waste/month (Resource Conservation and Recovery Act (tracking hazardous waste)) Organizations: CITY OF SAN MATEO (CONTACT/OPERATOR)
CARLS AUTO BODY (111 SO RAILROAD in SAN MATEO, CA)
STATE MASTER (California - Hazardous Waste Tracking) - HAZARDOU WASTE PROGRAM CRITERIA AND HAZARDOUS AIR POLLUTANT INVENTORY (Inventory of air pollution sources) Small Quantity Generators, between 100 kg and 1000 kg of hazardous waste/month (Resource Conservation and Recovery Act (tracking hazardous waste)) - notification Business SIC classification: TOP, BODY, AND UPHOLSTERY REPAIR SHOPS AND PAINT SHOPS Business NAICS classification: AUTOMOTIVE BODY, PAINT, AND INTERIOR REPAIR AND MAINTENANCE. Organizations: SUE CARRUTH (CONTACT/OWNER)
Alternative names: CARLS HONDA ACURA BODY WORKS
MILLS MEMORIAL HOSPITAL (100 SOUTH SAN MATEO DRIVE in SAN MATEO, CA)
STATE MASTER (California - Hazardous Waste Tracking) - HAZARDOU WASTE PROGRAM CRITERIA AND HAZARDOUS AIR POLLUTANT INVENTORY (Inventory of air pollution sources) Small Quantity Generators, between 100 kg and 1000 kg of hazardous waste/month (Resource Conservation and Recovery Act (tracking hazardous waste)) Business SIC classification: GENERAL MEDICAL AND SURGICAL HOSPITALS Alternative names: MILLS - PENINSULA HEALTH SERVICES
CHEVRON STATION NO 93989 (880 N DELAWARE ST in SAN MATEO, CA)
STATE MASTER (California - Hazardous Waste Tracking) - HAZARDOU WASTE PROGRAM Small Quantity Generators, between 100 kg and 1000 kg of hazardous waste/month (Resource Conservation and Recovery Act (tracking hazardous waste)) - notification Organizations: CHEVRON PRODUCTS CO (CONTACT/OWNER)
CHEVRON STATION NO 95336 (602 E 4TH AVE in SAN MATEO, CA)
STATE MASTER (California - Hazardous Waste Tracking) - HAZARDOU WASTE PROGRAM Small Quantity Generators, between 100 kg and 1000 kg of hazardous waste/month (Resource Conservation and Recovery Act (tracking hazardous waste)) - notification Organizations: CHEVRON PRODUCTS CO (CONTACT/OWNER)
NORTH SHOREVIEW ELEMENTARY (1301 CYPRESS AVE. in SAN MATEO, CA)
(National Center for Education Statistics) - STATE ID-6044978 Organizations: SAN MATEO-FOSTER CITY ELEMENTARY (SCHOOL DISTRICT)
GAZOS CREEK (INTERSECTION GAZOS CREEK RD AND HWY 101 in SAN MATEO, CA)
(Integrated Compliance Information System) - ICIS-09-1998-0104, FORMAL ENFORCEMENT ACTION Business SIC classification: REGULATION AND ADMINISTRATION OF COMMUNICATIONS, ELECTRIC, GAS, AND OTHER UTILITIES
A 1 CLEANERS (17 E 4TH AVENUE in SAN MATEO, CA)
CRITERIA AND HAZARDOUS AIR POLLUTANT INVENTORY (Inventory of air pollution sources) Small Quantity Generators, between 100 kg and 1000 kg of hazardous waste/month (Resource Conservation and Recovery Act (tracking hazardous waste)) Business SIC classification: DRYCLEANING PLANTS, EXCEPT RUG CLEANING Organizations: VICTOR TAM (CONTACT/OWNER)
Alternative names: NEW A-1 CLEANERS
EQUILON ENTERPRISES LLC/SHELL STATION (94 S. EL CAMINO in SAN MATEO, CA)
HAZARDOUS WASTE BIENNIAL REPORTER (Resource Conservation and Recovery Act (tracking hazardous waste)) (Resource Conservation and Recovery Act (tracking hazardous waste))
JIMS FURNITURE REFINISHING (1015 NO AMPHLETT BLVD in SAN MATEO, CA)
Small Quantity Generators, between 100 kg and 1000 kg of hazardous waste/month (Resource Conservation and Recovery Act (tracking hazardous waste)) Organizations: JAMES G FUMAGALLI (CONTACT/OWNER)
CAR BEAUTY SHOP (341 N AMPHLETT in SAN MATEO, CA)
Small Quantity Generators, between 100 kg and 1000 kg of hazardous waste/month (Resource Conservation and Recovery Act (tracking hazardous waste)) - notification Organizations: ARMANDO & DANILO VARGAS (CONTACT/OWNER)
CARL'S CLEANERS (801 SO B STREET in SAN MATEO, CA)
CRITERIA AND HAZARDOUS AIR POLLUTANT INVENTORY (Inventory of air pollution sources) Small Quantity Generators, between 100 kg and 1000 kg of hazardous waste/month (Resource Conservation and Recovery Act (tracking hazardous waste)) Business SIC classification: DRYCLEANING PLANTS, EXCEPT RUG CLEANING Alternative names: CARLS FINE DRY CLEANING
LAZERTOUCH INC (44 E FOURTH AVE in SAN MATEO, CA)
Small Quantity Generators, between 100 kg and 1000 kg of hazardous waste/month (Resource Conservation and Recovery Act (tracking hazardous waste)) - notification Organizations: KAMRAN NASSER (CONTACT/OWNER)
Housing units lacking complete plumbing facilities: 0.4% Housing units lacking complete kitchen facilities: 1.9%
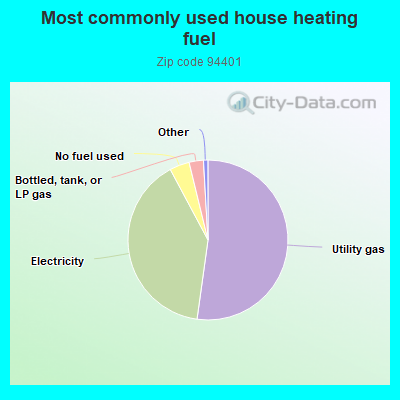
52.2%Utility gas
40.0%Electricity
4.0%No fuel used
2.9%Bottled, tank, or LP gas
Population in 1990: 28,190. Population change in the 1990s: +4,294 (+15.2%).
Place of birth for U.S.-born residents:
This state: 15,340
Northeast: 1,542
Midwest: 1,149
South: 826
West: 646
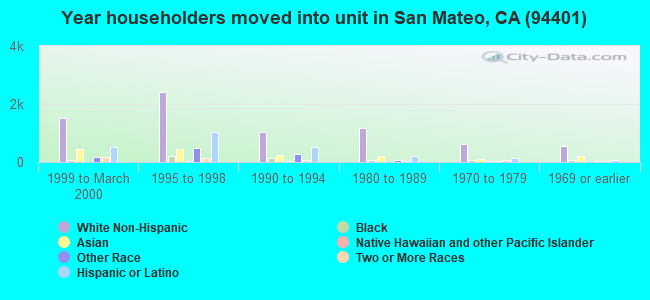
55% of the 94401 zip code residents lived in the same house 5 years ago. Out of people who lived in different houses, 65% lived in this county. Out of people who lived in different counties, 50% lived in California.
86% of the 94401 zip code residents lived in the same house 1 year ago. Out of people who lived in different houses, 43% moved from this county. Out of people who lived in different houses, 42% moved from different county within same state. Out of people who lived in different houses, 10% moved from different state. Out of people who lived in different houses, 4% moved from abroad.
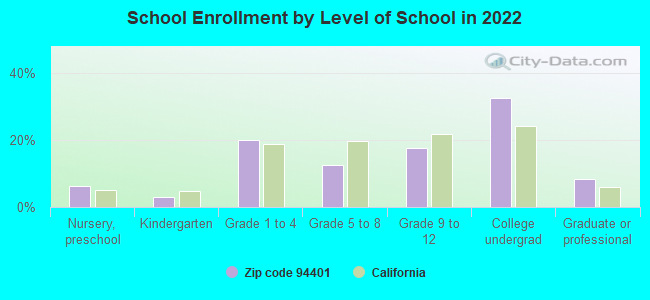
Private vs. public school enrollment:
Students in private schools in grades 1 to 8 (elementary and middle school): 285
Here:
10.4%
California:
10.5%
Students in private schools in grades 9 to 12 (high school): 127
Here:
8.6%
California:
8.5%
Students in private undergraduate colleges: 262
Here:
9.6%
California:
15.9%
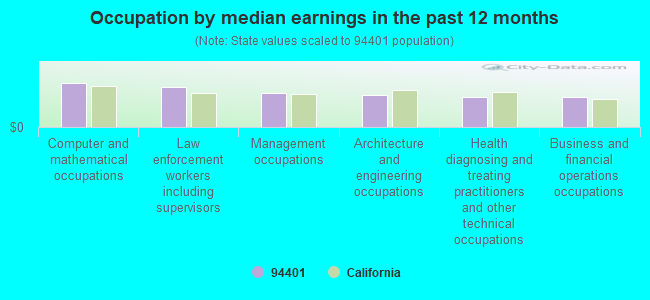
Occupation by median earnings in the past 12 months ($)
158,275Computer and mathematical occupations
142,828Law enforcement workers including supervisors
120,703Management occupations
113,529Architecture and engineering occupations
108,819Health diagnosing and treating practitioners and other technical occupations
106,828Business and financial operations occupations
Companies with federal contracts located in this zip code:
POLAR INSTRUMENTS, INC (320 EAST BELLEVUE AVENUE in SAN MATEO, CA; small business)
$26,438 with Army for Engine Instruments. Signed on 2003-09-02. Completion date: 2003-10-02.
BAYSHORE INTERNATIONAL TRUCKS, (35 N AMPHLETT BLVD in SAN MATEO, CA; small business)
$16,738 with Navy for Vehicular Cab, Body, and Frame Structural Components. Signed on 2005-07-26. Completion date: 2005-08-26.
PIERCE PACKAGING EQUIPMENT, IN (217 S CLAREMONT ST in SAN MATEO, CA; small business) : $7,798 in 2 contractsin 2006
$6,945 with Army for Rubber and Plastics Working Machinery. Signed on 2006-03-28. Completion date: 2006-05-19.
$853, same as above.Signed on 2006-06-28. Completion date: 2006-05-19.
Top industries in this zip code by the number of employees in 2005:
2005 - 2018 National Fire Incident Reporting System (NFIRS) incidents
Based on the data from the years 2005 - 2018 the average number of fire incidents per year is 44. The highest number of fire incidents - 160 took place in 2018, and the least - 10 in 2014. The data has a growing trend.
When looking into fire subcategories, the most incidents belonged to: Structure Fires (53.5%), and Outside Fires (20.1%).
Fire incident types reported to NFIRS in Zip Code 94401


 Nearest zip codes: 94403, 94010, 94404, 94402, 94002, 94065.


 Based on the data from the years 2005 - 2018 the average number of fire incidents per year is 44. The highest number of fire incidents - 160 took place in 2018, and the least - 10 in 2014. The data has a growing trend.
 When looking into fire subcategories, the most incidents belonged to: Structure Fires (53.5%), and Outside Fires (20.1%).