Estimated zip code population in 2022: 77,480 Zip code population in 2010: 69,277 Zip code population in 2000: 77,666
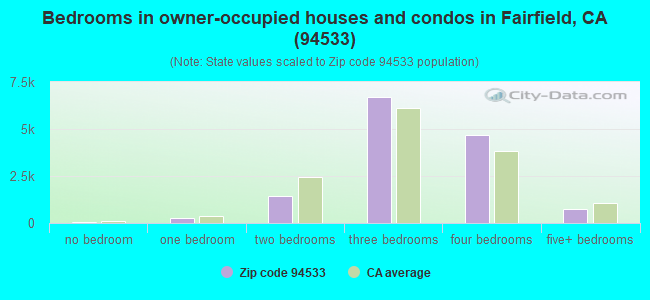
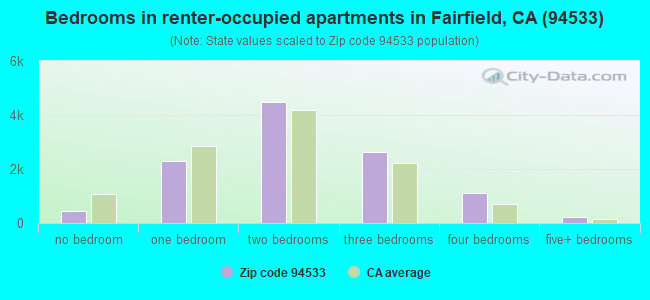
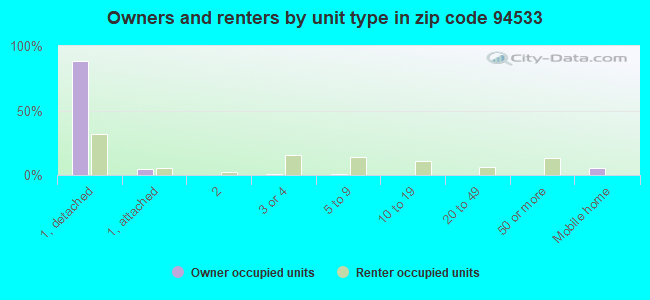
Houses and condos: 25,943 Renter-occupied apartments: 11,206
% of renters here:
45%
State:
44%
March 2022 cost of living index in zip code 94533: 111.1 (more than average, U.S. average is 100)
Land area: 21.6 sq. mi. Water area: 0.1 sq. mi.
Population density: 3,587 people per square mile
(average).
OSM Map
General Map
Google Map
MSN Map
OSM Map
General Map
Google Map
MSN Map
OSM Map
General Map
Google Map
MSN Map
OSM Map
General Map
Google Map
MSN Map
Please wait while loading the map...
Real estate property taxes paid for housing units in 2022:
This zip code:
0.7% ($3,411)
California:
0.7% ($4,831)
Median real estate property taxes paid for housing units with mortgages in 2022: $3,673 (0.7%) Median real estate property taxes paid for housing units with no mortgage in 2022: $2,346 (0.5%)
Averages for the 2020 tax year for zip code 94533, filed in 2021:
Average Adjusted Gross Income (AGI) in 2020: $60,383 (Individual Income Tax Returns)
Here:
$60,383
State:
$95,910
Salary/wage: $54,776 (reported on 84.2% of returns)
Here:
$54,776
State:
$77,331
(% of AGI for various income ranges: 1245.9% for AGIs below $25k, 4009.7% for AGIs $25k-50k, 7400.7% for AGIs $50k-75k, 10607.3% for AGIs $75k-100k, 19335.6% for AGIs $100k-200k, 57872.2% for AGIs over 200k)
Taxable interest for individuals: $724 (reported on 29.8% of returns)
This zip code:
$724
California:
$2,294
(% of AGI for various income ranges: 7.6% for AGIs below $25k, 11.2% for AGIs $25k-50k, 24.1% for AGIs $50k-75k, 46.6% for AGIs $75k-100k, 85.0% for AGIs $100k-200k, 573.9% for AGIs over 200k)
Ordinary dividends: $3,417 (reported on 9.6% of returns)
Here:
$3,417
State:
$10,949
(% of AGI for various income ranges: 6.9% for AGIs below $25k, 11.5% for AGIs $25k-50k, 26.8% for AGIs $50k-75k, 68.2% for AGIs $75k-100k, 153.1% for AGIs $100k-200k, 1011.1% for AGIs over 200k)
Net capital gain/loss in AGI: +$10,294 (reported on 9.3% of returns)
Here:
+$10,294
State:
+$49,306
(% of AGI for various income ranges: 2.3% for AGIs below $25k, 7.5% for AGIs $25k-50k, 27.0% for AGIs $50k-75k, 73.4% for AGIs $75k-100k, 247.7% for AGIs $100k-200k, 6834.2% for AGIs over 200k)
Profit/loss from business: +$7,236 (reported on 13.0% of returns)
Here:
+$7,236
State:
+$15,671
(% of AGI for various income ranges: 89.4% for AGIs below $25k, 77.2% for AGIs $25k-50k, 101.1% for AGIs $50k-75k, 226.0% for AGIs $75k-100k, 264.3% for AGIs $100k-200k, 1476.4% for AGIs over 200k)
Taxable individual retirement arrangement distribution: $19,555 (reported on 4.7% of returns)
94533:
$19,555
California:
$23,505
(% of AGI for various income ranges: 24.1% for AGIs below $25k, 35.4% for AGIs $25k-50k, 71.8% for AGIs $50k-75k, 213.2% for AGIs $75k-100k, 511.1% for AGIs $100k-200k, 1975.3% for AGIs over 200k)
Self-employed (Keogh) retirement plans: $16,500 (reported on 0.2% of returns)
94533:
$16,500
California:
$30,163
(% of AGI for various income ranges: 3.4% for AGIs $25k-50k, 13.9% for AGIs $100k-200k, 95.3% for AGIs over 200k)
Total itemized deductions: $30,377 (reported on 13.8% of returns)
Here:
$30,377
State:
$39,517
(% of AGI for various income ranges: 60.7% for AGIs below $25k, 185.9% for AGIs $25k-50k, 504.2% for AGIs $50k-75k, 1075.0% for AGIs $75k-100k, 2192.8% for AGIs $100k-200k, 7695.3% for AGIs over 200k)
Charity contributions: $6,181 (reported on 10.8% of returns)
Here:
$6,181
State:
$12,598
(% of AGI for various income ranges: 3.9% for AGIs below $25k, 19.6% for AGIs $25k-50k, 62.4% for AGIs $50k-75k, 142.7% for AGIs $75k-100k, 351.3% for AGIs $100k-200k, 1926.4% for AGIs over 200k)
Taxes paid: $7,968 (reported on 13.7% of returns)
94533:
$7,968
State:
$8,807
(% of AGI for various income ranges: 9.9% for AGIs below $25k, 37.0% for AGIs $25k-50k, 132.5% for AGIs $50k-75k, 302.5% for AGIs $75k-100k, 648.2% for AGIs $100k-200k, 1617.5% for AGIs over 200k)
Earned income credit: $2,040 (reported on 14.7% of returns)
Here:
$2,040
State:
$2,074
(% of AGI for various income ranges: 88.8% for AGIs below $25k, 60.6% for AGIs $25k-50k, 1.0% for AGIs $50k-75k)
Percentage of individuals using paid preparers for their 2020 taxes: 91.3%
Here:
91%
State:
92%
(% for various income ranges: 89.9% for AGIs below $25k, 91.4% for AGIs $25k-50k, 91.5% for AGIs $50k-75k, 92.5% for AGIs $75k-100k, 91.9% for AGIs $100k-200k, 94.4% for AGIs over 200k)
Averages for the 2012 tax year for zip code 94533, filed in 2013:
Average Adjusted Gross Income (AGI) in 2012: $47,593 (Individual Income Tax Returns)
Here:
$47,593
State:
$72,726
Salary/wage: $42,694 (reported on 85.3% of returns)
Here:
$42,694
State:
$59,079
(% of AGI for various income ranges: 79.1% for AGIs below $25k, 81.8% for AGIs $25k-50k, 77.8% for AGIs $50k-75k, 75.1% for AGIs $75k-100k, 79.0% for AGIs $100k-200k, 51.3% for AGIs over 200k)
Taxable interest for individuals: $690 (reported on 30.9% of returns)
This zip code:
$690
California:
$2,146
(% of AGI for various income ranges: 0.4% for AGIs below $25k, 0.3% for AGIs $25k-50k, 0.4% for AGIs $50k-75k, 0.4% for AGIs $75k-100k, 0.5% for AGIs $100k-200k, 0.9% for AGIs over 200k)
Ordinary dividends: $3,362 (reported on 10.1% of returns)
Here:
$3,362
State:
$9,308
(% of AGI for various income ranges: 0.4% for AGIs below $25k, 0.3% for AGIs $25k-50k, 0.5% for AGIs $50k-75k, 0.7% for AGIs $75k-100k, 0.7% for AGIs $100k-200k, 2.8% for AGIs over 200k)
Net capital gain/loss in AGI: +$4,719 (reported on 7.4% of returns)
Here:
+$4,719
State:
+$30,460
(% of AGI for various income ranges: 0.1% for AGIs $75k-100k, 0.6% for AGIs $100k-200k, 6.8% for AGIs over 200k)
Profit/loss from business: +$9,144 (reported on 10.4% of returns)
Here:
+$9,144
State:
+$17,064
(% of AGI for various income ranges: 5.4% for AGIs below $25k, 1.9% for AGIs $25k-50k, 1.2% for AGIs $50k-75k, 1.1% for AGIs $75k-100k, 0.8% for AGIs $100k-200k, 4.8% for AGIs over 200k)
Taxable individual retirement arrangement distribution: $15,497 (reported on 6.3% of returns)
94533:
$15,497
California:
$19,557
(% of AGI for various income ranges: 1.2% for AGIs below $25k, 1.2% for AGIs $25k-50k, 1.6% for AGIs $50k-75k, 2.3% for AGIs $75k-100k, 2.1% for AGIs $100k-200k, 5.7% for AGIs over 200k)
Self-employment retirement plans: $14,600 (reported on 0.1% of returns)
94533:
$14,600
California:
$24,530
Total itemized deductions: $23,440 (27% of AGI, reported on 29.5% of returns)
Here:
$23,440
State:
$34,004
Here:
26.6% of AGI
State:
22.7% of AGI
(% of AGI for various income ranges: 7.5% for AGIs below $25k, 9.5% for AGIs $25k-50k, 14.1% for AGIs $50k-75k, 17.3% for AGIs $75k-100k, 18.6% for AGIs $100k-200k, 18.4% for AGIs over 200k)
Charity contributions: $3,049 (reported on 23.9% of returns)
Here:
$3,049
State:
$4,659
(% of AGI for various income ranges: 0.5% for AGIs below $25k, 0.9% for AGIs $25k-50k, 1.7% for AGIs $50k-75k, 1.8% for AGIs $75k-100k, 2.1% for AGIs $100k-200k, 1.8% for AGIs over 200k)
Taxes paid: $7,045 (reported on 29.3% of returns)
94533:
$7,045
State:
$14,448
(% of AGI for various income ranges: 1.0% for AGIs below $25k, 2.2% for AGIs $25k-50k, 3.3% for AGIs $50k-75k, 4.8% for AGIs $75k-100k, 6.7% for AGIs $100k-200k, 7.9% for AGIs over 200k)
Earned income credit: $2,300 (reported on 20.4% of returns)
Here:
$2,300
State:
$2,286
(% of AGI for various income ranges: 6.8% for AGIs below $25k, 1.1% for AGIs $25k-50k)
Percentage of individuals using paid preparers for their 2012 taxes: 54.4%
Here:
54%
State:
64%
(% for various income ranges: 50.7% for AGIs below $25k, 54.3% for AGIs $25k-50k, 57.3% for AGIs $50k-75k, 59.7% for AGIs $75k-100k, 59.1% for AGIs $100k-200k, 72.2% for AGIs over 200k)
Averages for the 2004 tax year for zip code 94533, filed in 2005:
Average Adjusted Gross Income (AGI) in 2004: $44,020 (Individual Income Tax Returns)
Here:
$44,020
State:
$58,600
Salary/wage: $40,155 (reported on 86.0% of returns)
Here:
$40,155
State:
$49,455
(% of AGI for various income ranges: 109.1% for AGIs below $10k, 78.3% for AGIs $10k-25k, 82.2% for AGIs $25k-50k, 80.2% for AGIs $50k-75k, 82.5% for AGIs $75k-100k, 69.1% for AGIs over 100k)
Taxable interest for individuals: $1,078 (reported on 42.9% of returns)
This zip code:
$1,078
California:
$2,365
(% of AGI for various income ranges: 2.8% for AGIs below $10k, 1.3% for AGIs $10k-25k, 0.9% for AGIs $25k-50k, 1.0% for AGIs $50k-75k, 0.9% for AGIs $75k-100k, 1.2% for AGIs over 100k)
Taxable dividends: $2,112 (reported on 14.8% of returns)
Here:
$2,112
State:
$4,746
(% of AGI for various income ranges: 1.7% for AGIs below $10k, 0.6% for AGIs $10k-25k, 0.4% for AGIs $25k-50k, 0.6% for AGIs $50k-75k, 0.7% for AGIs $75k-100k, 1.2% for AGIs over 100k)
Net capital gain/loss: +$11,798 (reported on 11.2% of returns)
Here:
+$11,798
State:
+$23,418
(% of AGI for various income ranges: 1.0% for AGIs below $10k, -0.2% for AGIs $10k-25k, 0.2% for AGIs $25k-50k, 0.3% for AGIs $50k-75k, 0.5% for AGIs $75k-100k, 10.7% for AGIs over 100k)
Profit/loss from business: +$10,536 (reported on 10.8% of returns)
Here:
+$10,536
State:
+$16,826
(% of AGI for various income ranges: 3.6% for AGIs below $10k, 3.8% for AGIs $10k-25k, 2.0% for AGIs $25k-50k, 2.2% for AGIs $50k-75k, 1.8% for AGIs $75k-100k, 3.5% for AGIs over 100k)
IRA payment deduction: $2,796 (reported on 1.8% of returns)
94533:
$2,796
California:
$3,192
(% of AGI for various income ranges: 0.2% for AGIs below $10k, 0.1% for AGIs $10k-25k, 0.1% for AGIs $25k-50k, 0.1% for AGIs $50k-75k, 0.1% for AGIs $75k-100k, 0.1% for AGIs over 100k)
Self-employed pension: $11,041 (reported on 0.4% of returns)
Here:
$11,041
California:
$17,688
(% of AGI for various income ranges: 0.1% for AGIs $10k-25k, 0.1% for AGIs $25k-50k, 0.1% for AGIs $50k-75k, 0.1% for AGIs $75k-100k, 0.3% for AGIs over 100k)
Total itemized deductions: $22,416 (30% of AGI, reported on 37.5% of returns)
Here:
$22,416
State:
$28,113
Here:
30.3% of AGI
State:
25.3% of AGI
(% of AGI for various income ranges: 14.7% for AGIs below $10k, 10.2% for AGIs $10k-25k, 15.8% for AGIs $25k-50k, 21.6% for AGIs $50k-75k, 22.9% for AGIs $75k-100k, 20.9% for AGIs over 100k)
Charity contributions deductions: $2,626 (3% of AGI, reported on 32.7% of returns)
Here:
$2,626
State:
$3,923
Here:
3.4% of AGI
State:
3.3% of AGI
(% of AGI for various income ranges: 0.8% for AGIs below $10k, 0.8% for AGIs $10k-25k, 1.5% for AGIs $25k-50k, 2.1% for AGIs $50k-75k, 2.4% for AGIs $75k-100k, 2.4% for AGIs over 100k)
Total tax: $5,257 (reported on 74.0% of returns)
94533:
$5,257
State:
$10,761
(% of AGI for various income ranges: 2.9% for AGIs below $10k, 3.7% for AGIs $10k-25k, 6.0% for AGIs $25k-50k, 8.0% for AGIs $50k-75k, 9.2% for AGIs $75k-100k, 14.2% for AGIs over 100k)
Earned income credit: $1,688 (reported on 15.4% of returns)
Here:
$1,688
State:
$1,763
Percentage of individuals using paid preparers for their 2004 taxes: 59.0%
Here:
59%
State:
66%
(% for various income ranges: 49.3% for AGIs below $10k, 57.1% for AGIs $10k-25k, 59.8% for AGIs $25k-50k, 64.2% for AGIs $50k-75k, 62.8% for AGIs $75k-100k, 66.7% for AGIs over 100k)
Likely homosexual households (counted as self-reported same-sex unmarried-partner households)
Lesbian couples: 0.1% of all households
Gay men: 0.1% of all households
Household received Food Stamps/SNAP in the past 12 months: 4,006 Household did not receive Food Stamps/SNAP in the past 12 months: 21,260
Women who had a birth in the past 12 months: 1,296 (690 now married, 610 unmarried) Women who did not have a birth in the past 12 months: 17,722 (6,754 now married, 10,979 unmarried)
Housing units in zip code 94533 with a mortgage: 10,193 (764 second mortgage, 14 home equity loan, 462 both second mortgage and home equity loan) Houses without a mortgage: 248
Median monthly owner costs for units with a mortgage: $2,300 Median monthly owner costs for units without a mortgage: $606
Residents with income below the poverty level in 2022:
This zip code:
11.8%
Whole state:
12.2%
Residents with income below 50% of the poverty level in 2022:
This zip code:
5.9%
Whole state:
6.2%
Median number of rooms in houses and condos:
Here:
6.1
State:
6.0
Median number of rooms in apartments:
Here:
4.4
State:
3.9
Notable locations in this zip code not listed on our city pages
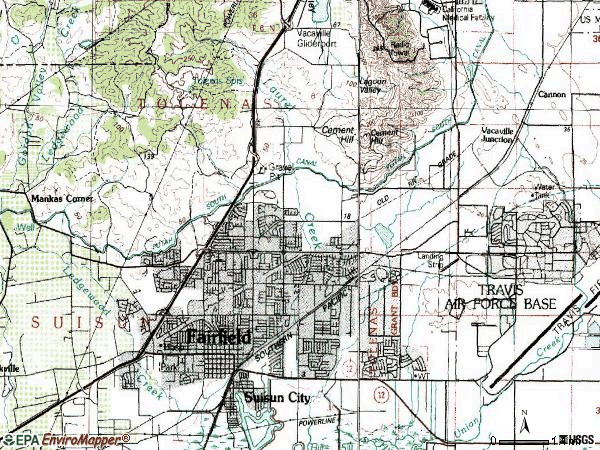
Notable locations in zip code 94533: Vallejo Water Pumping Station (A), Ray Venning Water Treatment Plant (B), Dickson Hill Water Treatment Plant (C), Solano County Courthouse (D), Fairfield-Suisun Community Branch Solano County Public Library (E), Fairfield Civic Center (F), Fairfield City Hall (G), Fairfield Fire Department Station 41 (H), Fairfield Fire Department Station 39 (I), Suisun Fire Protection District (J), Fairfield Fire Department Station 37 (K). Display/hide their locations on the map
Parks in zip code 94533 include: West Texas Street Park (1), Dover Park (2), Hillview Park (3), Laurel Creek Park (4), Lee Bell Park (5), Linear Park (6), Sunrise Park (7), Tabor Park (8), Tolenas Park (9). Display/hide their locations on the map
9,401 married couples with children.
6,045 single-parent households (1,775 men, 4,270 women).
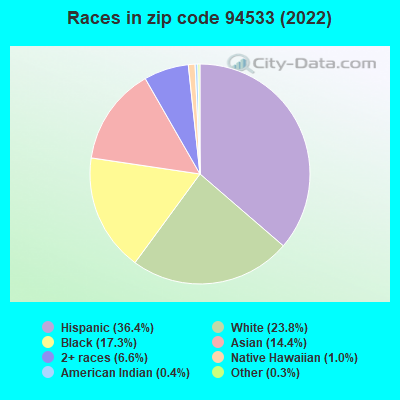
61.1% of residents of 94533 zip code speak English at home.
25.9% of residents speak Spanish at home (56% very well, 17% well, 17% not well, 9% not at all).
2.9% of residents speak other Indo-European language at home (63% very well, 31% well, 3% not well, 3% not at all).
9.4% of residents speak Asian or Pacific Island language at home (60% very well, 25% well, 13% not well, 2% not at all).
0.4% of residents speak other language at home (68% very well, 20% well, 5% not well, 7% not at all).
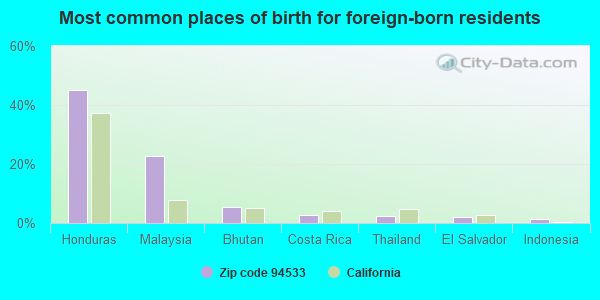
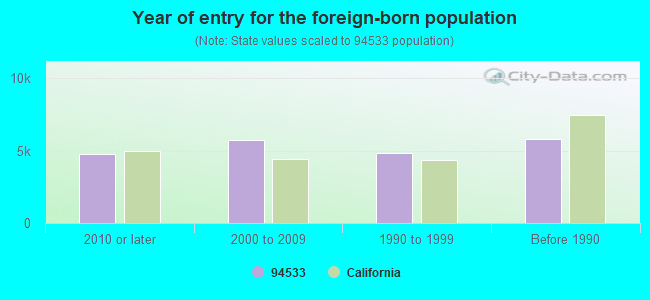
Foreign born population: 19,163 (24.7%) (46.9% of them are naturalized citizens)
Major facilities with environmental interests located in this zip code:
ANHEUSER BUSCH INCORPORATED (3101 BUSCH DRIVE in FAIRFIELD, CA)
AIR MAJOR (AIRS/AFS) STATE MASTER (California - Hazardous Waste Tracking) - HAZARDOU WASTE PROGRAM COMPLIANCE ACTIVITY (Tracking inspections of insecticide, fungicide, and rodenticide, and toxic substances) CRITERIA AND HAZARDOUS AIR POLLUTANT INVENTORY (Inventory of air pollution sources) HAZARDOUS WASTE BIENNIAL REPORTER (Resource Conservation and Recovery Act (tracking hazardous waste)) Large Quantity Generators, more that 1000 kg of hazardous waste/month (Resource Conservation and Recovery Act (tracking hazardous waste)) TRI REPORTER (Tracking of toxic chemicals releasing facilities) Business SIC classification: MALT BEVERAGES; DISTILLED AND BLENDED LIQUORS Organizations: ANHEUSER BUSCH COMPANIES (CONTACT/OPERATOR)
GREEN VALLEY FORD MAZDA (1200 OLIVER ROAD in FAIRFIELD, CA)
STATE MASTER (California - Hazardous Waste Tracking) - HAZARDOU WASTE PROGRAM CRITERIA AND HAZARDOUS AIR POLLUTANT INVENTORY (Inventory of air pollution sources) Small Quantity Generators, between 100 kg and 1000 kg of hazardous waste/month (Resource Conservation and Recovery Act (tracking hazardous waste)) - notification Small Quantity Generators, between 100 kg and 1000 kg of hazardous waste/month (Resource Conservation and Recovery Act (tracking hazardous waste)) - notification Business SIC classification: TOP, BODY, AND UPHOLSTERY REPAIR SHOPS AND PAINT SHOPS Organizations: METRO LEASING (CONTACT/OWNER)
, GEORGE VALENTE (CONTACT/OWNER)
BALL METAL BEVERAGE CONTAINER CORP. (2400 HUNTINGTON DR. in FAIRFIELD, CA)
AIR MAJOR (AIRS/AFS) CRITERIA AND HAZARDOUS AIR POLLUTANT INVENTORY (Inventory of air pollution sources) AIR MAJOR ("Best Available" air pollution technologies tracking) Large Quantity Generators, more that 1000 kg of hazardous waste/month (Resource Conservation and Recovery Act (tracking hazardous waste)) TRI REPORTER (Tracking of toxic chemicals releasing facilities) - ICIS-HQ-2004-0013, FORMAL ENFORCEMENT ACTION Business SIC classification: METAL CANS Business NAICS classification: METAL CAN MANUFACTURING.; METAL CAN MANUFACTURING. Alternative names: BALL CORP., BALL CORP., BALL METAL BEVERAGE CONTAINER GROUP, BALL METAL CONTAINER GROUP
FIRESTONE STORE #3584 (1340 TRAVIS BLVD in FAIRFIELD, CA)
(Resource Conservation and Recovery Act (tracking hazardous waste)) STATE MASTER (California - Used Oil Recycling System ) - USED OIL RECYCLING Organizations: JC PENNEY CO (CONTACT/OWNER)
Alternative names: FIRESTONE STORES
CHEVRON STATION 90163 (2395 NORTH TEXAS ST in FAIRFIELD, CA)
STATE MASTER (California - Hazardous Waste Tracking) - HAZARDOU WASTE PROGRAM Large Quantity Generators, more that 1000 kg of hazardous waste/month (Resource Conservation and Recovery Act (tracking hazardous waste)) Organizations: CHEVRON PRODUCTS CO. (CONTACT/OPERATOR)
Alternative names: CHEVRON STATION #90163
KAISER FOUNDATION HEALTH PLAN INCORPORATED (1550 GATEWAY BLVD. in FAIRFIELD, CA)
STATE MASTER (California - Hazardous Waste Tracking) - HAZARDOU WASTE PROGRAM HAZARDOUS WASTE BIENNIAL REPORTER (Resource Conservation and Recovery Act (tracking hazardous waste)) Small Quantity Generators, between 100 kg and 1000 kg of hazardous waste/month (Resource Conservation and Recovery Act (tracking hazardous waste)) - notification Organizations: KAISER FOUNDATION HOSPITALS (CONTACT/OWNER)
Alternative names: KAISER FAIRFIELD MEDL OFS BL, KAISER PERMANENTE
HERMAN GOELITZ CANDY COMPANY (2400 N WATNEY WAY in FAIRFIELD, CA)
AIR MINOR (AIRS/AFS) (Integrated Compliance Information System) - ICIS-09-1999-0124, FORMAL ENFORCEMENT ACTION CRITERIA AND HAZARDOUS AIR POLLUTANT INVENTORY (Inventory of air pollution sources) Business SIC classification: CANDY AND OTHER CONFECTIONERY PRODUCTS
EQUILON ENTERPRISES (3345 N TEXAS/I-80 in FAIRFIELD, CA) . Federal Facility
STATE MASTER (California - Hazardous Waste Tracking) - HAZARDOU WASTE PROGRAM HAZARDOUS WASTE BIENNIAL REPORTER (Resource Conservation and Recovery Act (tracking hazardous waste)) Small Quantity Generators, between 100 kg and 1000 kg of hazardous waste/month (Resource Conservation and Recovery Act (tracking hazardous waste)) - notification Organizations: EQUILON ENTERPRISES, LLC (CONTACT/OWNER)
Alternative names: SHELL OIL CO
CAL TRANS (2019 TEXAS ST in FAIRFIELD, CA)
STATE MASTER (California - Hazardous Waste Tracking) - HAZARDOU WASTE PROGRAM Small Quantity Generators, between 100 kg and 1000 kg of hazardous waste/month (Resource Conservation and Recovery Act (tracking hazardous waste)) - notification Organizations: CALIFORNIA STATE OF (CONTACT/OWNER)
Alternative names: CALTRANS DISTRICT 4
EXXON COMPANY USA NUMBER 73909 (2595 N TEXAS ST in FAIRFIELD, CA)
STATE MASTER (California - Hazardous Waste Tracking) - HAZARDOU WASTE PROGRAM HAZARDOUS WASTE BIENNIAL REPORTER (Resource Conservation and Recovery Act (tracking hazardous waste)) Small Quantity Generators, between 100 kg and 1000 kg of hazardous waste/month (Resource Conservation and Recovery Act (tracking hazardous waste)) - notification Organizations: EXXON MOBIL (CONTACT/OWNER)
Alternative names: EXXON MOBIL CORPORATION #739090, EXXON RAS 73909
FAIRFIELD PONTIAC BUICK GMC INC (2525 MARTIN ROAD in FAIRFIELD, CA)
STATE MASTER (California - Hazardous Waste Tracking) - HAZARDOU WASTE PROGRAM Small Quantity Generators, between 100 kg and 1000 kg of hazardous waste/month (Resource Conservation and Recovery Act (tracking hazardous waste)) - notification Organizations: ELEANOR FELBAUM (CONTACT/OWNER)
Alternative names: FAIRFIELD PONTIAC, BUICK, G M C INC, GEBERS MOTOR CO
AMY BLANC ELEMENTARY SCHOOL (230 ATLANTIC AVENUE in FAIRFIELD, CA)
(Geographic Names Information System) (National Center for Education Statistics) - STATE ID-6051056 Organizations: FAIRFIELD-SUISUN UNIFIED (SCHOOL DISTRICT)
Alternative names: BLANC (AMY) ELEMENTARY
ANNA KYLE ELEMENTARY SCHOOL (1600 KIDDER AVENUE in FAIRFIELD, CA)
(Geographic Names Information System) (National Center for Education Statistics) - STATE ID-6051064 Organizations: FAIRFIELD-SUISUN UNIFIED (SCHOOL DISTRICT)
Alternative names: KYLE (ANNA) ELEMENTARY
Housing units lacking complete plumbing facilities: 0.4% Housing units lacking complete kitchen facilities: 1.0%
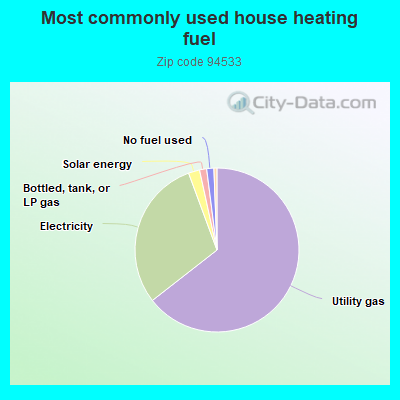
64.2%Utility gas
29.8%Electricity
2.2%Solar energy
1.4%Bottled, tank, or LP gas
1.4%No fuel used
0.6%Wood
Population in 1990: 65,455. Population change in the 1990s: +12,211 (+18.7%).
Place of birth for U.S.-born residents:
This state: 43,799
Northeast: 1,570
Midwest: 2,754
South: 5,552
West: 2,589
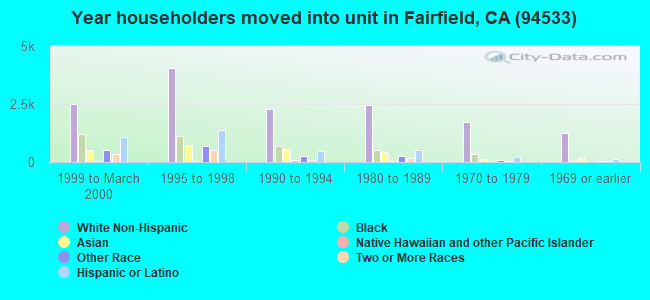
51% of the 94533 zip code residents lived in the same house 5 years ago. Out of people who lived in different houses, 60% lived in this county. Out of people who lived in different counties, 50% lived in California.
88% of the 94533 zip code residents lived in the same house 1 year ago. Out of people who lived in different houses, 51% moved from this county. Out of people who lived in different houses, 31% moved from different county within same state. Out of people who lived in different houses, 9% moved from different state. Out of people who lived in different houses, 9% moved from abroad.
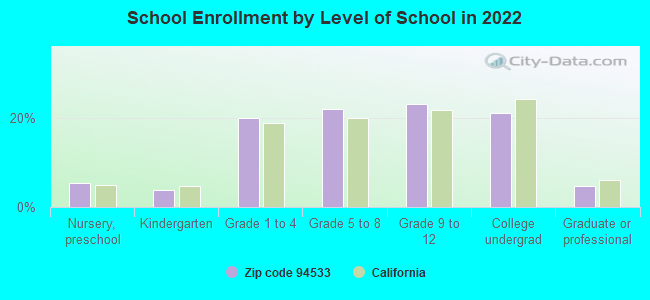
Private vs. public school enrollment:
Students in private schools in grades 1 to 8 (elementary and middle school): 684
Here:
8.7%
California:
10.5%
Students in private schools in grades 9 to 12 (high school): 183
Here:
4.3%
California:
8.5%
Students in private undergraduate colleges: 393
Here:
10.1%
California:
15.9%
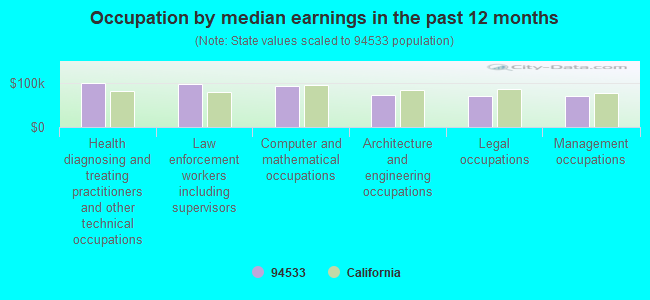
Occupation by median earnings in the past 12 months ($)
99,629Health diagnosing and treating practitioners and other technical occupations
96,428Law enforcement workers including supervisors
93,168Computer and mathematical occupations
73,279Architecture and engineering occupations
70,282Legal occupations
69,558Management occupations
Companies with biggest federal contracts located in this zip code (FAIRFIELD, CA):
UNIVERSAL PROPULSION COMPANY I (3530 BRANSCOMBE RD) : $53,751,643 in 280 contractsfrom 1999 to 2006
Contracts for Cartridge and Propellant Actuated Devices and Components, Space Science and Applications -- Engineering Development (R&D), Guided Missile Warheads and Explosive Components, Miscellaneous Special Industry Machinery, and moreby Air Force, Navy, NASA, Defense Logistics Agency, and others Signed by year:2000: $8,253,028; 2001: $21,995,236; 2002: $5,822,053; 2003: $7,414,080; 2004: $5,571,767; 2005: $3,100,684; 2006: $1,448,673.
Biggest contracts:
$10,120,594 with Air Force for Cartridge and Propellant Actuated Devices and Components. Signed on 2001-07-25. Completion date: 2002-04-30.
$1,102,142 with Navy for Cartridge and Propellant Actuated Devices and Components. Signed on 2001-05-17. Completion date: 2002-05-17.
$1,073,278, same as above.Signed on 2001-03-13. Completion date: 2002-07-08.
$738,770, same as above.Signed on 2005-02-22. Completion date: 2006-06-16.
PAULI SYSTEMS, INC (1820 WALTERS COURT; small business) : $7,188,370 in 97 contractsfrom 1999 to 2006
Contracts for Aircraft Maintenance and Repair Shop Specialized Equipment, Miscellaneous Special Industry Machinery, Miscellaneous Maintenance and Repair Shop Specialized Equipment, Outerwear, Men's, and moreby Air Force, Navy, Army, Defense Logistics Agency, and others Signed by year:2000: $678,686; 2001: $287,652; 2002: $67,139; 2003: $424,190; 2004: $3,021,335; 2005: $2,142,814; 2006: $558,453.
Biggest contracts:
$1,388,800 with Air Force for Aircraft Maintenance and Repair Shop Specialized Equipment. Signed on 2004-12-17. Completion date: 2005-09-01.
$342,240 with Navy for Miscellaneous Special Industry Machinery. Signed on 2000-09-27. Completion date: 2001-08-02.
$253,788 with Air Force for Aircraft Maintenance and Repair Shop Specialized Equipment. Taking place in NV. Signed on 2005-08-08. Completion date: 2005-11-28.
$248,072 with Air Force for Miscellaneous Maintenance and Repair Shop Specialized Equipment. Signed on 2005-09-30. Completion date: 2006-02-17.
JELLY BELLY CANDY COMPANY (1 JELLY BELLY LN) : $2,185,957 in 6 contractsfrom 2004 to 2006
Contracts for Food Items For Resale by Defense Commissary Agency Signed by year:2000: $0; 2001: $0; 2002: $0; 2003: $0; 2004: $413,013; 2005: $1,285,477; 2006: $487,467.
Biggest contracts:
$737,628 with Defense Commissary Agency for Food Items For Resale. Signed on 2005-04-01. Completion date: 2005-08-31.
$487,467, same as above.Signed on 2006-01-01. Completion date: 2006-03-31.
$413,013, same as above.Signed on 2004-10-01. Completion date: 2005-02-28.
$258,496, same as above.Signed on 2005-10-01. Completion date: 2005-12-31.
SOLANO GARBAGE COMPANY (2901) : $1,378,794 in 6 contractsfrom 2000 to 2001
Contracts for Other Utilities, Miscellaneous Items by Air Force Signed by year:2000: $467,905; 2001: $910,889; 2002: $0; 2003: $0; 2004: $0; 2005: $0; 2006: $0.
Biggest contracts:
$738,127 with Air Force for Other Utilities. Signed on 2001-04-10. Completion date: 2002-10-30.
$172,762, same as above.Signed on 2001-10-01. Completion date: 2002-09-30.
$172,762 with Air Force for Miscellaneous Items. Signed on 2000-10-18. Completion date: 2001-09-30.
$172,762, same as above.Signed on 2000-12-05. Completion date: 2001-10-30.
CREEGAN + D ANGELO, A CALIFORN (2420 MARTIN ROAD, SUITE 38; small business) : $1,068,812 in 10 contractsfrom 2003 to 2006
Contracts for Architect - Engineer Services (including landscaping, interior layout, and designing) by Air Force Signed by year:2000: $0; 2001: $0; 2002: $0; 2003: $358,600; 2004: $351,055; 2005: $252,917; 2006: $106,240.
Biggest contracts:
$353,600 with Air Force for Architect - Engineer Services (including landscaping, interior layout, and designing). Signed on 2003-12-18. Completion date: 2004-06-18.
$200,000, same as above.Signed on 2005-01-18. Completion date: 2005-08-31.
$170,000, same as above.Signed on 2004-07-12. Completion date: 2004-11-24.
$153,451, same as above.Signed on 2004-01-15. Completion date: 2004-10-01.
CANOVA MOVING & STORAGE COMPAN (1336 WOOLNER AVENUE; small business) : $518,492 in 5 contractsfrom 2002 to 2005
Contracts for Packing/Crating Services, Other Cargo and Freight Services, Personal Services Contracts by Air Force Signed by year:2000: $0; 2001: $0; 2002: $50,000; 2003: $163,125; 2004: $131,373; 2005: $173,994; 2006: $0.
Biggest contracts:
$173,994 with Air Force for Packing/Crating Services. Signed on 2005-11-14. Completion date: 2006-09-30.
$170,371 with Air Force for Other Cargo and Freight Services. Signed on 2004-11-05. Completion date: 2005-09-30.
$163,125 with Air Force for Personal Services Contracts. Signed on 2003-10-01. Completion date: 2004-09-30.
$50,000, same as above.Signed on 2002-07-15. Completion date: 2002-09-30.
CODE THREE FIRE PROTECTION SYS (605 RAILROAD AVE STE D; small business) : $485,399 in 17 contractsfrom 1999 to 2006
Contracts for Maintenance, Repair and Rebuilding of Equipment -- Fire Fighting, Rescue, and Safety Equipment; and Environmental Protection Equipment and Materials, Maintenance, Repair and Rebuilding of Equipment -- Miscellaneous, Technical Representation Services -- Fire Fighting, Rescue, and Safety Equipment; and Environmental Protection Equipment and Materials, Maintenance, Repair or Alteration of Real Property -- Other Warehouse Buildings, and moreby Air Force Signed by year:2000: $31,968; 2001: $37,508; 2002: $76,558; 2003: $136,971; 2004: -$18,767; 2005: $162,894; 2006: -$3,000.
Biggest contracts:
$93,956 with Air Force for Maintenance, Repair and Rebuilding of Equipment -- Fire Fighting, Rescue, and Safety Equipment; and Environmental Protection Equipment and Materials. Signed on 2005-12-07. Completion date: 2006-09-30.
$81,171, same as above.Signed on 2003-12-01. Completion date: 2008-09-30.
$67,508 with Air Force for Maintenance, Repair and Rebuilding of Equipment -- Miscellaneous. Signed on 2002-10-04. Completion date: 2003-09-30.
$67,508, same as above.Signed on 2001-10-01. Completion date: 2001-11-07.
CALIFORNIA RIDER EDUCATION (2595 HUTCHEON PLACE; small business) : $285,900 in 5 contractsfrom 2002 to 2005
Contracts for Other Education and Training Services by Air Force Signed by year:2000: $0; 2001: $0; 2002: $40,000; 2003: $41,250; 2004: $119,780; 2005: $84,870; 2006: $0.
Biggest contracts:
$84,870 with Air Force for Other Education and Training Services. Signed on 2005-10-01. Completion date: 2006-09-30.
$79,850, same as above.Signed on 2004-11-01. Completion date: 2005-09-30.
$41,250, same as above.Signed on 2003-10-01. Completion date: 2007-09-30.
$40,000, same as above.Signed on 2002-10-04. Completion date: 2003-09-30.
SOLANO COMMUNICATIONS & ELECTR (2477 COURAGE DR,SUITE D; small business) : $141,186 in 3 contractsfrom 2000 to 2005
$123,540 with Air Force for Maintenance, Repair and Rebuilding of Equipment -- Communication, Detection, and Coherent Radiation Equipment. Signed on 2005-09-29. Completion date: 2005-10-29.
$13,646 with Air Force for Intercommunication and Public Address Systems, Except Airborne. Signed on 2005-08-25. Completion date: 2005-09-01.
$4,000 with Air Force for Maintenance, Repair or Alteration of Real Property -- Office Buildings. Signed on 2000-02-01. Completion date: 2000-02-02.
SNORKEL POOL SERVICE (2401-A WATERMAN BLVD; small business) : $63,500 in 2 contractsin 2000
$37,000 with Air Force for Maintenance, Repair or Alteration of Real Property -- Recreation Facilities (Non-Building). Signed on 2000-10-06. Completion date: 2001-09-30.
$26,500, same as above.Signed on 2000-05-03. Completion date: 2000-05-03.
Top industries in this zip code by the number of employees in 2005:
2005 - 2018 National Fire Incident Reporting System (NFIRS) incidents
According to the data from the years 2005 - 2018 the average number of fire incidents per year is 198. The highest number of fires - 459 took place in 2017, and the least - 5 in 2006. The data has an increasing trend.
When looking into fire subcategories, the most incidents belonged to: Outside Fires (61.5%), and Structure Fires (18.4%).
Fire incident types reported to NFIRS in Zip Code 94533


 Nearest zip codes: 94535, 95687, 94585, 95625, 95688, 94534.


 According to the data from the years 2005 - 2018 the average number of fire incidents per year is 198. The highest number of fires - 459 took place in 2017, and the least - 5 in 2006. The data has an increasing trend.
 When looking into fire subcategories, the most incidents belonged to: Outside Fires (61.5%), and Structure Fires (18.4%).