Estimated zip code population in 2022: 29,156 Zip code population in 2010: 28,263 Zip code population in 2000: 39,260
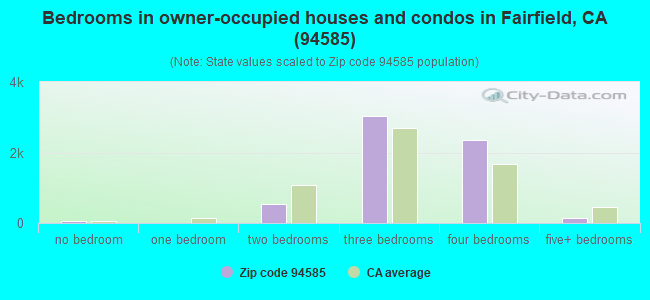
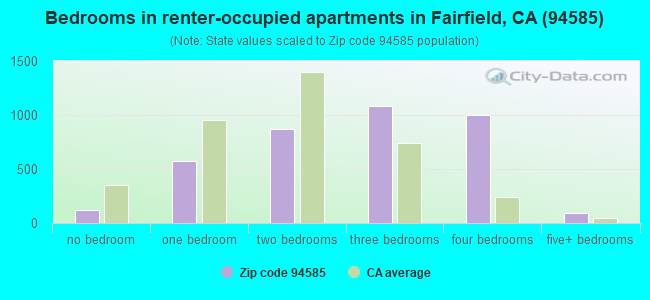
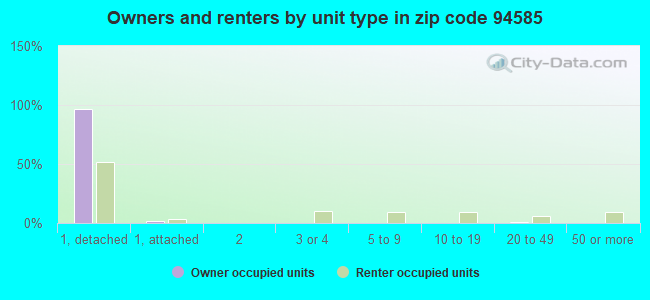
Houses and condos: 10,068 Renter-occupied apartments: 3,737
% of renters here:
38%
State:
44%
March 2022 cost of living index in zip code 94585: 111.2 (more than average, U.S. average is 100)
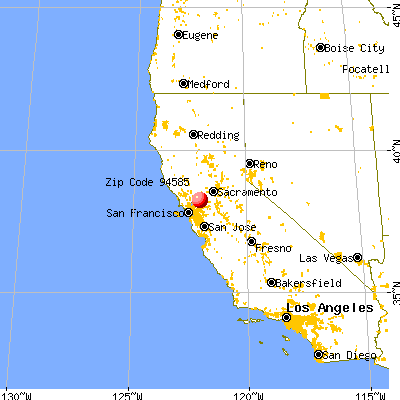
Land area: 112.4 sq. mi. Water area: 4.9 sq. mi.
Population density: 259 people per square mile
(very low).
OSM Map
General Map
Google Map
MSN Map
OSM Map
General Map
Google Map
MSN Map
OSM Map
General Map
Google Map
MSN Map
OSM Map
General Map
Google Map
MSN Map
Please wait while loading the map...
Real estate property taxes paid for housing units in 2022:
This zip code:
0.8% ($4,176)
California:
0.7% ($4,831)
Median real estate property taxes paid for housing units with mortgages in 2022: $4,485 (0.8%) Median real estate property taxes paid for housing units with no mortgage in 2022: $2,839 (0.6%)
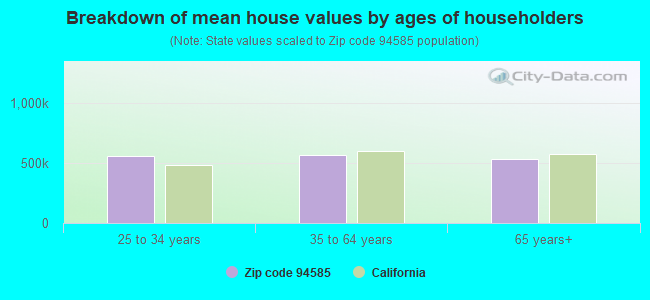
Estimated median house/condo value in 2022: $528,265
94585:
$528,265
California:
$715,900
According to our research of California and other state lists, there were 43 registered sex offenders living in 94585 zip code as of April 27, 2024. The ratio of all residents to sex offenders in zip code 94585 is 696 to 1. The ratio of registered sex offenders to all residents in this zip code is near the state average.
Median resident age:
This zip code:
36.5 years
California median age:
37.9 years
Average household size:
This zip code:
2.9 people
California:
2.8 people
Averages for the 2020 tax year for zip code 94585, filed in 2021:
Average Adjusted Gross Income (AGI) in 2020: $62,306 (Individual Income Tax Returns)
Here:
$62,306
State:
$95,910
Salary/wage: $57,437 (reported on 85.1% of returns)
Here:
$57,437
State:
$77,331
(% of AGI for various income ranges: 1218.1% for AGIs below $25k, 3813.0% for AGIs $25k-50k, 7128.8% for AGIs $50k-75k, 10805.0% for AGIs $75k-100k, 19837.2% for AGIs $100k-200k, 61431.0% for AGIs over 200k)
Taxable interest for individuals: $382 (reported on 33.5% of returns)
This zip code:
$382
California:
$2,294
(% of AGI for various income ranges: 5.6% for AGIs below $25k, 8.3% for AGIs $25k-50k, 19.1% for AGIs $50k-75k, 31.2% for AGIs $75k-100k, 39.1% for AGIs $100k-200k, 281.0% for AGIs over 200k)
Ordinary dividends: $1,988 (reported on 9.1% of returns)
Here:
$1,988
State:
$10,949
(% of AGI for various income ranges: 6.5% for AGIs below $25k, 8.0% for AGIs $25k-50k, 21.9% for AGIs $50k-75k, 32.0% for AGIs $75k-100k, 60.6% for AGIs $100k-200k, 690.0% for AGIs over 200k)
Net capital gain/loss in AGI: +$7,792 (reported on 8.9% of returns)
Here:
+$7,792
State:
+$49,306
(% of AGI for various income ranges: 4.6% for AGIs below $25k, 5.4% for AGIs $25k-50k, 31.1% for AGIs $50k-75k, 57.0% for AGIs $75k-100k, 175.1% for AGIs $100k-200k, 6442.0% for AGIs over 200k)
Profit/loss from business: +$5,180 (reported on 12.1% of returns)
Here:
+$5,180
State:
+$15,671
(% of AGI for various income ranges: 46.6% for AGIs below $25k, 60.6% for AGIs $25k-50k, 76.3% for AGIs $50k-75k, 125.8% for AGIs $75k-100k, 120.9% for AGIs $100k-200k, 1849.0% for AGIs over 200k)
Taxable individual retirement arrangement distribution: $17,218 (reported on 4.8% of returns)
94585:
$17,218
California:
$23,505
(% of AGI for various income ranges: 32.7% for AGIs below $25k, 62.1% for AGIs $25k-50k, 84.7% for AGIs $50k-75k, 152.1% for AGIs $75k-100k, 336.3% for AGIs $100k-200k, 1791.0% for AGIs over 200k)
Total itemized deductions: $27,909 (reported on 15.3% of returns)
Here:
$27,909
State:
$39,517
(% of AGI for various income ranges: 82.2% for AGIs below $25k, 232.5% for AGIs $25k-50k, 557.4% for AGIs $50k-75k, 1117.8% for AGIs $75k-100k, 1785.3% for AGIs $100k-200k, 7299.0% for AGIs over 200k)
Charity contributions: $5,314 (reported on 11.7% of returns)
Here:
$5,314
State:
$12,598
(% of AGI for various income ranges: 4.6% for AGIs below $25k, 30.6% for AGIs $25k-50k, 67.5% for AGIs $50k-75k, 134.2% for AGIs $75k-100k, 295.3% for AGIs $100k-200k, 1477.0% for AGIs over 200k)
Taxes paid: $7,857 (reported on 15.1% of returns)
94585:
$7,857
State:
$8,807
(% of AGI for various income ranges: 17.0% for AGIs below $25k, 49.1% for AGIs $25k-50k, 147.9% for AGIs $50k-75k, 331.7% for AGIs $75k-100k, 573.0% for AGIs $100k-200k, 1539.0% for AGIs over 200k)
Earned income credit: $1,940 (reported on 12.9% of returns)
Here:
$1,940
State:
$2,074
(% of AGI for various income ranges: 74.2% for AGIs below $25k, 56.2% for AGIs $25k-50k, 1.2% for AGIs $50k-75k)
Percentage of individuals using paid preparers for their 2020 taxes: 91.4%
Here:
91%
State:
92%
(% for various income ranges: 90.5% for AGIs below $25k, 91.9% for AGIs $25k-50k, 91.0% for AGIs $50k-75k, 91.9% for AGIs $75k-100k, 92.0% for AGIs $100k-200k, 93.9% for AGIs over 200k)
Averages for the 2012 tax year for zip code 94585, filed in 2013:
Average Adjusted Gross Income (AGI) in 2012: $51,469 (Individual Income Tax Returns)
Here:
$51,469
State:
$72,726
Salary/wage: $47,935 (reported on 87.8% of returns)
Here:
$47,935
State:
$59,079
(% of AGI for various income ranges: 76.9% for AGIs below $25k, 82.3% for AGIs $25k-50k, 82.0% for AGIs $50k-75k, 83.3% for AGIs $75k-100k, 83.9% for AGIs $100k-200k, 68.0% for AGIs over 200k)
Taxable interest for individuals: $374 (reported on 36.2% of returns)
This zip code:
$374
California:
$2,146
(% of AGI for various income ranges: 0.4% for AGIs below $25k, 0.2% for AGIs $25k-50k, 0.3% for AGIs $50k-75k, 0.2% for AGIs $75k-100k, 0.2% for AGIs $100k-200k, 0.3% for AGIs over 200k)
Ordinary dividends: $1,518 (reported on 9.2% of returns)
Here:
$1,518
State:
$9,308
(% of AGI for various income ranges: 0.5% for AGIs below $25k, 0.2% for AGIs $25k-50k, 0.3% for AGIs $50k-75k, 0.2% for AGIs $75k-100k, 0.2% for AGIs $100k-200k, 0.9% for AGIs over 200k)
Net capital gain/loss in AGI: +$823 (reported on 6.5% of returns)
Here:
+$823
State:
+$30,460
(% of AGI for various income ranges: 0.3% for AGIs $100k-200k, 0.7% for AGIs over 200k)
Profit/loss from business: +$7,344 (reported on 11.1% of returns)
Here:
+$7,344
State:
+$17,064
(% of AGI for various income ranges: 6.2% for AGIs below $25k, 1.7% for AGIs $25k-50k, 1.3% for AGIs $50k-75k, 0.7% for AGIs $75k-100k, 1.2% for AGIs $100k-200k)
Taxable individual retirement arrangement distribution: $15,246 (reported on 5.1% of returns)
94585:
$15,246
California:
$19,557
(% of AGI for various income ranges: 1.4% for AGIs below $25k, 1.2% for AGIs $25k-50k, 1.3% for AGIs $50k-75k, 1.6% for AGIs $75k-100k, 2.0% for AGIs $100k-200k)
Total itemized deductions: $21,862 (27% of AGI, reported on 38.5% of returns)
Here:
$21,862
State:
$34,004
Here:
26.8% of AGI
State:
22.7% of AGI
(% of AGI for various income ranges: 10.3% for AGIs below $25k, 12.7% for AGIs $25k-50k, 17.3% for AGIs $50k-75k, 17.5% for AGIs $75k-100k, 18.7% for AGIs $100k-200k, 17.2% for AGIs over 200k)
Charity contributions: $2,730 (reported on 29.8% of returns)
Here:
$2,730
State:
$4,659
(% of AGI for various income ranges: 0.5% for AGIs below $25k, 1.1% for AGIs $25k-50k, 1.6% for AGIs $50k-75k, 1.8% for AGIs $75k-100k, 1.9% for AGIs $100k-200k, 1.8% for AGIs over 200k)
Taxes paid: $6,427 (reported on 38.5% of returns)
94585:
$6,427
State:
$14,448
(% of AGI for various income ranges: 1.7% for AGIs below $25k, 2.7% for AGIs $25k-50k, 4.3% for AGIs $50k-75k, 5.3% for AGIs $75k-100k, 6.6% for AGIs $100k-200k, 7.3% for AGIs over 200k)
Earned income credit: $2,110 (reported on 18.3% of returns)
Here:
$2,110
State:
$2,286
(% of AGI for various income ranges: 6.4% for AGIs below $25k, 1.1% for AGIs $25k-50k)
Percentage of individuals using paid preparers for their 2012 taxes: 50.5%
Here:
51%
State:
64%
(% for various income ranges: 44.5% for AGIs below $25k, 49.1% for AGIs $25k-50k, 55.3% for AGIs $50k-75k, 54.4% for AGIs $75k-100k, 59.1% for AGIs $100k-200k, 70.0% for AGIs over 200k)
Averages for the 2004 tax year for zip code 94585, filed in 2005:
Average Adjusted Gross Income (AGI) in 2004: $49,328 (Individual Income Tax Returns)
Here:
$49,328
State:
$58,600
Salary/wage: $45,228 (reported on 91.1% of returns)
Here:
$45,228
State:
$49,455
(% of AGI for various income ranges: 139.6% for AGIs below $10k, 82.1% for AGIs $10k-25k, 86.7% for AGIs $25k-50k, 87.6% for AGIs $50k-75k, 90.5% for AGIs $75k-100k, 70.8% for AGIs over 100k)
Taxable interest for individuals: $670 (reported on 45.7% of returns)
This zip code:
$670
California:
$2,365
(% of AGI for various income ranges: 3.3% for AGIs below $10k, 0.7% for AGIs $10k-25k, 0.5% for AGIs $25k-50k, 0.4% for AGIs $50k-75k, 0.3% for AGIs $75k-100k, 1.0% for AGIs over 100k)
Taxable dividends: $1,094 (reported on 12.4% of returns)
Here:
$1,094
State:
$4,746
(% of AGI for various income ranges: 0.9% for AGIs below $10k, 0.4% for AGIs $10k-25k, 0.3% for AGIs $25k-50k, 0.3% for AGIs $50k-75k, 0.1% for AGIs $75k-100k, 0.4% for AGIs over 100k)
Net capital gain/loss: +$9,797 (reported on 9.1% of returns)
Here:
+$9,797
State:
+$23,418
(% of AGI for various income ranges: -1.3% for AGIs below $10k, -0.0% for AGIs $10k-25k, 0.1% for AGIs $25k-50k, 0.2% for AGIs $50k-75k, 0.2% for AGIs $75k-100k, 6.1% for AGIs over 100k)
Profit/loss from business: +$7,717 (reported on 11.4% of returns)
Here:
+$7,717
State:
+$16,826
(% of AGI for various income ranges: 2.3% for AGIs below $10k, 4.8% for AGIs $10k-25k, 2.0% for AGIs $25k-50k, 1.7% for AGIs $50k-75k, 1.3% for AGIs $75k-100k, 1.3% for AGIs over 100k)
IRA payment deduction: $2,724 (reported on 1.7% of returns)
94585:
$2,724
California:
$3,192
(% of AGI for various income ranges: 0.2% for AGIs $10k-25k, 0.2% for AGIs $25k-50k, 0.1% for AGIs $50k-75k, 0.1% for AGIs $75k-100k, 0.0% for AGIs over 100k)
Self-employed pension: $9,326 (reported on 0.4% of returns)
Here:
$9,326
California:
$17,688
(% of AGI for various income ranges: 0.2% for AGIs $10k-25k, 0.1% for AGIs $50k-75k, 0.2% for AGIs over 100k)
Total itemized deductions: $24,247 (32% of AGI, reported on 48.2% of returns)
Here:
$24,247
State:
$28,113
Here:
31.9% of AGI
State:
25.3% of AGI
(% of AGI for various income ranges: 24.0% for AGIs below $10k, 13.5% for AGIs $10k-25k, 23.0% for AGIs $25k-50k, 26.1% for AGIs $50k-75k, 26.4% for AGIs $75k-100k, 22.5% for AGIs over 100k)
Charity contributions deductions: $2,460 (3% of AGI, reported on 42.0% of returns)
Here:
$2,460
State:
$3,923
Here:
3.1% of AGI
State:
3.3% of AGI
(% of AGI for various income ranges: 0.8% for AGIs below $10k, 0.9% for AGIs $10k-25k, 1.6% for AGIs $25k-50k, 2.2% for AGIs $50k-75k, 2.4% for AGIs $75k-100k, 2.5% for AGIs over 100k)
Total tax: $5,523 (reported on 76.9% of returns)
94585:
$5,523
State:
$10,761
(% of AGI for various income ranges: 3.6% for AGIs below $10k, 4.2% for AGIs $10k-25k, 5.7% for AGIs $25k-50k, 7.2% for AGIs $50k-75k, 8.3% for AGIs $75k-100k, 13.3% for AGIs over 100k)
Earned income credit: $1,646 (reported on 12.9% of returns)
Here:
$1,646
State:
$1,763
Percentage of individuals using paid preparers for their 2004 taxes: 58.5%
Here:
58%
State:
66%
(% for various income ranges: 45.9% for AGIs below $10k, 56.6% for AGIs $10k-25k, 59.9% for AGIs $25k-50k, 61.8% for AGIs $50k-75k, 64.2% for AGIs $75k-100k, 64.5% for AGIs over 100k)
Likely homosexual households (counted as self-reported same-sex unmarried-partner households)
Lesbian couples: 0.5% of all households
Gay men: 0.0% of all households
Household received Food Stamps/SNAP in the past 12 months: 1,286 Household did not receive Food Stamps/SNAP in the past 12 months: 8,549
Women who had a birth in the past 12 months: 275 (158 now married, 117 unmarried) Women who did not have a birth in the past 12 months: 6,699 (2,694 now married, 4,003 unmarried)
Housing units in zip code 94585 with a mortgage: 4,796 (345 second mortgage, 247 both second mortgage and home equity loan) Median monthly owner costs for units with a mortgage: $2,286 Median monthly owner costs for units without a mortgage: $571
Residents with income below the poverty level in 2022:
This zip code:
9.1%
Whole state:
12.2%
Residents with income below 50% of the poverty level in 2022:
This zip code:
4.9%
Whole state:
6.2%
Median number of rooms in houses and condos:
Here:
6.1
State:
6.0
Median number of rooms in apartments:
Here:
5.1
State:
3.9
Notable locations in this zip code not listed on our city pages
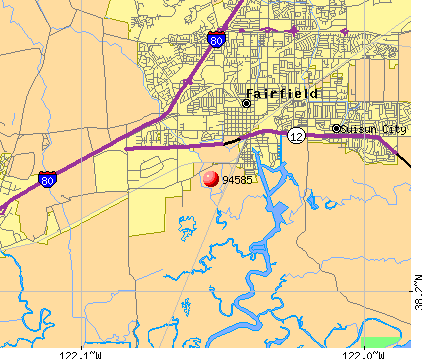
Notable locations in zip code 94585: California Club (A), Vennink Club (B), Potrero Hills Landfill (C), Montezuma Club (D), Birds Landing (E), Montezuma Landing (F), Lambie Ranch (G), Hansen Ranch (H), Rush Landing (I), Montezuma (J), Lingos Landing (K), Grizzly Island Club (L), Beldons Landing (M), Memorial Building (N), Travis Air Force Base Fire Department (O), City of Suisun City Fire Department (P). Display/hide their locations on the map
Streams, rivers, and creeks: Denverton Creek (A), Denverton Slough (B), First Mallard Branch (C), Hill Slough (D), Laurel Creek (E), Union Creek (F), Spring Branch (G), Second Mallard Branch (H). Display/hide their locations on the map
3,871 married couples with children.
1,865 single-parent households (534 men, 1,331 women).
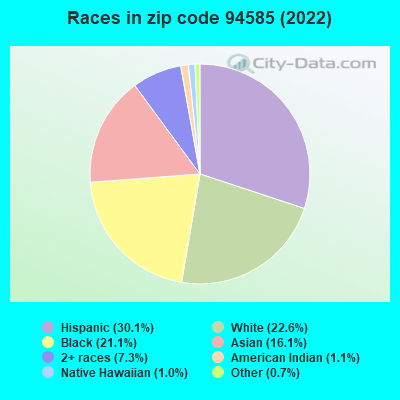
68.6% of residents of 94585 zip code speak English at home.
16.1% of residents speak Spanish at home (65% very well, 20% well, 11% not well, 4% not at all).
1.5% of residents speak other Indo-European language at home (58% very well, 42% well).
13.2% of residents speak Asian or Pacific Island language at home (63% very well, 30% well, 6% not well, 1% not at all).
0.2% of residents speak other language at home (64% very well, 36% well).
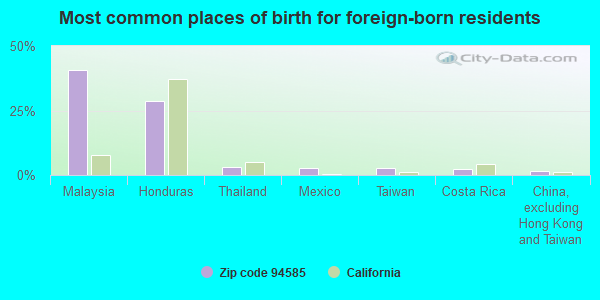
Foreign born population: 5,789 (19.9%) (68.2% of them are naturalized citizens)
This zip code:
19.9%
Whole state:
26.7%
41%Malaysia
29%Honduras
3%Thailand
3%Mexico
3%Taiwan
2%Costa Rica
2%China, excluding Hong Kong and Taiwan
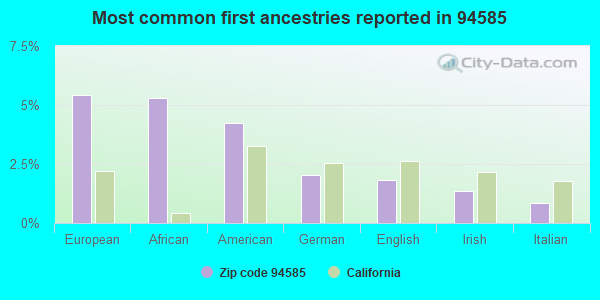
5%European
5%African
4%American
2%German
2%English
1%Irish
1%Italian
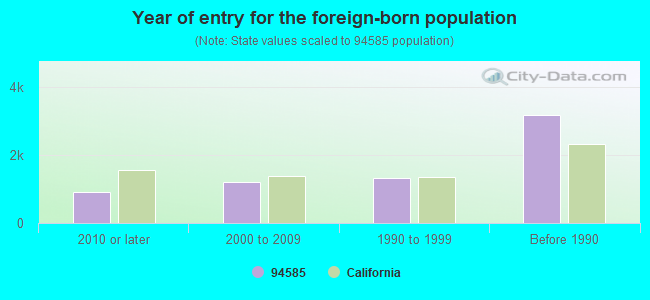
Year of entry for the foreign-born population
9182010 or later
1,1892000 to 2009
1,3161990 to 1999
3,169Before 1990
Major facilities with environmental interests located in this zip code:
A & W AUTO BODY INCORPORATED (50D MAIN STREET in SUISUN CITY, CA)
STATE MASTER (California - Hazardous Waste Tracking) - HAZARDOU WASTE PROGRAM CRITERIA AND HAZARDOUS AIR POLLUTANT INVENTORY (Inventory of air pollution sources) Small Quantity Generators, between 100 kg and 1000 kg of hazardous waste/month (Resource Conservation and Recovery Act (tracking hazardous waste)) - notification Business SIC classification: TOP, BODY, AND UPHOLSTERY REPAIR SHOPS AND PAINT SHOPS Organizations: SHANNON L HARRIS (CONTACT/OWNER)
Alternative names: A & W AUTOBODY
CHEVRON STATION NO 200473 (113 SUNSET CTR in SUISUN CITY, CA)
STATE MASTER (California - Hazardous Waste Tracking) - HAZARDOU WASTE PROGRAM Small Quantity Generators, between 100 kg and 1000 kg of hazardous waste/month (Resource Conservation and Recovery Act (tracking hazardous waste)) - notification Organizations: CHEVRON PRODUCTS CO (CONTACT/OWNER)
MIKE FLYNN PAINTING OLD AND NEW (2658 CORDELIA RD in SUISUN CITY, CA)
STATE MASTER (California - Hazardous Waste Tracking) - HAZARDOU WASTE PROGRAM Small Quantity Generators, between 100 kg and 1000 kg of hazardous waste/month (Resource Conservation and Recovery Act (tracking hazardous waste)) - notification
CAMPING WORLD (4350 CENTRAL PL in FAIRFIELD, CA)
STATE MASTER (California - Hazardous Waste Tracking) - HAZARDOU WASTE PROGRAM Small Quantity Generators, between 100 kg and 1000 kg of hazardous waste/month (Resource Conservation and Recovery Act (tracking hazardous waste)) - notification
ANGELO RODRIGUEZ HIGH (5000 RED TOP ROAD in FAIRFIELD, CA)
(National Center for Education Statistics) - STATE ID-4830170 Organizations: FAIRFIELD-SUISUN UNIFIED (SCHOOL DISTRICT)
GREEN VALLEY MIDDLE (3630 RITCHIE ROAD in SUISUN CITY, CA)
(National Center for Education Statistics) - STATE ID-6051189 Organizations: FAIRFIELD-SUISUN UNIFIED (SCHOOL DISTRICT)
MUNDY (NELDA) ELEMENTARY (570 VINTAGE VALLEY DR in FAIRFIELD, CA)
(National Center for Education Statistics) - STATE ID-6115752 Organizations: FAIRFIELD-SUISUN UNIFIED (SCHOOL DISTRICT)
CHEVRON 91342 (4490 S CENTRAL WAY in CORDELIA, CA)
Large Quantity Generators, more that 1000 kg of hazardous waste/month (Resource Conservation and Recovery Act (tracking hazardous waste)) Organizations: CHEVRON PRODUCTS CO. (CONTACT/OPERATOR)
CAL CHIEF CHEM (RT 1 BOX 157-A in SUISUN CITY, CA)
(Resource Conservation and Recovery Act (tracking hazardous waste)) Organizations: I W ROBBINS JR (CONTACT/OWNER)
LAMBIE ENERGY CENTER (5975 LAMBIE ROAD in SUISUN CITY, CA)
AIR MAJOR (AIRS/AFS) AIR PROGRAM (Clean Air Markets Division Business System) Business SIC classification: ELECTRIC SERVICES Organizations: GILROY ENERGY CENTER, LLC (OWNER/OPERATOR)
, LAMBIE ENERGY CENTER, LLC (OWNER/OPERATOR)
Alternative names: LAMBIE ENERGY CENTER LLC, PANDA WEST POWER II, PANDA WEST POWER II
CALIFORNIA NORTHERN RAILROAD (CFNR STATION OF SUISUN FAIRFLD in SUISUN CITY, CA)
(Resource Conservation and Recovery Act (tracking hazardous waste))
ALLWASTE SERVICES OF SF INC (3845 BITCHELL LN in SUISUN, CA)
TRANSPORTER (Resource Conservation and Recovery Act (tracking hazardous waste)) Organizations: LAMBIE INDUSTRIAL PARK (CONTACT/OWNER)
ESPARZA CONSTRUCTION (2529 MANKAS CORNER RD in SUISUN, CA)
TRANSPORTER (Resource Conservation and Recovery Act (tracking hazardous waste)) Organizations: ROBERT ESPARZA (CONTACT/OWNER)
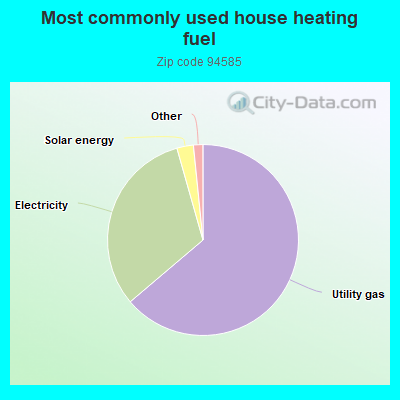
63.8%Utility gas
31.8%Electricity
2.8%Solar energy
0.7%Wood
0.7%Bottled, tank, or LP gas
Population in 1990: 31,081. Population change in the 1990s: +8,179 (+26.3%).
Place of birth for U.S.-born residents:
This state: 17,745
Northeast: 674
Midwest: 1,300
South: 1,884
West: 797
56% of the 94585 zip code residents lived in the same house 5 years ago. Out of people who lived in different houses, 50% lived in this county. Out of people who lived in different counties, 50% lived in California.
93% of the 94585 zip code residents lived in the same house 1 year ago. Out of people who lived in different houses, 37% moved from this county. Out of people who lived in different houses, 48% moved from different county within same state. Out of people who lived in different houses, 15% moved from different state. Out of people who lived in different houses, 3% moved from abroad.
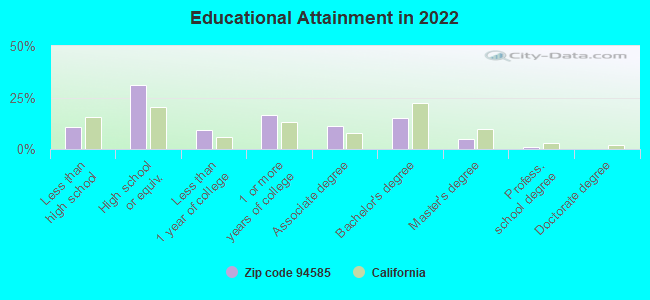
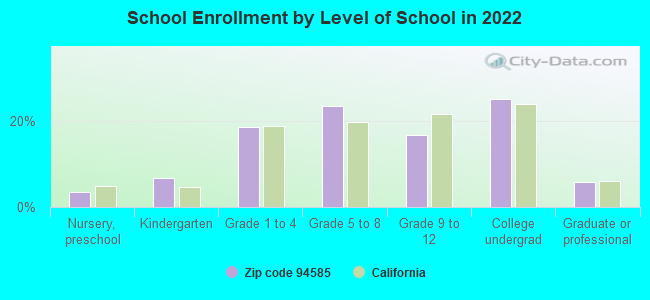
Private vs. public school enrollment:
Students in private schools in grades 1 to 8 (elementary and middle school): 185
Here:
5.8%
California:
10.5%
Students in private schools in grades 9 to 12 (high school): 41
Here:
3.3%
California:
8.5%
Students in private undergraduate colleges: 285
Here:
14.8%
California:
15.9%
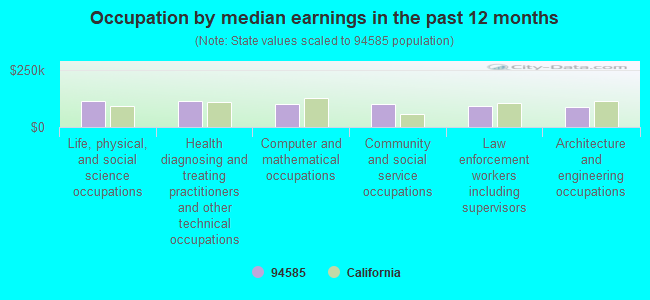
Occupation by median earnings in the past 12 months ($)
114,658Life, physical, and social science occupations
113,211Health diagnosing and treating practitioners and other technical occupations
101,007Computer and mathematical occupations
100,690Community and social service occupations
89,914Law enforcement workers including supervisors
86,450Architecture and engineering occupations
Companies with federal contracts located in this zip code (SUISUN CITY, CA):
RESOURCE MANAGEMENT ASSOCIATES (4171 SUISUN VALLEY RD STE; small business) : $5,732,079 in 247 contractsfrom 2000 to 2006
Contracts for Automated Information System Design and Integration Services, Natural Resource Studies, Other Special Studies and Analyses, Environmental Studies and Assessments, and moreby U.S. Army Corps of Engineers - civil program financing only, Bureau of Reclamation, Army Signed by year:2000: $982,398; 2001: $480,357; 2002: $443,024; 2003: $453,237; 2004: $945,782; 2005: $1,818,456; 2006: $608,825.
Biggest contracts:
$163,718 with U.S. Army Corps of Engineers - civil program financing only for Automated Information System Design and Integration Services. Signed on 2003-08-12. Completion date: 2003-11-28.
$99,800 with Bureau of Reclamation for Natural Resource Studies. Signed on 2006-02-06. Completion date: 2007-01-31.
$89,989 with U.S. Army Corps of Engineers - civil program financing only for Automated Information System Design and Integration Services. Signed on 2003-09-24. Completion date: 2003-09-30.
$89,932 with Bureau of Reclamation for Other Special Studies and Analyses. Signed on 2006-05-05. Completion date: 2007-04-30.
CORPORATE PLAZA, A CALIF LTD P (300 MAIN ST; small business) 12 employees, $610000 revenue. : $724,536 in 91 contractsfrom 2002 to 2006
Contracts for Lease or Rental of Facilities -- Office Buildings by Public Buildings Service Signed by year:2000: $0; 2001: $0; 2002: $71,988; 2003: $336,992; 2004: $36,462; 2005: $156,404; 2006: $122,690.
Biggest contracts:
$30,250 with Public Buildings Service for Lease or Rental of Facilities -- Office Buildings. Signed on 2003-06-15. Completion date: 2003-06-15.
$30,250, same as above.Signed on 2003-09-15. Completion date: 2003-09-15.
$30,100, same as above.Signed on 2003-09-15. Completion date: 2003-09-15.
$30,100, same as above.Signed on 2002-12-15. Completion date: 2002-12-15.
DESIGN CONSPIRACY (98 RAILROAD AVE STE D; small business) : $162,378 in 6 contractsfrom 2000 to 2005
Contracts for Office Furniture, Cabinets, Lockers, Bins, and Shelving, Miscellaneous Furniture and Fixtures by Air Force Signed by year:2000: $33,674; 2001: $54,985; 2002: $39,644; 2003: $0; 2004: $0; 2005: $34,075; 2006: $0.
Biggest contracts:
$54,985 with Air Force for Office Furniture. Signed on 2001-08-27. Completion date: 2001-09-28.
$39,644 with Air Force for Cabinets, Lockers, Bins, and Shelving. Signed on 2002-09-23. Completion date: 2002-10-18.
$33,674 with Air Force for Miscellaneous Furniture and Fixtures. Signed on 2000-09-29. Completion date: 2001-01-15.
$20,876 with Air Force for Office Furniture. Signed on 2005-08-30. Completion date: 2005-09-27.
TRI-CITY GLASS (515 MAIN STREET; small business) : $81,922 in 2 contractsfrom 2002 to 2003
$41,977 with Air Force for Hardware, Commercial. Signed on 2003-07-07. Completion date: 2003-09-02.
$39,945 with Air Force for Tile, Brick, and Block. Signed on 2002-09-29. Completion date: 2002-11-29.
LAURNA M V SUDAT (68 TERRY LANE; small business) : $70,000 in 2 contractsfrom 2001 to 2002
$40,000 with Air Force for Other Professional Services. Signed on 2002-08-23. Completion date: 2003-09-22.
$30,000 with Air Force for Other Social Services. Signed on 2001-08-07. Completion date: 2002-08-23.
ANY FENCE (623 DECOY LANE; small business) : $65,055 in 2 contractsin 2001
$56,500 with Air Force for Maintenance, Repair or Alteration of Real Property -- Family Housing Facilities. Signed on 2001-09-18. Completion date: 2001-12-30.
$8,555, same as above.Signed on 2001-08-29. Completion date: 2001-10-15.
ALL CARPETS & MORE INC (254 SUNSET AVE STE E; small business)
$40,095 with Air Force for Floor Coverings. Signed on 2005-09-16. Completion date: 2005-10-28.
WINTECH COMPUTER SYSTEMS (1772 ANDREWS CIRCLE; small business) : $23,690 in 2 contractsfrom 2004 to 2006
$13,570 with Air Force for Technical Representation Services -- Automatic Data Processing Equipment (Including Firmware), Software, Supplies and Support Equipment. Signed on 2004-10-04. Completion date: 2005-09-30.
$10,120 with Air Force for Other ADP and Telecommunications Services (includes data storage on tapes, compact disks, etc.). Signed on 2006-05-08. Completion date: 2006-09-30.
SHELDON GAS COMPANY (1 HARBOR CTR STE 310; small business) : $3,826 in 2 contractsfrom 2003 to 2005
$6,000 with Army for Liquid Propellant Fuels and Oxidizers, Chemical Base. Signed on 2003-12-01. Completion date: 2003-12-19.
-$2,174 with Air Force for Fuel Oils. Signed on 2005-03-15. Completion date: 2005-03-15.
ALLEN-SIMMONS HEATING & SHEET (1973 W CORDELIA RD; small business) : $2,363 in 2 contractsin 2000
$2,363 with Air Force for Maintenance, Repair or Alteration of Real Property -- Miscellaneous Buildings. Signed on 2000-05-11. Completion date: 1999-11-10.
$0, same as above.Signed on 2000-05-11. Completion date: 1999-11-10.
Top industries in this zip code by the number of employees in 2005:
2005 - 2018 National Fire Incident Reporting System (NFIRS) incidents
Based on the data from the years 2005 - 2018 the average number of fire incidents per year is 42. The highest number of fire incidents - 117 took place in 2007, and the least - 1 in 2010. The data has a rising trend.
When looking into fire subcategories, the most reports belonged to: Outside Fires (48.9%), and Other (23.9%).
Fire incident types reported to NFIRS in Zip Code 94585


 Nearest zip codes: 94535, 94512, 94533, 95687, 95625, 94565.


 Based on the data from the years 2005 - 2018 the average number of fire incidents per year is 42. The highest number of fire incidents - 117 took place in 2007, and the least - 1 in 2010. The data has a rising trend.
 When looking into fire subcategories, the most reports belonged to: Outside Fires (48.9%), and Other (23.9%).