Estimated zip code population in 2022: 12,798 Zip code population in 2010: 12,474 Zip code population in 2000: 13,048
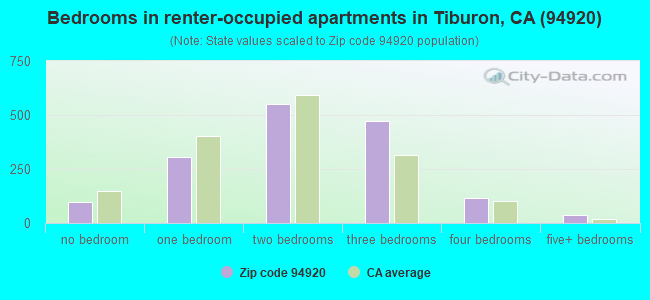
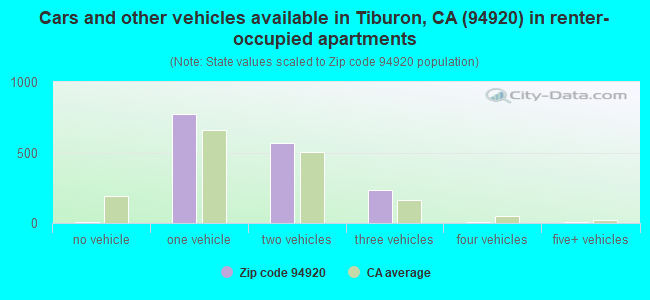
Houses and condos: 5,660 Renter-occupied apartments: 1,582
% of renters here:
30%
State:
44%
March 2022 cost of living index in zip code 94920: 133.6 (high, U.S. average is 100)
Land area: 6.5 sq. mi. Water area: 5.3 sq. mi.
Population density: 1,959 people per square mile
(low).
OSM Map
General Map
Google Map
MSN Map
OSM Map
General Map
Google Map
MSN Map
OSM Map
General Map
Google Map
MSN Map
OSM Map
General Map
Google Map
MSN Map
Please wait while loading the map...
Real estate property taxes paid for housing units in 2022:
This zip code:
0.5% ($10,292)
California:
0.7% ($4,831)
Median real estate property taxes paid for housing units with mortgages in 2022: $10,330 (0.5%) Median real estate property taxes paid for housing units with no mortgage in 2022: $10,572 (0.5%)
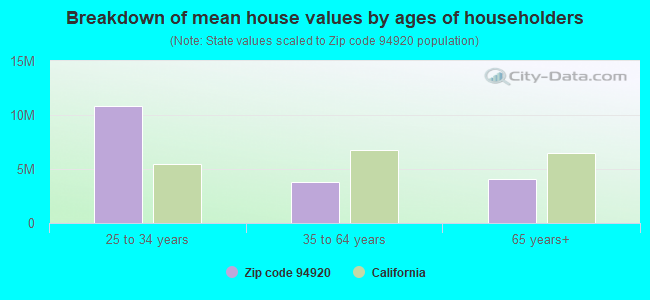
Estimated median house/condo value in 2022: $2,171,698
94920:
$2,171,698
California:
$715,900
According to our research of California and other state lists, there were 2 registered sex offenders living in 94920 zip code as of April 27, 2024. The ratio of all residents to sex offenders in zip code 94920 is 6,454 to 1. The ratio of registered sex offenders to all residents in this zip code is much lower than the state average.
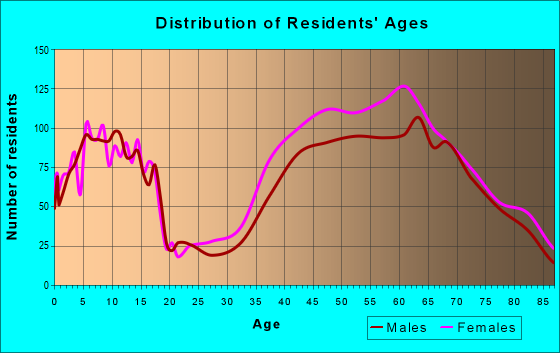
Median resident age:
This zip code:
50.7 years
California median age:
37.9 years
Average household size:
This zip code:
2.4 people
California:
2.8 people
Averages for the 2020 tax year for zip code 94920, filed in 2021:
Average Adjusted Gross Income (AGI) in 2020: $665,818 (Individual Income Tax Returns)
Here:
$665,818
State:
$95,910
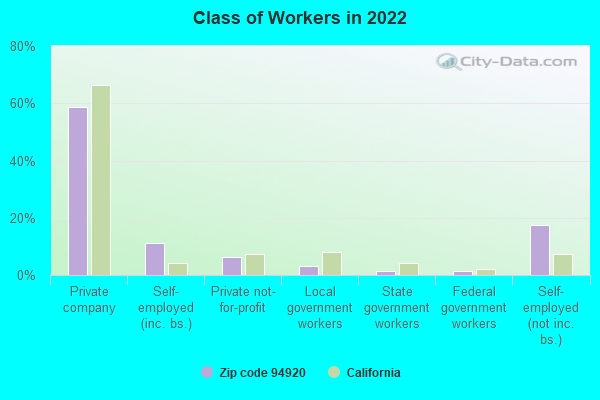
Salary/wage: $382,878 (reported on 62.6% of returns)
Here:
$382,878
State:
$77,331
(% of AGI for various income ranges: 1227.2% for AGIs below $25k, 3947.4% for AGIs $25k-50k, 6741.0% for AGIs $50k-75k, 9688.2% for AGIs $75k-100k, 20659.1% for AGIs $100k-200k, 318068.6% for AGIs over 200k)
Taxable interest for individuals: $17,146 (reported on 68.9% of returns)
This zip code:
$17,146
California:
$2,294
(% of AGI for various income ranges: 114.6% for AGIs below $25k, 256.8% for AGIs $25k-50k, 336.7% for AGIs $50k-75k, 671.2% for AGIs $75k-100k, 1036.3% for AGIs $100k-200k, 15497.6% for AGIs over 200k)
Ordinary dividends: $50,490 (reported on 66.0% of returns)
Here:
$50,490
State:
$10,949
(% of AGI for various income ranges: 455.9% for AGIs below $25k, 995.8% for AGIs $25k-50k, 1462.9% for AGIs $50k-75k, 2411.8% for AGIs $75k-100k, 3593.1% for AGIs $100k-200k, 42390.0% for AGIs over 200k)
Net capital gain/loss in AGI: +$389,146 (reported on 64.3% of returns)
Here:
+$389,146
State:
+$49,306
(% of AGI for various income ranges: 194.6% for AGIs below $25k, 665.3% for AGIs $25k-50k, 1000.0% for AGIs $50k-75k, 1736.5% for AGIs $75k-100k, 3175.4% for AGIs $100k-200k, 356092.6% for AGIs over 200k)
Profit/loss from business: +$110,256 (reported on 26.4% of returns)
Here:
+$110,256
State:
+$15,671
(% of AGI for various income ranges: 394.6% for AGIs below $25k, 1150.0% for AGIs $25k-50k, 1327.6% for AGIs $50k-75k, 1161.2% for AGIs $75k-100k, 3466.3% for AGIs $100k-200k, 37093.1% for AGIs over 200k)
Taxable individual retirement arrangement distribution: $53,879 (reported on 15.7% of returns)
94920:
$53,879
California:
$23,505
(% of AGI for various income ranges: 95.9% for AGIs below $25k, 388.9% for AGIs $25k-50k, 566.7% for AGIs $50k-75k, 1267.1% for AGIs $75k-100k, 3466.9% for AGIs $100k-200k, 8236.7% for AGIs over 200k)
Self-employed (Keogh) retirement plans: $50,742 (reported on 7.1% of returns)
94920:
$50,742
California:
$30,163
(% of AGI for various income ranges: 138.4% for AGIs $25k-50k, 566.6% for AGIs $100k-200k, 4660.2% for AGIs over 200k)
Total itemized deductions: $82,862 (reported on 43.3% of returns)
Here:
$82,862
State:
$39,517
(% of AGI for various income ranges: 781.0% for AGIs below $25k, 1502.1% for AGIs $25k-50k, 1880.0% for AGIs $50k-75k, 2814.1% for AGIs $75k-100k, 4606.9% for AGIs $100k-200k, 44367.1% for AGIs over 200k)
Charity contributions: $46,034 (reported on 38.2% of returns)
Here:
$46,034
State:
$12,598
(% of AGI for various income ranges: 35.4% for AGIs below $25k, 128.9% for AGIs $25k-50k, 160.0% for AGIs $50k-75k, 331.2% for AGIs $75k-100k, 724.9% for AGIs $100k-200k, 24409.5% for AGIs over 200k)
Taxes paid: $9,392 (reported on 43.1% of returns)
94920:
$9,392
State:
$8,807
(% of AGI for various income ranges: 143.3% for AGIs below $25k, 312.6% for AGIs $25k-50k, 400.5% for AGIs $50k-75k, 720.0% for AGIs $75k-100k, 1040.0% for AGIs $100k-200k, 4203.3% for AGIs over 200k)
Earned income credit: $1,519 (reported on 2.6% of returns)
Here:
$1,519
State:
$2,074
(% of AGI for various income ranges: 41.0% for AGIs below $25k, 43.7% for AGIs $25k-50k)
Percentage of individuals using paid preparers for their 2020 taxes: 92.4%
Here:
92%
State:
92%
(% for various income ranges: 91.1% for AGIs below $25k, 87.5% for AGIs $25k-50k, 87.8% for AGIs $50k-75k, 93.0% for AGIs $75k-100k, 92.5% for AGIs $100k-200k, 94.6% for AGIs over 200k)
Averages for the 2012 tax year for zip code 94920, filed in 2013:
Average Adjusted Gross Income (AGI) in 2012: $432,926 (Individual Income Tax Returns)
Here:
$432,926
State:
$72,726
Salary/wage: $256,837 (reported on 62.5% of returns)
Here:
$256,837
State:
$59,079
(% of AGI for various income ranges: 49.2% for AGIs below $25k, 52.6% for AGIs $25k-50k, 48.7% for AGIs $50k-75k, 43.9% for AGIs $75k-100k, 48.6% for AGIs $100k-200k, 35.8% for AGIs over 200k)
Taxable interest for individuals: $14,179 (reported on 67.0% of returns)
This zip code:
$14,179
California:
$2,146
(% of AGI for various income ranges: 4.3% for AGIs below $25k, 2.2% for AGIs $25k-50k, 2.3% for AGIs $50k-75k, 3.0% for AGIs $75k-100k, 2.9% for AGIs $100k-200k, 2.1% for AGIs over 200k)
Ordinary dividends: $42,122 (reported on 60.9% of returns)
Here:
$42,122
State:
$9,308
(% of AGI for various income ranges: 15.8% for AGIs below $25k, 9.5% for AGIs $25k-50k, 6.4% for AGIs $50k-75k, 8.3% for AGIs $75k-100k, 7.4% for AGIs $100k-200k, 5.7% for AGIs over 200k)
Net capital gain/loss in AGI: +$214,114 (reported on 59.7% of returns)
Here:
+$214,114
State:
+$30,460
(% of AGI for various income ranges: 1.3% for AGIs below $25k, 1.9% for AGIs $25k-50k, 4.2% for AGIs $50k-75k, 3.6% for AGIs $75k-100k, 4.4% for AGIs $100k-200k, 32.5% for AGIs over 200k)
Profit/loss from business: +$62,754 (reported on 27.9% of returns)
Here:
+$62,754
State:
+$17,064
(% of AGI for various income ranges: 18.9% for AGIs below $25k, 17.2% for AGIs $25k-50k, 12.1% for AGIs $50k-75k, 10.6% for AGIs $75k-100k, 9.2% for AGIs $100k-200k, 3.3% for AGIs over 200k)
Taxable individual retirement arrangement distribution: $60,201 (reported on 22.1% of returns)
94920:
$60,201
California:
$19,557
(% of AGI for various income ranges: 5.2% for AGIs below $25k, 4.7% for AGIs $25k-50k, 8.1% for AGIs $50k-75k, 9.4% for AGIs $75k-100k, 9.2% for AGIs $100k-200k, 2.5% for AGIs over 200k)
Self-employment retirement plans: $39,754 (reported on 6.8% of returns)
94920:
$39,754
California:
$24,530
(% of AGI for various income ranges: 1.8% for AGIs below $25k, 1.5% for AGIs $50k-75k, 1.1% for AGIs $100k-200k, 0.6% for AGIs over 200k)
Total itemized deductions: $108,153 (17% of AGI, reported on 67.5% of returns)
Here:
$108,153
State:
$34,004
Here:
17.4% of AGI
State:
22.7% of AGI
(% of AGI for various income ranges: 45.7% for AGIs below $25k, 27.8% for AGIs $25k-50k, 26.4% for AGIs $50k-75k, 26.8% for AGIs $75k-100k, 26.0% for AGIs $100k-200k, 15.7% for AGIs over 200k)
Charity contributions: $15,782 (reported on 59.6% of returns)
Here:
$15,782
State:
$4,659
(% of AGI for various income ranges: 1.5% for AGIs below $25k, 1.7% for AGIs $25k-50k, 2.1% for AGIs $50k-75k, 2.5% for AGIs $75k-100k, 2.3% for AGIs $100k-200k, 2.2% for AGIs over 200k)
Taxes paid: $65,717 (reported on 67.2% of returns)
94920:
$65,717
State:
$14,448
(% of AGI for various income ranges: 12.6% for AGIs below $25k, 8.1% for AGIs $25k-50k, 8.2% for AGIs $50k-75k, 10.2% for AGIs $75k-100k, 10.7% for AGIs $100k-200k, 10.2% for AGIs over 200k)
Earned income credit: $1,332 (reported on 3.1% of returns)
Here:
$1,332
State:
$2,286
(% of AGI for various income ranges: 1.6% for AGIs below $25k, 0.2% for AGIs $25k-50k)
Percentage of individuals using paid preparers for their 2012 taxes: 72.8%
Here:
73%
State:
64%
(% for various income ranges: 59.8% for AGIs below $25k, 64.1% for AGIs $25k-50k, 65.5% for AGIs $50k-75k, 68.9% for AGIs $75k-100k, 73.6% for AGIs $100k-200k, 85.9% for AGIs over 200k)
Averages for the 2004 tax year for zip code 94920, filed in 2005:
Average Adjusted Gross Income (AGI) in 2004: $279,443 (Individual Income Tax Returns)
Here:
$279,443
State:
$58,600
Salary/wage: $185,718 (reported on 60.4% of returns)
Here:
$185,718
State:
$49,455
(% of AGI for various income ranges: 49.4% for AGIs $10k-25k, 52.1% for AGIs $25k-50k, 53.7% for AGIs $50k-75k, 47.5% for AGIs $75k-100k, 37.9% for AGIs over 100k)
Taxable interest for individuals: $13,029 (reported on 73.9% of returns)
This zip code:
$13,029
California:
$2,365
(% of AGI for various income ranges: 9.5% for AGIs $10k-25k, 6.0% for AGIs $25k-50k, 4.0% for AGIs $50k-75k, 4.2% for AGIs $75k-100k, 3.1% for AGIs over 100k)
Taxable dividends: $22,632 (reported on 66.4% of returns)
Here:
$22,632
State:
$4,746
(% of AGI for various income ranges: 9.2% for AGIs $10k-25k, 8.4% for AGIs $25k-50k, 6.1% for AGIs $50k-75k, 7.4% for AGIs $75k-100k, 4.9% for AGIs over 100k)
Net capital gain/loss: +$123,682 (reported on 62.8% of returns)
Here:
+$123,682
State:
+$23,418
(% of AGI for various income ranges: 5.7% for AGIs $10k-25k, 3.8% for AGIs $25k-50k, 3.9% for AGIs $50k-75k, 4.6% for AGIs $75k-100k, 28.3% for AGIs over 100k)
Profit/loss from business: +$48,533 (reported on 28.7% of returns)
Here:
+$48,533
State:
+$16,826
(% of AGI for various income ranges: 16.3% for AGIs $10k-25k, 17.3% for AGIs $25k-50k, 9.3% for AGIs $50k-75k, 13.5% for AGIs $75k-100k, 4.2% for AGIs over 100k)
IRA payment deduction: $3,760 (reported on 3.6% of returns)
94920:
$3,760
California:
$3,192
(% of AGI for various income ranges: 0.6% for AGIs $10k-25k, 0.4% for AGIs $25k-50k, 0.3% for AGIs $50k-75k, 0.3% for AGIs $75k-100k, 0.0% for AGIs over 100k)
Self-employed pension: $28,592 (reported on 8.1% of returns)
Here:
$28,592
California:
$17,688
(% of AGI for various income ranges: 1.0% for AGIs $10k-25k, 1.1% for AGIs $25k-50k, 0.9% for AGIs $50k-75k, 1.8% for AGIs $75k-100k, 0.8% for AGIs over 100k)
Total itemized deductions: $82,187 (18% of AGI, reported on 61.8% of returns)
Here:
$82,187
State:
$28,113
Here:
18.4% of AGI
State:
25.3% of AGI
(% of AGI for various income ranges: 46.6% for AGIs $10k-25k, 30.1% for AGIs $25k-50k, 27.3% for AGIs $50k-75k, 30.1% for AGIs $75k-100k, 16.6% for AGIs over 100k)
Charity contributions deductions: $17,040 (4% of AGI, reported on 56.5% of returns)
Here:
$17,040
State:
$3,923
Here:
3.6% of AGI
State:
3.3% of AGI
(% of AGI for various income ranges: 3.0% for AGIs $10k-25k, 2.3% for AGIs $25k-50k, 2.4% for AGIs $50k-75k, 2.7% for AGIs $75k-100k, 3.4% for AGIs over 100k)
Total tax: $74,815 (reported on 83.9% of returns)
94920:
$74,815
State:
$10,761
(% of AGI for various income ranges: 6.8% for AGIs $10k-25k, 9.5% for AGIs $25k-50k, 11.4% for AGIs $50k-75k, 12.4% for AGIs $75k-100k, 22.5% for AGIs over 100k)
Earned income credit: $1,089 (reported on 2.9% of returns)
Here:
$1,089
State:
$1,763
Percentage of individuals using paid preparers for their 2004 taxes: 73.6%
Here:
74%
State:
66%
(% for various income ranges: 70.3% for AGIs below $10k, 67.1% for AGIs $10k-25k, 63.2% for AGIs $25k-50k, 68.8% for AGIs $50k-75k, 73.0% for AGIs $75k-100k, 81.3% for AGIs over 100k)
Likely homosexual households (counted as self-reported same-sex unmarried-partner households)
Lesbian couples: 0.0% of all households
Gay men: 0.4% of all households
Household received Food Stamps/SNAP in the past 12 months: 132 Household did not receive Food Stamps/SNAP in the past 12 months: 4,988
Women who had a birth in the past 12 months: 95 (94 now married, 0 unmarried) Women who did not have a birth in the past 12 months: 2,244 (1,169 now married, 1,063 unmarried)
Housing units in zip code 94920 with a mortgage: 2,205 (364 second mortgage, 326 both second mortgage and home equity loan) Houses without a mortgage: 23
Median monthly owner costs for units with a mortgage: $3,876 Median monthly owner costs for units without a mortgage: $1,556
Residents with income below the poverty level in 2022:
This zip code:
2.2%
Whole state:
12.2%
Residents with income below 50% of the poverty level in 2022:
This zip code:
0.6%
Whole state:
6.2%
Median number of rooms in houses and condos:
Here:
7.8
State:
6.0
Median number of rooms in apartments:
Here:
4.6
State:
3.9
Notable locations in this zip code not listed on our city pages
Notable locations in zip code 94920: Corinthian Yacht Club (A), San Francisco Yacht Club (B), Angel Island Ferry Terminal (C), Alcatraz Gardens (D), Tiburon Peninsula Club (E), Tiburon Oceanographic Center (F), Lyford Tower (G), China Cabin (H), Belvedere-Tiburon Branch Marin County Free Library (I), Belvedere City Hall (J), Angel Island State Park Visitor Center (K), Tiburon City Hall (L), Lyford House (M), Tiburon Fire Protection District Station 10 (N), Tiburon Fire Protection District Station 11 Headquarters (O). Display/hide their locations on the map
Shopping Centers: Main Street Shopping Center (1), Ark Row Shopping Center (2), Cove Shopping Center (3), Boardwalk Shopping Center (4). Display/hide their locations on the map
Churches in zip code 94920 include: Saint Stephens Episcopal Church (A), Community Congregational Church (B), Old Saint Hilarys Church (C), Shepherd of the Hills Lutheran Church (D), Tiburon Baptist Church (E). Display/hide their locations on the map
Parks in zip code 94920 include: Angel Island State Park (1), McKegney Field (2), Old Saint Hilarys Historic Preserve (3), Paradise Beach County Park (4), Richardson Bay Audubon Center and Wildlife Sanctuary (5), Richardson Bay Park (6), Tiburon Uplands Nature Preserve (7), Belvedere Park (8). Display/hide their locations on the map
1,977 married couples with children.
325 single-parent households (141 men, 184 women).
79.2% of residents of 94920 zip code speak English at home.
3.0% of residents speak Spanish at home (88% very well, 12% well).
11.8% of residents speak other Indo-European language at home (75% very well, 13% well, 11% not well, 1% not at all).
5.5% of residents speak Asian or Pacific Island language at home (65% very well, 14% well, 16% not well, 5% not at all).
1.2% of residents speak other language at home (83% very well, 17% well).
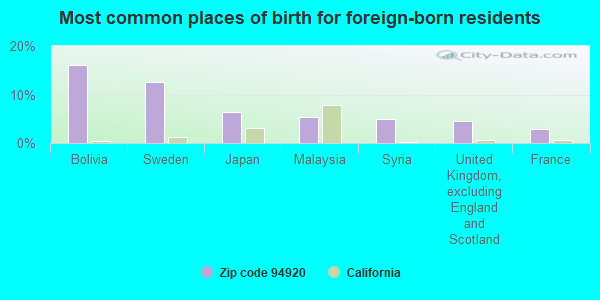
Foreign born population: 2,980 (23.3%) (56.2% of them are naturalized citizens)
This zip code:
23.3%
Whole state:
26.7%
16%Bolivia
13%Sweden
6%Japan
5%Malaysia
5%Syria
5%United Kingdom, excluding England and Scotland
3%France
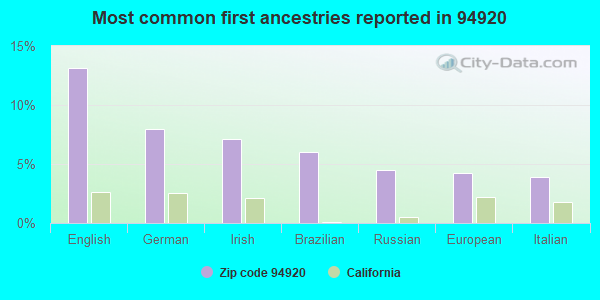
13%English
8%German
7%Irish
6%Brazilian
4%Russian
4%European
4%Italian
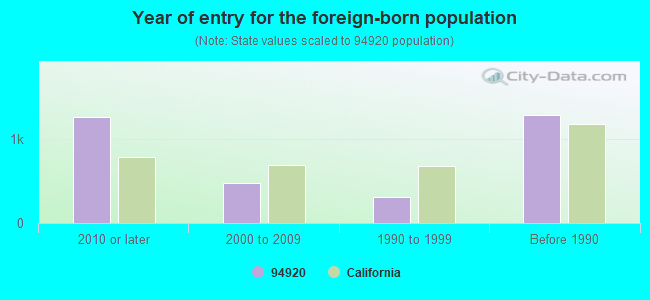
Year of entry for the foreign-born population
1,2632010 or later
4782000 to 2009
3041990 to 1999
1,284Before 1990
Facilities with environmental interests located in this zip code:
NATIONAL MARINE FISHERIES SERVICE TIBURON LAB (3150 PARADISE DRIVE in TIBURON, CA) . Federal Facility. FISH AND WILDLIFE SERVICE
STATE MASTER (California - Hazardous Waste Tracking) - HAZARDOU WASTE PROGRAM Small Quantity Generators, between 100 kg and 1000 kg of hazardous waste/month (Resource Conservation and Recovery Act (tracking hazardous waste)) - notification Small Quantity Generators, between 100 kg and 1000 kg of hazardous waste/month (Resource Conservation and Recovery Act (tracking hazardous waste)) Organizations: US DEPT OF COMMERCE N M F S (CONTACT/OWNER)
Alternative names: N M F S S W F S C TIBURON LABORATORY, SAN FRANCISCO STATE UNIVERSITY, USDOI FW NATIONAL MARINE FISHERIES SERV
MARIN CLEANERS INC (1 BLACKFIELD DR in TIBURON, CA)
CRITERIA AND HAZARDOUS AIR POLLUTANT INVENTORY (Inventory of air pollution sources) (Resource Conservation and Recovery Act (tracking hazardous waste)) Business SIC classification: DRYCLEANING PLANTS, EXCEPT RUG CLEANING Organizations: CASASSA ROBERT OWNER (CONTACT/OWNER)
MARIN COUNTY SANITATION DISTRICT 5 (2001 PARADISE DRIVE in TIBURON, CA)
CRITERIA AND HAZARDOUS AIR POLLUTANT INVENTORY (Inventory of air pollution sources) National Pollutant Discharge Elimination System MAJOR (Tracking pollutant discharge elimination systems) - permit Business SIC classification: SEWERAGE SYSTEMS Organizations: MARIN COUNTY SD #5 (CONTACT/OWNER)
Alternative names: MARIN COUNTY SAN DIST #5, MARIN COUNTY SANITARY DISTR NO, MARIN COUNTY SANITATION DISTRICT #5, MARIN COUNTY SD #5
CHILDRENS CIRCLE CENTER (215 A BLACKFIELD DRIVE in TIBURON, CA)
COMPLIANCE ACTIVITY (Tracking inspections of insecticide, fungicide, and rodenticide, and toxic substances)
ANGEL ISLAND (ANGEL ISLAND in TIBURON, CA)
CRITERIA AND HAZARDOUS AIR POLLUTANT INVENTORY (Inventory of air pollution sources) Business SIC classification: REFUSE SYSTEMS Business NAICS classification: SOLID WASTE LANDFILL.
Housing units lacking complete plumbing facilities: 0.2% Housing units lacking complete kitchen facilities: 0.9%
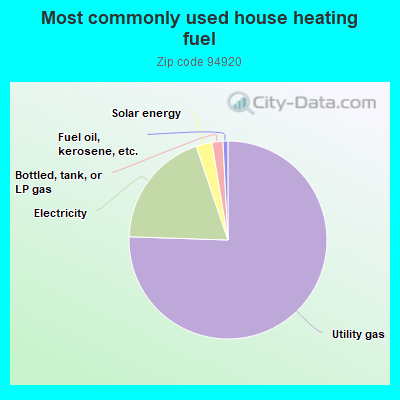
75.6%Utility gas
19.3%Electricity
2.6%Solar energy
1.8%Bottled, tank, or LP gas
0.8%Fuel oil, kerosene, etc.
Population in 1990: 10,993. Population change in the 1990s: +2,055 (+18.7%).
Place of birth for U.S.-born residents:
This state: 5,313
Northeast: 1,826
Midwest: 1,317
South: 594
West: 430
59% of the 94920 zip code residents lived in the same house 5 years ago. Out of people who lived in different houses, 46% lived in this county. Out of people who lived in different counties, 50% lived in California.
87% of the 94920 zip code residents lived in the same house 1 year ago. Out of people who lived in different houses, 38% moved from this county. Out of people who lived in different houses, 26% moved from different county within same state. Out of people who lived in different houses, 14% moved from different state. Out of people who lived in different houses, 25% moved from abroad.
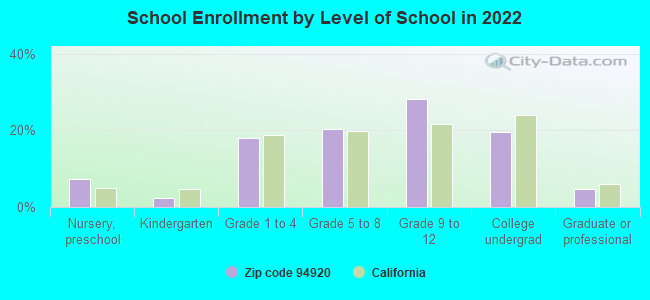
Private vs. public school enrollment:
Students in private schools in grades 1 to 8 (elementary and middle school): 298
Here:
26.8%
California:
10.5%
Students in private schools in grades 9 to 12 (high school): 290
Here:
35.8%
California:
8.5%
Students in private undergraduate colleges: 254
Here:
44.3%
California:
15.9%
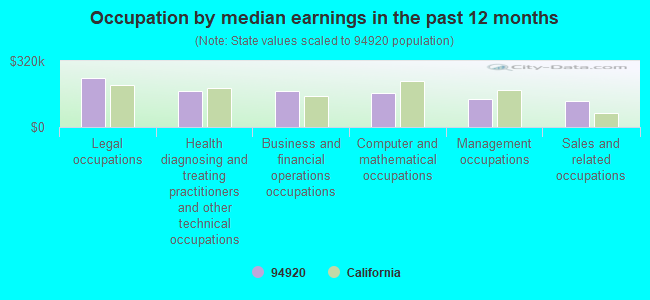
Occupation by median earnings in the past 12 months ($)
237,352Legal occupations
172,716Health diagnosing and treating practitioners and other technical occupations
172,227Business and financial operations occupations
167,099Computer and mathematical occupations
136,651Management occupations
126,763Sales and related occupations
Top industries in this zip code by the number of employees in 2005:
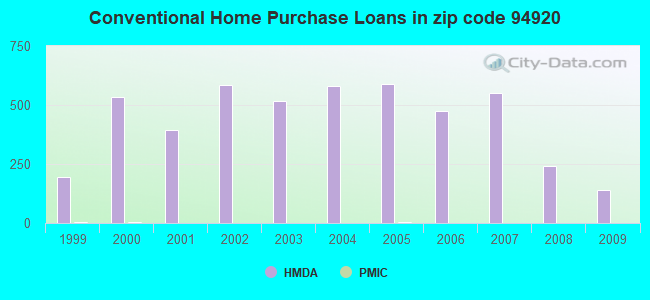
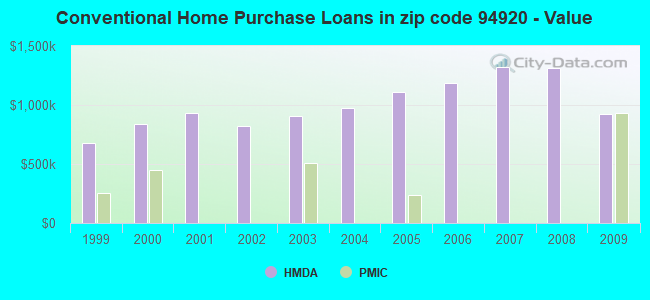
Detailed PMIC statistics for the following Tracts:1241.00
, 1242.00
2002 - 2018 National Fire Incident Reporting System (NFIRS) incidents
Based on the data from the years 2002 - 2018 the average number of fire incidents per year is 24. The highest number of fire incidents - 46 took place in 2013, and the least - 0 in 2003. The data has a declining trend.
When looking into fire subcategories, the most reports belonged to: Structure Fires (54.6%), and Outside Fires (33.5%).
Fire incident types reported to NFIRS in Zip Code 94920


 Nearest zip codes: 94925, 94964, 94939, 94965, 94129, 94123.


 . Federal Facility. FISH AND WILDLIFE SERVICE
 Based on the data from the years 2002 - 2018 the average number of fire incidents per year is 24. The highest number of fire incidents - 46 took place in 2013, and the least - 0 in 2003. The data has a declining trend.
 When looking into fire subcategories, the most reports belonged to: Structure Fires (54.6%), and Outside Fires (33.5%).