Estimated zip code population in 2022: 37,883 Zip code population in 2010: 37,365 Zip code population in 2000: 35,400
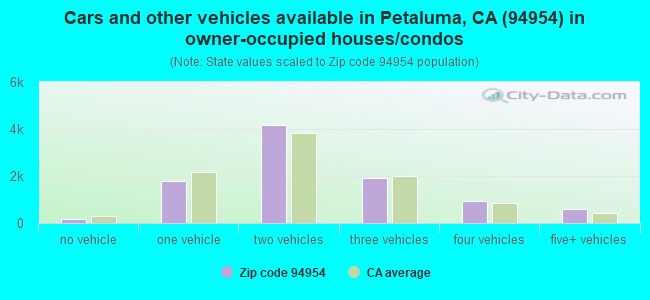
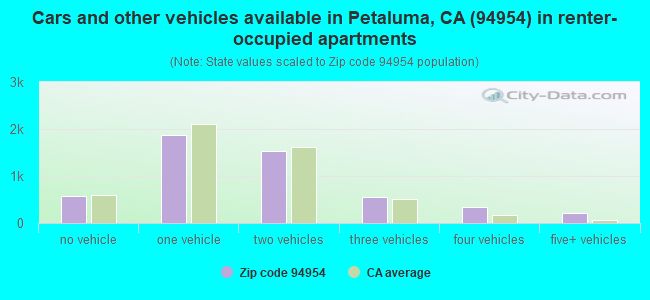
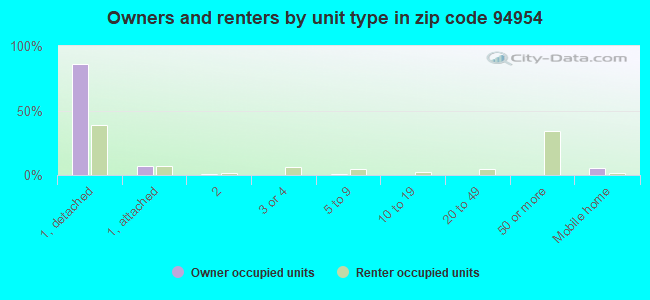
Houses and condos: 14,838 Renter-occupied apartments: 5,086
% of renters here:
35%
State:
44%
March 2022 cost of living index in zip code 94954: 115.9 (more than average, U.S. average is 100)
Land area: 62.0 sq. mi. Water area: 2.3 sq. mi.
Population density: 611 people per square mile
(low).
OSM Map
General Map
Google Map
MSN Map
OSM Map
General Map
Google Map
MSN Map
OSM Map
General Map
Google Map
MSN Map
OSM Map
General Map
Google Map
MSN Map
Please wait while loading the map...
Real estate property taxes paid for housing units in 2022:
This zip code:
0.7% ($5,354)
California:
0.7% ($4,831)
Median real estate property taxes paid for housing units with mortgages in 2022: $5,903 (0.7%) Median real estate property taxes paid for housing units with no mortgage in 2022: $4,231 (0.6%)
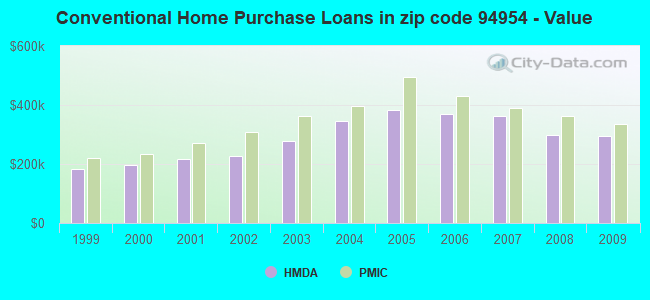
Estimated median house/condo value in 2022: $814,386
94954:
$814,386
California:
$715,900
According to our research of California and other state lists, there were 24 registered sex offenders living in 94954 zip code as of April 27, 2024. The ratio of all residents to sex offenders in zip code 94954 is 1,604 to 1. The ratio of registered sex offenders to all residents in this zip code is lower than the state average.
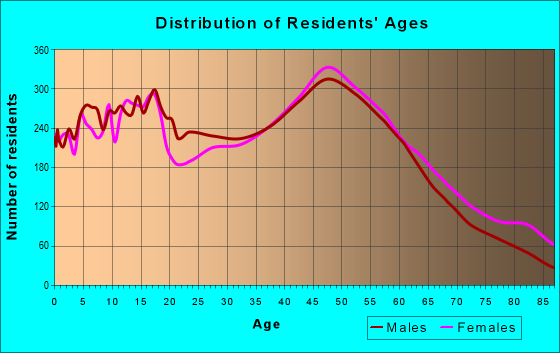
Median resident age:
This zip code:
44.3 years
California median age:
37.9 years
Average household size:
This zip code:
2.6 people
California:
2.8 people
Averages for the 2020 tax year for zip code 94954, filed in 2021:
Average Adjusted Gross Income (AGI) in 2020: $91,862 (Individual Income Tax Returns)
Here:
$91,862
State:
$95,910
Salary/wage: $81,116 (reported on 78.3% of returns)
Here:
$81,116
State:
$77,331
(% of AGI for various income ranges: 1284.7% for AGIs below $25k, 4153.9% for AGIs $25k-50k, 7244.7% for AGIs $50k-75k, 10801.0% for AGIs $75k-100k, 20438.5% for AGIs $100k-200k, 74860.7% for AGIs over 200k)
Taxable interest for individuals: $1,564 (reported on 45.7% of returns)
This zip code:
$1,564
California:
$2,294
(% of AGI for various income ranges: 41.7% for AGIs below $25k, 42.0% for AGIs $25k-50k, 77.6% for AGIs $50k-75k, 108.9% for AGIs $75k-100k, 154.7% for AGIs $100k-200k, 1068.0% for AGIs over 200k)
Ordinary dividends: $5,645 (reported on 27.0% of returns)
Here:
$5,645
State:
$10,949
(% of AGI for various income ranges: 78.3% for AGIs below $25k, 77.2% for AGIs $25k-50k, 131.4% for AGIs $50k-75k, 243.6% for AGIs $75k-100k, 365.1% for AGIs $100k-200k, 2333.5% for AGIs over 200k)
Net capital gain/loss in AGI: +$16,165 (reported on 25.0% of returns)
Here:
+$16,165
State:
+$49,306
(% of AGI for various income ranges: 34.6% for AGIs below $25k, 58.8% for AGIs $25k-50k, 137.4% for AGIs $50k-75k, 279.4% for AGIs $75k-100k, 563.0% for AGIs $100k-200k, 10586.9% for AGIs over 200k)
Profit/loss from business: +$19,962 (reported on 18.1% of returns)
Here:
+$19,962
State:
+$15,671
(% of AGI for various income ranges: 180.8% for AGIs below $25k, 381.1% for AGIs $25k-50k, 483.4% for AGIs $50k-75k, 605.1% for AGIs $75k-100k, 955.7% for AGIs $100k-200k, 3768.4% for AGIs over 200k)
Taxable individual retirement arrangement distribution: $20,242 (reported on 10.6% of returns)
94954:
$20,242
California:
$23,505
(% of AGI for various income ranges: 84.2% for AGIs below $25k, 139.6% for AGIs $25k-50k, 307.8% for AGIs $50k-75k, 471.6% for AGIs $75k-100k, 788.1% for AGIs $100k-200k, 1522.0% for AGIs over 200k)
Self-employed (Keogh) retirement plans: $17,121 (reported on 1.2% of returns)
94954:
$17,121
California:
$30,163
(% of AGI for various income ranges: 12.9% for AGIs $25k-50k, 22.5% for AGIs $75k-100k, 68.4% for AGIs $100k-200k, 378.7% for AGIs over 200k)
Total itemized deductions: $32,567 (reported on 19.2% of returns)
Here:
$32,567
State:
$39,517
(% of AGI for various income ranges: 179.7% for AGIs below $25k, 232.1% for AGIs $25k-50k, 632.2% for AGIs $50k-75k, 1239.7% for AGIs $75k-100k, 2115.7% for AGIs $100k-200k, 7374.7% for AGIs over 200k)
Charity contributions: $5,631 (reported on 14.7% of returns)
Here:
$5,631
State:
$12,598
(% of AGI for various income ranges: 5.8% for AGIs below $25k, 13.3% for AGIs $25k-50k, 40.8% for AGIs $50k-75k, 94.2% for AGIs $75k-100k, 192.2% for AGIs $100k-200k, 1742.9% for AGIs over 200k)
Taxes paid: $8,804 (reported on 19.2% of returns)
94954:
$8,804
State:
$8,807
(% of AGI for various income ranges: 37.3% for AGIs below $25k, 54.7% for AGIs $25k-50k, 161.9% for AGIs $50k-75k, 369.8% for AGIs $75k-100k, 654.6% for AGIs $100k-200k, 1713.3% for AGIs over 200k)
Earned income credit: $1,614 (reported on 6.6% of returns)
Here:
$1,614
State:
$2,074
(% of AGI for various income ranges: 47.1% for AGIs below $25k, 36.3% for AGIs $25k-50k, 0.5% for AGIs $50k-75k)
Percentage of individuals using paid preparers for their 2020 taxes: 92.8%
Here:
93%
State:
92%
(% for various income ranges: 90.2% for AGIs below $25k, 92.4% for AGIs $25k-50k, 93.8% for AGIs $50k-75k, 94.2% for AGIs $75k-100k, 93.7% for AGIs $100k-200k, 95.0% for AGIs over 200k)
Averages for the 2012 tax year for zip code 94954, filed in 2013:
Average Adjusted Gross Income (AGI) in 2012: $67,809 (Individual Income Tax Returns)
Here:
$67,809
State:
$72,726
Salary/wage: $61,855 (reported on 80.3% of returns)
Here:
$61,855
State:
$59,079
(% of AGI for various income ranges: 68.2% for AGIs below $25k, 73.2% for AGIs $25k-50k, 70.6% for AGIs $50k-75k, 73.3% for AGIs $75k-100k, 78.3% for AGIs $100k-200k, 67.5% for AGIs over 200k)
Taxable interest for individuals: $1,183 (reported on 43.9% of returns)
This zip code:
$1,183
California:
$2,146
(% of AGI for various income ranges: 1.5% for AGIs below $25k, 0.9% for AGIs $25k-50k, 1.0% for AGIs $50k-75k, 0.6% for AGIs $75k-100k, 0.5% for AGIs $100k-200k, 1.0% for AGIs over 200k)
Ordinary dividends: $3,993 (reported on 24.8% of returns)
Here:
$3,993
State:
$9,308
(% of AGI for various income ranges: 2.5% for AGIs below $25k, 1.4% for AGIs $25k-50k, 1.5% for AGIs $50k-75k, 1.2% for AGIs $75k-100k, 1.0% for AGIs $100k-200k, 2.1% for AGIs over 200k)
Net capital gain/loss in AGI: +$5,026 (reported on 20.0% of returns)
Here:
+$5,026
State:
+$30,460
(% of AGI for various income ranges: 0.3% for AGIs $25k-50k, 0.5% for AGIs $50k-75k, 0.7% for AGIs $75k-100k, 1.0% for AGIs $100k-200k, 4.7% for AGIs over 200k)
Profit/loss from business: +$19,424 (reported on 18.3% of returns)
Here:
+$19,424
State:
+$17,064
(% of AGI for various income ranges: 13.3% for AGIs below $25k, 7.1% for AGIs $25k-50k, 6.5% for AGIs $50k-75k, 4.4% for AGIs $75k-100k, 3.8% for AGIs $100k-200k, 4.2% for AGIs over 200k)
Taxable individual retirement arrangement distribution: $16,611 (reported on 11.0% of returns)
94954:
$16,611
California:
$19,557
(% of AGI for various income ranges: 3.4% for AGIs below $25k, 2.8% for AGIs $25k-50k, 2.9% for AGIs $50k-75k, 3.4% for AGIs $75k-100k, 2.5% for AGIs $100k-200k, 2.2% for AGIs over 200k)
Self-employment retirement plans: $15,972 (reported on 1.0% of returns)
94954:
$15,972
California:
$24,530
(% of AGI for various income ranges: 0.2% for AGIs below $25k, 0.1% for AGIs $50k-75k, 0.2% for AGIs $75k-100k, 0.2% for AGIs $100k-200k, 0.5% for AGIs over 200k)
Total itemized deductions: $27,066 (24% of AGI, reported on 43.6% of returns)
Here:
$27,066
State:
$34,004
Here:
24.4% of AGI
State:
22.7% of AGI
(% of AGI for various income ranges: 16.0% for AGIs below $25k, 13.9% for AGIs $25k-50k, 17.0% for AGIs $50k-75k, 18.1% for AGIs $75k-100k, 19.0% for AGIs $100k-200k, 16.6% for AGIs over 200k)
Charity contributions: $2,404 (reported on 35.5% of returns)
Here:
$2,404
State:
$4,659
(% of AGI for various income ranges: 0.7% for AGIs below $25k, 1.0% for AGIs $25k-50k, 1.1% for AGIs $50k-75k, 1.3% for AGIs $75k-100k, 1.4% for AGIs $100k-200k, 1.4% for AGIs over 200k)
Taxes paid: $10,031 (reported on 43.5% of returns)
94954:
$10,031
State:
$14,448
(% of AGI for various income ranges: 2.8% for AGIs below $25k, 3.0% for AGIs $25k-50k, 4.6% for AGIs $50k-75k, 5.9% for AGIs $75k-100k, 7.4% for AGIs $100k-200k, 9.3% for AGIs over 200k)
Earned income credit: $1,758 (reported on 8.9% of returns)
Here:
$1,758
State:
$2,286
(% of AGI for various income ranges: 2.8% for AGIs below $25k, 0.6% for AGIs $25k-50k)
Percentage of individuals using paid preparers for their 2012 taxes: 56.3%
Here:
56%
State:
64%
(% for various income ranges: 48.7% for AGIs below $25k, 56.5% for AGIs $25k-50k, 59.7% for AGIs $50k-75k, 60.8% for AGIs $75k-100k, 61.5% for AGIs $100k-200k, 67.6% for AGIs over 200k)
Averages for the 2004 tax year for zip code 94954, filed in 2005:
Average Adjusted Gross Income (AGI) in 2004: $57,488 (Individual Income Tax Returns)
Here:
$57,488
State:
$58,600
Salary/wage: $53,650 (reported on 82.2% of returns)
Here:
$53,650
State:
$49,455
(% of AGI for various income ranges: 180.9% for AGIs below $10k, 68.8% for AGIs $10k-25k, 76.0% for AGIs $25k-50k, 76.7% for AGIs $50k-75k, 82.3% for AGIs $75k-100k, 74.3% for AGIs over 100k)
Taxable interest for individuals: $1,478 (reported on 55.5% of returns)
This zip code:
$1,478
California:
$2,365
(% of AGI for various income ranges: 20.0% for AGIs below $10k, 3.4% for AGIs $10k-25k, 1.7% for AGIs $25k-50k, 1.4% for AGIs $50k-75k, 1.0% for AGIs $75k-100k, 1.0% for AGIs over 100k)
Taxable dividends: $2,407 (reported on 30.9% of returns)
Here:
$2,407
State:
$4,746
(% of AGI for various income ranges: 10.1% for AGIs below $10k, 2.3% for AGIs $10k-25k, 1.4% for AGIs $25k-50k, 1.3% for AGIs $50k-75k, 0.9% for AGIs $75k-100k, 1.2% for AGIs over 100k)
Net capital gain/loss: +$8,547 (reported on 25.0% of returns)
Here:
+$8,547
State:
+$23,418
(% of AGI for various income ranges: 2.5% for AGIs below $10k, 0.1% for AGIs $10k-25k, 0.5% for AGIs $25k-50k, 0.8% for AGIs $50k-75k, 1.5% for AGIs $75k-100k, 7.2% for AGIs over 100k)
Profit/loss from business: +$18,167 (reported on 17.2% of returns)
Here:
+$18,167
State:
+$16,826
(% of AGI for various income ranges: -1.7% for AGIs below $10k, 9.4% for AGIs $10k-25k, 6.7% for AGIs $25k-50k, 6.0% for AGIs $50k-75k, 4.9% for AGIs $75k-100k, 4.7% for AGIs over 100k)
IRA payment deduction: $3,201 (reported on 3.2% of returns)
94954:
$3,201
California:
$3,192
(% of AGI for various income ranges: 0.8% for AGIs below $10k, 0.2% for AGIs $10k-25k, 0.3% for AGIs $25k-50k, 0.3% for AGIs $50k-75k, 0.2% for AGIs $75k-100k, 0.1% for AGIs over 100k)
Self-employed pension: $11,244 (reported on 1.8% of returns)
Here:
$11,244
California:
$17,688
(% of AGI for various income ranges: 0.1% for AGIs $10k-25k, 0.1% for AGIs $25k-50k, 0.3% for AGIs $50k-75k, 0.3% for AGIs $75k-100k, 0.5% for AGIs over 100k)
Total itemized deductions: $25,091 (28% of AGI, reported on 48.0% of returns)
Here:
$25,091
State:
$28,113
Here:
27.5% of AGI
State:
25.3% of AGI
(% of AGI for various income ranges: 48.5% for AGIs below $10k, 20.9% for AGIs $10k-25k, 18.6% for AGIs $25k-50k, 22.2% for AGIs $50k-75k, 23.1% for AGIs $75k-100k, 20.0% for AGIs over 100k)
Charity contributions deductions: $2,393 (3% of AGI, reported on 42.4% of returns)
Here:
$2,393
State:
$3,923
Here:
2.5% of AGI
State:
3.3% of AGI
(% of AGI for various income ranges: 1.7% for AGIs below $10k, 1.1% for AGIs $10k-25k, 1.1% for AGIs $25k-50k, 1.5% for AGIs $50k-75k, 1.7% for AGIs $75k-100k, 2.1% for AGIs over 100k)
Total tax: $8,267 (reported on 81.6% of returns)
94954:
$8,267
State:
$10,761
(% of AGI for various income ranges: 7.6% for AGIs below $10k, 5.0% for AGIs $10k-25k, 7.4% for AGIs $25k-50k, 9.0% for AGIs $50k-75k, 9.6% for AGIs $75k-100k, 15.9% for AGIs over 100k)
Earned income credit: $1,365 (reported on 7.0% of returns)
Here:
$1,365
State:
$1,763
Percentage of individuals using paid preparers for their 2004 taxes: 59.7%
Here:
60%
State:
66%
(% for various income ranges: 47.8% for AGIs below $10k, 58.1% for AGIs $10k-25k, 61.9% for AGIs $25k-50k, 63.5% for AGIs $50k-75k, 62.6% for AGIs $75k-100k, 64.5% for AGIs over 100k)
Likely homosexual households (counted as self-reported same-sex unmarried-partner households)
Lesbian couples: 0.0% of all households
Gay men: 0.2% of all households
Household received Food Stamps/SNAP in the past 12 months: 1,085 Household did not receive Food Stamps/SNAP in the past 12 months: 13,404
Women who had a birth in the past 12 months: 344 (294 now married, 48 unmarried) Women who did not have a birth in the past 12 months: 7,907 (3,676 now married, 4,208 unmarried)
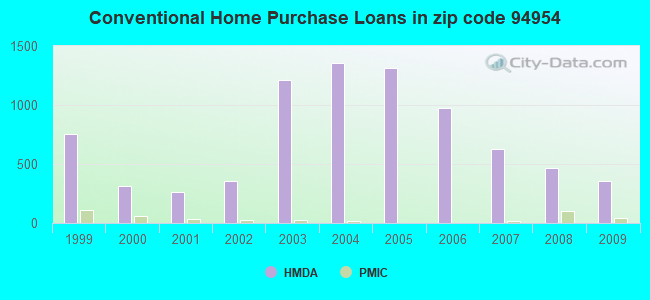
Housing units in zip code 94954 with a mortgage: 6,381 (920 second mortgage, 26 home equity loan, 790 both second mortgage and home equity loan) Houses without a mortgage: 90
Median monthly owner costs for units with a mortgage: $2,815 Median monthly owner costs for units without a mortgage: $828
Residents with income below the poverty level in 2022:
This zip code:
5.7%
Whole state:
12.2%
Residents with income below 50% of the poverty level in 2022:
This zip code:
3.0%
Whole state:
6.2%
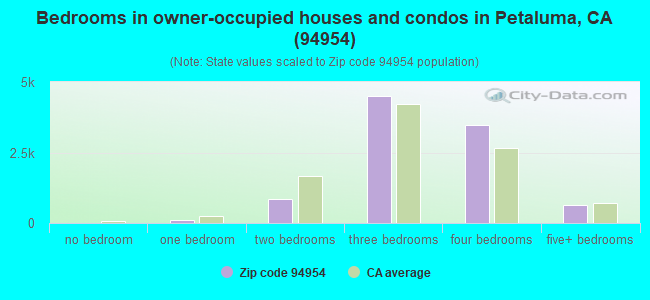
Median number of rooms in houses and condos:
Here:
6.2
State:
6.0
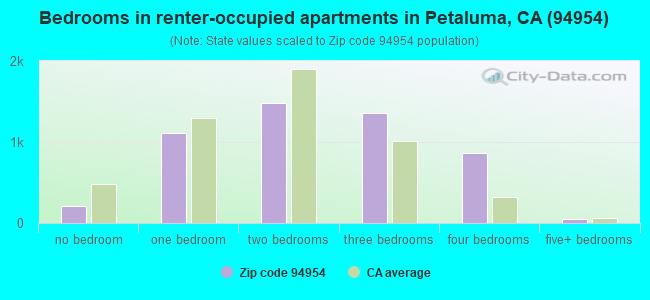
Median number of rooms in apartments:
Here:
4.4
State:
3.9
Notable locations in this zip code not listed on our city pages
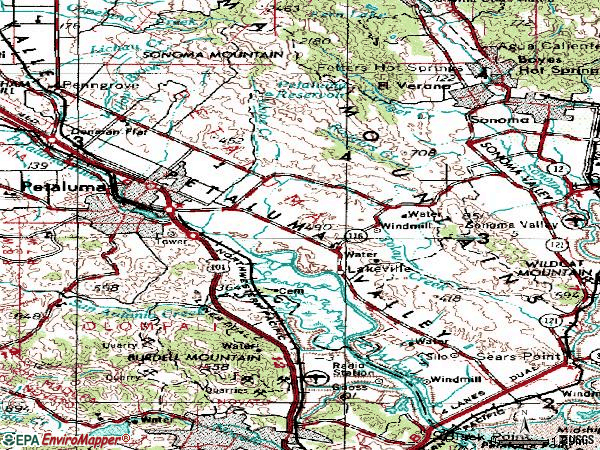
Notable locations in zip code 94954: Bettinelli Dairy (A), Adobe Pumpkin Farm (B), Port Sonoma Yacht Club (C), Port Sonoma Marina (D), Oakmead North-Bay Business Park (E), Marina Business Park (F), Lakeville Business Park (G), Cader Business Park (H), Adobe Creek Golf and Country Club (I), South Point Business Park (J), Redwood Business Park (K), Petaluma Industrial Park (L), North San Francisco Bay-McDowell Industrial Park (M), Petaluma Community Center (N), Petaluma Fire Department Station 2 (O), Lakeville Volunteer Fire Department (P), Petaluma Fire Department Station 3 (Q). Display/hide their locations on the map
Shopping Centers: Washington Square Shopping Center (1), Plaza North Shopping Center (2), Petaluma Plaza Shopping Center (3). Display/hide their locations on the map
Parks in zip code 94954 include: Petaluma Adobe State Historic Park (1), Lucchesi Park (2), Bond Park (3), Prince Park (4), Crinella Park (5), Del Oro Park (6), La Tercera Park (7), McDowell Park (8), Miwok Park (9). Display/hide their locations on the map
5,380 married couples with children.
1,297 single-parent households (452 men, 845 women).
78.1% of residents of 94954 zip code speak English at home.
14.8% of residents speak Spanish at home (61% very well, 21% well, 12% not well, 5% not at all).
3.0% of residents speak other Indo-European language at home (74% very well, 18% well, 8% not well).
3.2% of residents speak Asian or Pacific Island language at home (55% very well, 26% well, 20% not well).
0.8% of residents speak other language at home (83% very well, 8% well, 4% not well, 5% not at all).
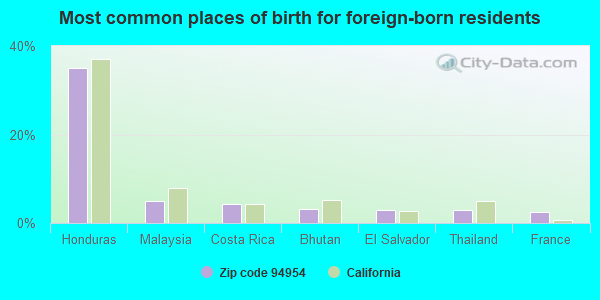
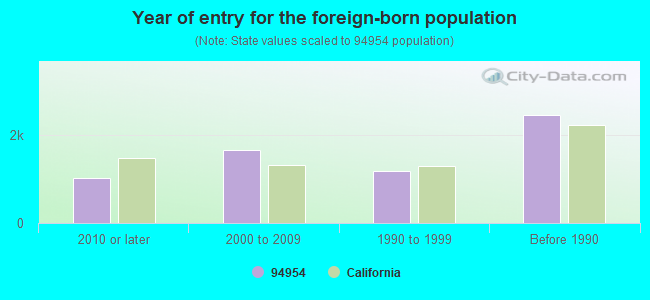
Foreign born population: 5,877 (15.5%) (61.9% of them are naturalized citizens)
Major facilities with environmental interests located in this zip code:
IGC POLYCOLD SYSTEMS (3800 LAKEVILLE HIGHWAY in PETALUMA, CA)
(Integrated Compliance Information System) - ICIS-09-2005-0133, ENFORCEMENT/COMPLIANCE ACTIVITY FORMAL ENFORCEMENT ACTION (Integrated Compliance Information System) - ICIS-09-2005-0133, ENFORCEMENT/COMPLIANCE ACTIVITY COMPLIANCE ACTIVITY (Tracking inspections of insecticide, fungicide, and rodenticide, and toxic substances) TRI REPORTER (Tracking of toxic chemicals releasing facilities) Business SIC classification: AIR-CONDITIONING AND WARM AIR HEATING EQUIPMENT AND COMMERCIAL AND INDUSTRIAL REFRIGERATION EQUIPMENT Alternative names: BROOKS AUTOMATION INC, HELIX POLYCOLD SYSTEMS
KAISER PERMANENTE MEDICAL OFFICES (3900 LAKEVILLE HIGHWAY in PETALUMA, CA)
STATE MASTER (California - Hazardous Waste Tracking) - HAZARDOU WASTE PROGRAM HAZARDOUS WASTE BIENNIAL REPORTER (Resource Conservation and Recovery Act (tracking hazardous waste)) Large Quantity Generators, more that 1000 kg of hazardous waste/month (Resource Conservation and Recovery Act (tracking hazardous waste)) Business NAICS classification: OFFICES OF ALL OTHER MISCELLANEOUS HEALTH PRACTITIONERS. Alternative names: KAISER PETALUMA MEDL OFS BLDG
MESA ENGINEERING (1317 ROSS ST. in PETALUMA, CA)
STATE MASTER (California - Hazardous Waste Tracking) - HAZARDOU WASTE PROGRAM Small Quantity Generators, between 100 kg and 1000 kg of hazardous waste/month (Resource Conservation and Recovery Act (tracking hazardous waste)) - notification TRI REPORTER (Tracking of toxic chemicals releasing facilities) Business SIC classification: ELECTRONIC COMPONENTS Organizations: RANDALL SMITH (CONTACT/OWNER)
ADVANCED DEVICES INCORPORATED (1340 COMMERCE ST UNIT C in PETALUMA, CA)
STATE MASTER (California - Hazardous Waste Tracking) - HAZARDOU WASTE PROGRAM Small Quantity Generators, between 100 kg and 1000 kg of hazardous waste/month (Resource Conservation and Recovery Act (tracking hazardous waste)) - notification Organizations: E V TOLY (CONTACT/OWNER)
LYNCH CREEK WAY IMAGING CTR (110 LYNCH CREEK WY STE B in PETALUMA, CA)
STATE MASTER (California - Hazardous Waste Tracking) - HAZARDOU WASTE PROGRAM Small Quantity Generators, between 100 kg and 1000 kg of hazardous waste/month (Resource Conservation and Recovery Act (tracking hazardous waste)) - notification Organizations: PETALUMA VALLEY HOSPITAL (CONTACT/OWNER)
CHEVRON STATION NO 94081 (1440 E WASHINGTON ST in PETALUMA, CA)
STATE MASTER (California - Hazardous Waste Tracking) - HAZARDOU WASTE PROGRAM Small Quantity Generators, between 100 kg and 1000 kg of hazardous waste/month (Resource Conservation and Recovery Act (tracking hazardous waste)) - notification Organizations: CHEVRON PRODUCTS CO (CONTACT/OWNER)
ELDREDGE (BERNARD) ELEMENTARY (207 MARIA DR. in PETALUMA, CA)
(National Center for Education Statistics) - STATE ID-6051908 Organizations: OLD ADOBE UNION ELEMENTARY (SCHOOL DISTRICT)
LA TERCERA ELEMENTARY (1600 ALBIN WAY in PETALUMA, CA)
(National Center for Education Statistics) - STATE ID-6051916 Organizations: OLD ADOBE UNION ELEMENTARY (SCHOOL DISTRICT)
MCDOWELL ELEMENTARY (1425 MCGREGOR DR. in PETALUMA, CA)
(National Center for Education Statistics) - STATE ID-6051957 Organizations: PETALUMA CITY ELEMENTARY (SCHOOL DISTRICT)
MEADOW ELEMENTARY (880 MARIA DR. in PETALUMA, CA)
(National Center for Education Statistics) - STATE ID-6110324 Organizations: WAUGH ELEMENTARY (SCHOOL DISTRICT)
MIWOK VALLEY ELEMENTARY (1010 ST. FRANCIS DR. in PETALUMA, CA)
(National Center for Education Statistics) - STATE ID-6072136 Organizations: OLD ADOBE UNION ELEMENTARY (SCHOOL DISTRICT)
CASA GRANDE HIGH (333 CASA GRANDE ROAD in PETALUMA, CA)
(National Center for Education Statistics) - STATE ID-4930012 Organizations: PETALUMA JOINT UNION HIGH (SCHOOL DISTRICT)
FIREMANS FUND (3700 LAKEVILLE HIGHWAY FIRST FLOOR in PETALUMA, CA)
CRITERIA AND HAZARDOUS AIR POLLUTANT INVENTORY (Inventory of air pollution sources) Small Quantity Generators, between 100 kg and 1000 kg of hazardous waste/month (Resource Conservation and Recovery Act (tracking hazardous waste)) - notification Business SIC classification: COMMERCIAL PRINTING, LITHOGRAPHIC Organizations: LABCON NORTH AMERICA (CONTACT/OPERATOR)
Housing units lacking complete plumbing facilities: 0.3% Housing units lacking complete kitchen facilities: 0.4%
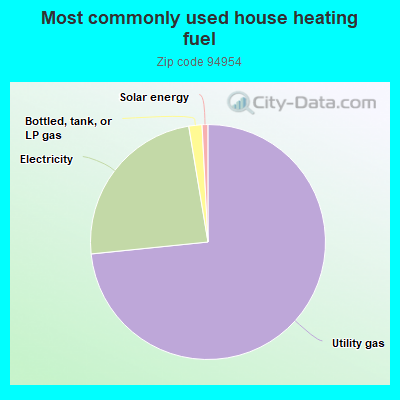
72.8%Utility gas
23.8%Electricity
1.8%Bottled, tank, or LP gas
0.8%Solar energy
Population in 1990: 27,667. Population change in the 1990s: +7,733 (+28.0%).
Place of birth for U.S.-born residents:
This state: 25,025
Northeast: 2,006
Midwest: 1,759
South: 1,190
West: 1,507
57% of the 94954 zip code residents lived in the same house 5 years ago. Out of people who lived in different houses, 53% lived in this county. Out of people who lived in different counties, 50% lived in California.
91% of the 94954 zip code residents lived in the same house 1 year ago. Out of people who lived in different houses, 46% moved from this county. Out of people who lived in different houses, 45% moved from different county within same state. Out of people who lived in different houses, 6% moved from different state. Out of people who lived in different houses, 4% moved from abroad.
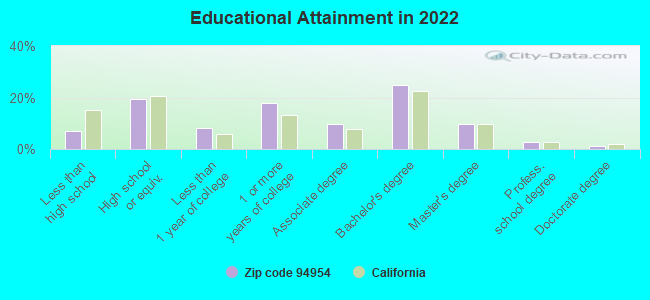
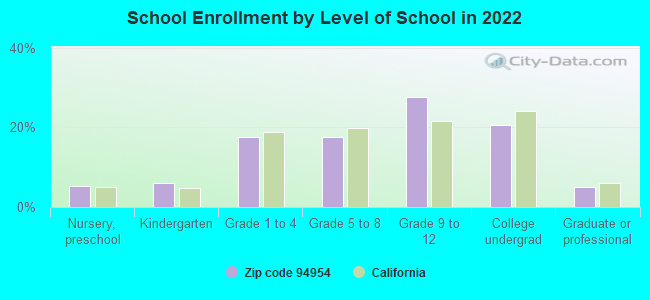
Private vs. public school enrollment:
Students in private schools in grades 1 to 8 (elementary and middle school): 154
Here:
5.5%
California:
10.5%
Students in private schools in grades 9 to 12 (high school): 50
Here:
2.3%
California:
8.5%
Students in private undergraduate colleges: 114
Here:
7.0%
California:
15.9%
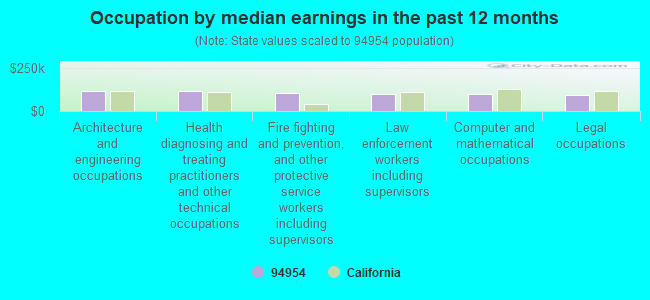
Occupation by median earnings in the past 12 months ($)
113,596Architecture and engineering occupations
113,245Health diagnosing and treating practitioners and other technical occupations
105,824Fire fighting and prevention, and other protective service workers including supervisors
100,250Law enforcement workers including supervisors
97,468Computer and mathematical occupations
90,702Legal occupations
Companies with federal contracts located in this zip code (PETALUMA, CA):
STX, INC (1460 -A CADER LANE; small business) : $6,068,191 in 7 contractsfrom 2003 to 2005
Contracts for Clothing, Special Purpose, Athletic and Sporting Equipment, Safety and Rescue Equipment, Individual Equipment by Defense Logistics Agency, Army Signed by year:2000: $0; 2001: $0; 2002: $0; 2003: $35,832; 2004: $3,255,000; 2005: $2,777,359; 2006: $0.
Biggest contracts:
$3,255,000 with Defense Logistics Agency for Clothing, Special Purpose. Signed on 2004-10-21. Completion date: 2005-03-21.
$1,929,750, same as above.Signed on 2005-01-18. Completion date: 2005-08-29.
$837,000, same as above.Signed on 2005-11-07. Completion date: 2006-04-10.
$20,730 with Army for Clothing, Special Purpose. Signed on 2003-08-13. Completion date: 2003-08-27.
CALIX NETWORKS INC (1035 N MCDOWELL BLVD; small business) : $1,272,783 in 19 contractsfrom 2004 to 2006
Contracts for Misc Fiber Optic Components, Filters and Networks, Miscellaneous Communication Equipment, Electrical and Electronic assemblies, Boards, Cards, and Associated Hardware by Army Signed by year:2000: $0; 2001: $0; 2002: $0; 2003: $0; 2004: $297,751; 2005: $821,355; 2006: $153,677.
Biggest contracts:
$300,260 with Army for Misc Fiber Optic Components. Signed on 2005-04-08. Completion date: 2005-05-15.
$168,819, same as above.Signed on 2005-05-05. Completion date: 2005-06-07.
$158,171, same as above.Signed on 2005-09-26. Completion date: 2005-10-25.
$154,571 with Army for Filters and Networks. Signed on 2004-09-01. Completion date: 2004-09-23.
JAMES FURULI INVESTMENT CO INC (1320 COMMERCE ST STE T; small business) : $643,055 in 11 contractsfrom 2001 to 2006
Contracts for Other Housekeeping Services, Custodial Janitorial Services, Other Special Studies and Analyses by Army, U.S. Army Corps of Engineers - civil program financing only Signed by year:2000: $0; 2001: $157,634; 2002: $104,901; 2003: $209,802; 2004: $0; 2005: $16,411; 2006: $154,307.
Biggest contracts:
$154,307 with Army for Other Housekeeping Services. Signed on 2006-01-10. Completion date: 2006-09-30.
$104,901 with U.S. Army Corps of Engineers - civil program financing only for Custodial Janitorial Services. Signed on 2003-12-15. Completion date: 2002-09-30.
$104,901 with Army for Custodial Janitorial Services. Signed on 2003-12-15. Completion date: 2002-09-30.
$104,901 with U.S. Army Corps of Engineers - civil program financing only for Custodial Janitorial Services. Signed on 2002-11-14. Completion date: 2003-09-30.
UBIQUITY COMMUNICATION, INC. (1367 REDWOOD WAY; small business) : $374,586 in 2 contractsfrom 1999 to 2000
$224,589 with Navy for Defense Electronics and Communication Equipment -- Applied Research and Exploratory Development (R&D). Signed on 1999-12-14. Completion date: 1999-12-14.
$149,997, same as above.Signed on 2000-03-02. Completion date: 2000-09-02.
EMPIRE ELEVATOR COMPANY, INCOR (1004 CLEGG CT) : $254,969 in 10 contractsfrom 2000 to 2005
Contracts for Maintenance, Repair and Rebuilding of Equipment -- Miscellaneous, Freight Elevators, Maintenance, Repair or Alteration of Real Property -- Other Non-Building Facilities, Fittings for Rope, Cable, and Chain, and moreby U.S. Army Corps of Engineers - civil program financing only, Army, Public Buildings Service Signed by year:2000: $7,000; 2001: $0; 2002: $0; 2003: $167,545; 2004: $71,424; 2005: $9,000; 2006: $0.
Biggest contracts:
$127,545 with U.S. Army Corps of Engineers - civil program financing only for Maintenance, Repair and Rebuilding of Equipment -- Miscellaneous. Signed on 2003-06-03. Completion date: 2003-05-01.
$33,112 with U.S. Army Corps of Engineers - civil program financing only for Freight Elevators. Signed on 2004-11-19. Completion date: 2004-11-17.
$33,112 with Army for Freight Elevators. Signed on 2004-11-19. Completion date: 2004-11-17.
$20,000 with Army for Maintenance, Repair and Rebuilding of Equipment -- Miscellaneous. Signed on 2003-11-04. Completion date: 2003-11-28.
ZACHARY M REYNOLDS & ASSOCIATE (1390 N MCDOWELL BLVD SUIT; small business) : $153,750 in 11 contractsfrom 2003 to 2006
Contracts for Maintenance, Repair and Rebuilding of Equipment -- Ship and Marine Equipment, Other Professional Services, Miscellaneous Ship and Marine Equipment by Army, U.S. Army Corps of Engineers - civil program financing only Signed by year:2000: $0; 2001: $0; 2002: $0; 2003: $40,000; 2004: $0; 2005: $59,750; 2006: $54,000.
Biggest contracts:
$45,000 with Army for Maintenance, Repair and Rebuilding of Equipment -- Ship and Marine Equipment. Signed on 2006-03-28. Completion date: 2006-02-02.
$20,000 with Army for Other Professional Services. Signed on 2003-10-01. Completion date: 2004-09-30.
$20,000 with U.S. Army Corps of Engineers - civil program financing only for Other Professional Services. Signed on 2003-10-01. Completion date: 2004-09-30.
$19,875 with U.S. Army Corps of Engineers - civil program financing only for Miscellaneous Ship and Marine Equipment. Signed on 2005-02-17. Completion date: 2005-01-21.
TURIN NETWORKS INC (1415 N MCDOWELL BLVD; small business)
$45,910 with Navy for ADP Input/Output and Storage Devices. Signed on 2006-03-29. Completion date: 2006-04-27.
BAY DECKING CO, INC (25 DEL SOL COURT; small business) 1000 employees, $0 revenue. Small Disadvantaged Business, Hispanic American Owned Business, Emerging Small Business: $43,052 in 2 contractsfrom 2004 to 2006
$34,912 with U.S. Coast Guard for Non-nuclear Ship Repair (West) Ship repair (including overhauls and conversions) performed on. non-nuclear propelled and nonpropelled ships west of the 108th meridian. Taking place in WA. Signed on 2004-07-26. Effective on 2004-08-13. Completion date: 2004-09-09.
$8,140 with Navy for Non-nuclear Ship Repair (West) Ship repair (including overhauls and conversions) performed on. non-nuclear propelled and nonpropelled ships west of the 108th meridian. Taking place in WA. Signed on 2006-03-03. Completion date: 2006-02-23.
LOK REDWOOD EMPIRE PROPERTIES (5100 MONTERO WAY; small business)
$8,840 with Army for Lodging - Hotel/Motel. Signed on 2004-01-14. Completion date: 2004-01-19.
Top industries in this zip code by the number of employees in 2005:
Professional, Scientific, and Technical Services: Research and Development in the Physical, Engineering, and Life Sciences (250-499 employees: 1 establishment, 100-249 employees: 1 establishment, 20-49 employees: 1 establishment, 1-4 employees: 1 establishment)
Finance and Insurance: Insurance Agencies and Brokerages (250-499: 1, 50-99: 1, 20-49: 1, 5-9: 3, 1-4: 7)
Health Care and Social Assistance: Offices of Physicians (except Mental Health Specialists) (100-249: 1, 50-99: 1, 10-19: 2, 5-9: 11, 1-4: 21)
Health Care and Social Assistance: General Medical and Surgical Hospitals (250-499: 1)
Professional, Scientific, and Technical Services: Research and Development in the Social Sciences and Humanities (250-499: 1)
2002 - 2018 National Fire Incident Reporting System (NFIRS) incidents
According to the data from the years 2002 - 2018 the average number of fires per year is 45. The highest number of fires - 120 took place in 2005, and the least - 0 in 2003. The data has an increasing trend.
When looking into fire subcategories, the most incidents belonged to: Outside Fires (54.0%), and Structure Fires (30.1%).
Fire incident types reported to NFIRS in Zip Code 94954


 Nearest zip codes: 95476, 94945, 95431, 94951, 94947, 95442.


 According to the data from the years 2002 - 2018 the average number of fires per year is 45. The highest number of fires - 120 took place in 2005, and the least - 0 in 2003. The data has an increasing trend.
 When looking into fire subcategories, the most incidents belonged to: Outside Fires (54.0%), and Structure Fires (30.1%).