Estimated zip code population in 2022: 36,083 Zip code population in 2010: 35,394 Zip code population in 2000: 34,310
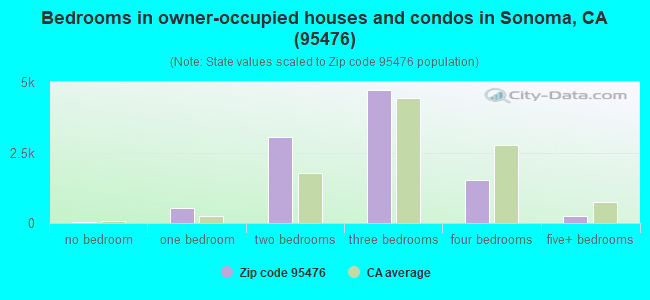
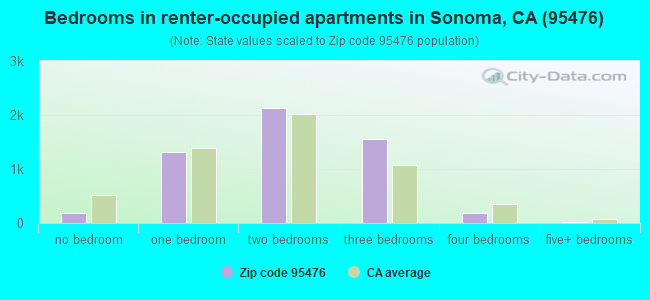
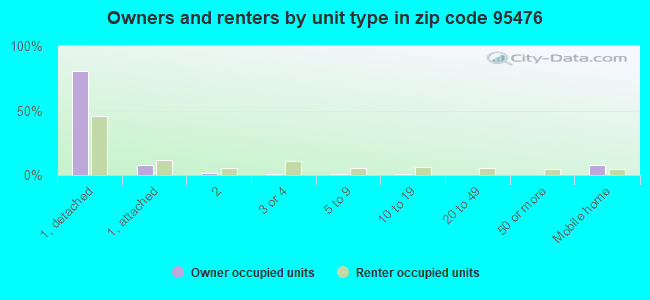
Houses and condos: 16,984 Renter-occupied apartments: 5,428
% of renters here:
35%
State:
44%
March 2022 cost of living index in zip code 95476: 117.1 (more than average, U.S. average is 100)
Land area: 112.0 sq. mi. Water area: 0.8 sq. mi.
Population density: 322 people per square mile
(very low).
OSM Map
General Map
Google Map
MSN Map
OSM Map
General Map
Google Map
MSN Map
OSM Map
General Map
Google Map
MSN Map
OSM Map
General Map
Google Map
MSN Map
Please wait while loading the map...
Real estate property taxes paid for housing units in 2022:
This zip code:
0.7% ($6,651)
California:
0.7% ($4,831)
Median real estate property taxes paid for housing units with mortgages in 2022: $7,206 (0.7%) Median real estate property taxes paid for housing units with no mortgage in 2022: $5,859 (0.7%)
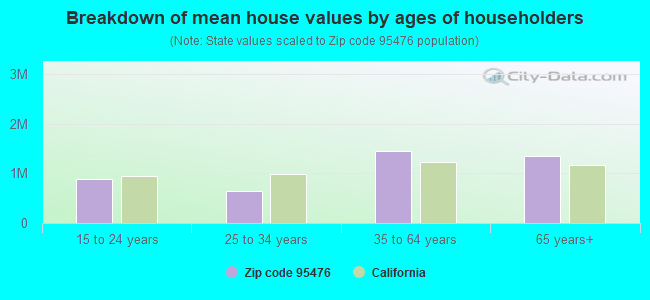
Estimated median house/condo value in 2022: $918,628
95476:
$918,628
California:
$715,900
According to our research of California and other state lists, there were 27 registered sex offenders living in 95476 zip code as of April 27, 2024. The ratio of all residents to sex offenders in zip code 95476 is 1,410 to 1. The ratio of registered sex offenders to all residents in this zip code is lower than the state average.
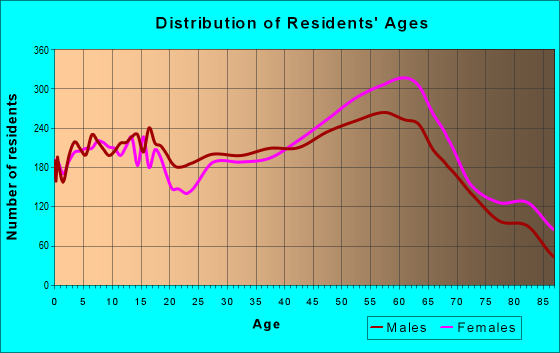
Median resident age:
This zip code:
52.8 years
California median age:
37.9 years
Average household size:
This zip code:
2.3 people
California:
2.8 people
Averages for the 2020 tax year for zip code 95476, filed in 2021:
Average Adjusted Gross Income (AGI) in 2020: $127,496 (Individual Income Tax Returns)
Here:
$127,496
State:
$95,910
Salary/wage: $86,474 (reported on 68.6% of returns)
Here:
$86,474
State:
$77,331
(% of AGI for various income ranges: 1331.3% for AGIs below $25k, 4348.7% for AGIs $25k-50k, 7252.9% for AGIs $50k-75k, 10103.1% for AGIs $75k-100k, 20323.9% for AGIs $100k-200k, 123561.6% for AGIs over 200k)
Taxable interest for individuals: $2,828 (reported on 46.4% of returns)
This zip code:
$2,828
California:
$2,294
(% of AGI for various income ranges: 60.0% for AGIs below $25k, 54.1% for AGIs $25k-50k, 98.4% for AGIs $50k-75k, 201.6% for AGIs $75k-100k, 437.4% for AGIs $100k-200k, 3064.5% for AGIs over 200k)
Ordinary dividends: $15,713 (reported on 33.2% of returns)
Here:
$15,713
State:
$10,949
(% of AGI for various income ranges: 142.0% for AGIs below $25k, 159.8% for AGIs $25k-50k, 320.3% for AGIs $50k-75k, 610.9% for AGIs $75k-100k, 1381.7% for AGIs $100k-200k, 14644.5% for AGIs over 200k)
Net capital gain/loss in AGI: +$71,713 (reported on 31.3% of returns)
Here:
+$71,713
State:
+$49,306
(% of AGI for various income ranges: 57.0% for AGIs below $25k, 102.6% for AGIs $25k-50k, 222.2% for AGIs $50k-75k, 526.1% for AGIs $75k-100k, 1761.1% for AGIs $100k-200k, 89501.6% for AGIs over 200k)
Profit/loss from business: +$33,216 (reported on 21.8% of returns)
Here:
+$33,216
State:
+$15,671
(% of AGI for various income ranges: 303.0% for AGIs below $25k, 412.0% for AGIs $25k-50k, 618.8% for AGIs $50k-75k, 887.1% for AGIs $75k-100k, 2008.5% for AGIs $100k-200k, 17958.4% for AGIs over 200k)
Taxable individual retirement arrangement distribution: $27,468 (reported on 14.4% of returns)
95476:
$27,468
California:
$23,505
(% of AGI for various income ranges: 129.2% for AGIs below $25k, 218.7% for AGIs $25k-50k, 468.0% for AGIs $50k-75k, 838.4% for AGIs $75k-100k, 1986.8% for AGIs $100k-200k, 6176.8% for AGIs over 200k)
Self-employed (Keogh) retirement plans: $33,567 (reported on 2.2% of returns)
95476:
$33,567
California:
$30,163
(% of AGI for various income ranges: 9.3% for AGIs $25k-50k, 45.2% for AGIs $50k-75k, 202.1% for AGIs $100k-200k, 2376.8% for AGIs over 200k)
Total itemized deductions: $42,847 (reported on 21.1% of returns)
Here:
$42,847
State:
$39,517
(% of AGI for various income ranges: 318.6% for AGIs below $25k, 461.0% for AGIs $25k-50k, 809.4% for AGIs $50k-75k, 1585.7% for AGIs $75k-100k, 3241.1% for AGIs $100k-200k, 19690.3% for AGIs over 200k)
Charity contributions: $11,381 (reported on 16.9% of returns)
Here:
$11,381
State:
$12,598
(% of AGI for various income ranges: 11.6% for AGIs below $25k, 26.0% for AGIs $25k-50k, 56.5% for AGIs $50k-75k, 140.3% for AGIs $75k-100k, 437.5% for AGIs $100k-200k, 6386.8% for AGIs over 200k)
Taxes paid: $8,753 (reported on 21.0% of returns)
95476:
$8,753
State:
$8,807
(% of AGI for various income ranges: 65.7% for AGIs below $25k, 102.0% for AGIs $25k-50k, 225.0% for AGIs $50k-75k, 446.0% for AGIs $75k-100k, 880.1% for AGIs $100k-200k, 2839.5% for AGIs over 200k)
Earned income credit: $1,589 (reported on 6.9% of returns)
Here:
$1,589
State:
$2,074
(% of AGI for various income ranges: 51.5% for AGIs below $25k, 40.5% for AGIs $25k-50k)
Percentage of individuals using paid preparers for their 2020 taxes: 91.6%
Here:
92%
State:
92%
(% for various income ranges: 89.0% for AGIs below $25k, 90.8% for AGIs $25k-50k, 91.7% for AGIs $50k-75k, 93.7% for AGIs $75k-100k, 93.4% for AGIs $100k-200k, 94.0% for AGIs over 200k)
Averages for the 2012 tax year for zip code 95476, filed in 2013:
Average Adjusted Gross Income (AGI) in 2012: $89,012 (Individual Income Tax Returns)
Here:
$89,012
State:
$72,726
Salary/wage: $60,032 (reported on 71.2% of returns)
Here:
$60,032
State:
$59,079
(% of AGI for various income ranges: 63.3% for AGIs below $25k, 66.8% for AGIs $25k-50k, 59.8% for AGIs $50k-75k, 57.5% for AGIs $75k-100k, 59.5% for AGIs $100k-200k, 32.5% for AGIs over 200k)
Taxable interest for individuals: $2,872 (reported on 46.2% of returns)
This zip code:
$2,872
California:
$2,146
(% of AGI for various income ranges: 2.6% for AGIs below $25k, 1.4% for AGIs $25k-50k, 1.5% for AGIs $50k-75k, 1.4% for AGIs $75k-100k, 1.3% for AGIs $100k-200k, 1.5% for AGIs over 200k)
Ordinary dividends: $11,651 (reported on 31.9% of returns)
Here:
$11,651
State:
$9,308
(% of AGI for various income ranges: 4.7% for AGIs below $25k, 2.9% for AGIs $25k-50k, 3.1% for AGIs $50k-75k, 3.3% for AGIs $75k-100k, 3.4% for AGIs $100k-200k, 5.2% for AGIs over 200k)
Net capital gain/loss in AGI: +$44,466 (reported on 29.5% of returns)
Here:
+$44,466
State:
+$30,460
(% of AGI for various income ranges: 0.8% for AGIs $25k-50k, 0.8% for AGIs $50k-75k, 1.7% for AGIs $75k-100k, 3.0% for AGIs $100k-200k, 30.4% for AGIs over 200k)
Profit/loss from business: +$25,088 (reported on 22.3% of returns)
Here:
+$25,088
State:
+$17,064
(% of AGI for various income ranges: 13.1% for AGIs below $25k, 8.2% for AGIs $25k-50k, 7.6% for AGIs $50k-75k, 6.8% for AGIs $75k-100k, 7.0% for AGIs $100k-200k, 4.4% for AGIs over 200k)
Taxable individual retirement arrangement distribution: $21,885 (reported on 15.4% of returns)
95476:
$21,885
California:
$19,557
(% of AGI for various income ranges: 5.0% for AGIs below $25k, 3.7% for AGIs $25k-50k, 4.3% for AGIs $50k-75k, 4.3% for AGIs $75k-100k, 5.1% for AGIs $100k-200k, 2.8% for AGIs over 200k)
Self-employment retirement plans: $20,950 (reported on 2.0% of returns)
95476:
$20,950
California:
$24,530
(% of AGI for various income ranges: 0.3% for AGIs $25k-50k, 0.4% for AGIs $50k-75k, 0.3% for AGIs $75k-100k, 0.6% for AGIs $100k-200k, 0.5% for AGIs over 200k)
Total itemized deductions: $37,228 (23% of AGI, reported on 43.6% of returns)
Here:
$37,228
State:
$34,004
Here:
23.1% of AGI
State:
22.7% of AGI
(% of AGI for various income ranges: 21.7% for AGIs below $25k, 14.8% for AGIs $25k-50k, 17.9% for AGIs $50k-75k, 20.4% for AGIs $75k-100k, 21.0% for AGIs $100k-200k, 16.9% for AGIs over 200k)
Charity contributions: $5,061 (reported on 36.6% of returns)
Here:
$5,061
State:
$4,659
(% of AGI for various income ranges: 1.1% for AGIs below $25k, 1.0% for AGIs $25k-50k, 1.2% for AGIs $50k-75k, 1.6% for AGIs $75k-100k, 1.9% for AGIs $100k-200k, 2.8% for AGIs over 200k)
Taxes paid: $16,356 (reported on 43.5% of returns)
95476:
$16,356
State:
$14,448
(% of AGI for various income ranges: 4.7% for AGIs below $25k, 3.8% for AGIs $25k-50k, 5.3% for AGIs $50k-75k, 7.0% for AGIs $75k-100k, 8.4% for AGIs $100k-200k, 9.7% for AGIs over 200k)
Earned income credit: $1,863 (reported on 8.7% of returns)
Here:
$1,863
State:
$2,286
(% of AGI for various income ranges: 2.8% for AGIs below $25k, 0.6% for AGIs $25k-50k)
Percentage of individuals using paid preparers for their 2012 taxes: 63.8%
Here:
64%
State:
64%
(% for various income ranges: 56.2% for AGIs below $25k, 61.2% for AGIs $25k-50k, 65.1% for AGIs $50k-75k, 69.1% for AGIs $75k-100k, 72.1% for AGIs $100k-200k, 83.0% for AGIs over 200k)
Averages for the 2004 tax year for zip code 95476, filed in 2005:
Average Adjusted Gross Income (AGI) in 2004: $66,897 (Individual Income Tax Returns)
Here:
$66,897
State:
$58,600
Salary/wage: $54,190 (reported on 70.0% of returns)
Here:
$54,190
State:
$49,455
(% of AGI for various income ranges: 59.9% for AGIs $10k-25k, 66.3% for AGIs $25k-50k, 63.3% for AGIs $50k-75k, 66.8% for AGIs $75k-100k, 47.7% for AGIs over 100k)
Taxable interest for individuals: $3,103 (reported on 58.3% of returns)
This zip code:
$3,103
California:
$2,365
(% of AGI for various income ranges: 5.3% for AGIs $10k-25k, 3.0% for AGIs $25k-50k, 2.9% for AGIs $50k-75k, 2.2% for AGIs $75k-100k, 2.1% for AGIs over 100k)
Taxable dividends: $5,620 (reported on 38.6% of returns)
Here:
$5,620
State:
$4,746
(% of AGI for various income ranges: 4.8% for AGIs $10k-25k, 2.8% for AGIs $25k-50k, 3.1% for AGIs $50k-75k, 2.6% for AGIs $75k-100k, 3.0% for AGIs over 100k)
Net capital gain/loss: +$23,465 (reported on 34.2% of returns)
Here:
+$23,465
State:
+$23,418
(% of AGI for various income ranges: 0.1% for AGIs $10k-25k, 1.2% for AGIs $25k-50k, 1.9% for AGIs $50k-75k, 2.2% for AGIs $75k-100k, 19.7% for AGIs over 100k)
Profit/loss from business: +$23,928 (reported on 22.3% of returns)
Here:
+$23,928
State:
+$16,826
(% of AGI for various income ranges: 8.6% for AGIs $10k-25k, 8.4% for AGIs $25k-50k, 7.3% for AGIs $50k-75k, 7.7% for AGIs $75k-100k, 8.0% for AGIs over 100k)
IRA payment deduction: $3,293 (reported on 3.9% of returns)
95476:
$3,293
California:
$3,192
(% of AGI for various income ranges: 0.3% for AGIs $10k-25k, 0.4% for AGIs $25k-50k, 0.3% for AGIs $50k-75k, 0.2% for AGIs $75k-100k, 0.1% for AGIs over 100k)
Self-employed pension: $16,689 (reported on 3.0% of returns)
Here:
$16,689
California:
$17,688
(% of AGI for various income ranges: 0.3% for AGIs $10k-25k, 0.4% for AGIs $25k-50k, 0.5% for AGIs $50k-75k, 0.6% for AGIs $75k-100k, 0.9% for AGIs over 100k)
Total itemized deductions: $30,909 (26% of AGI, reported on 45.6% of returns)
Here:
$30,909
State:
$28,113
Here:
26.4% of AGI
State:
25.3% of AGI
(% of AGI for various income ranges: 21.9% for AGIs $10k-25k, 18.6% for AGIs $25k-50k, 22.0% for AGIs $50k-75k, 22.8% for AGIs $75k-100k, 19.7% for AGIs over 100k)
Charity contributions deductions: $3,909 (3% of AGI, reported on 40.3% of returns)
Here:
$3,909
State:
$3,923
Here:
3.2% of AGI
State:
3.3% of AGI
(% of AGI for various income ranges: 1.3% for AGIs $10k-25k, 1.4% for AGIs $25k-50k, 1.7% for AGIs $50k-75k, 1.9% for AGIs $75k-100k, 2.8% for AGIs over 100k)
Total tax: $12,352 (reported on 80.7% of returns)
95476:
$12,352
State:
$10,761
(% of AGI for various income ranges: 5.0% for AGIs $10k-25k, 7.9% for AGIs $25k-50k, 9.7% for AGIs $50k-75k, 10.9% for AGIs $75k-100k, 19.0% for AGIs over 100k)
Earned income credit: $1,281 (reported on 6.5% of returns)
Here:
$1,281
State:
$1,763
Percentage of individuals using paid preparers for their 2004 taxes: 67.8%
Here:
68%
State:
66%
(% for various income ranges: 59.6% for AGIs below $10k, 64.5% for AGIs $10k-25k, 64.6% for AGIs $25k-50k, 72.6% for AGIs $50k-75k, 71.2% for AGIs $75k-100k, 80.1% for AGIs over 100k)
Likely homosexual households (counted as self-reported same-sex unmarried-partner households)
Lesbian couples: 0.1% of all households
Gay men: 0.3% of all households
Household received Food Stamps/SNAP in the past 12 months: 990 Household did not receive Food Stamps/SNAP in the past 12 months: 14,335
Women who had a birth in the past 12 months: 535 (413 now married, 121 unmarried) Women who did not have a birth in the past 12 months: 5,690 (2,197 now married, 3,495 unmarried)
Housing units in zip code 95476 with a mortgage: 5,853 (769 second mortgage, 45 home equity loan, 672 both second mortgage and home equity loan) Houses without a mortgage: 74
Median monthly owner costs for units with a mortgage: $2,952 Median monthly owner costs for units without a mortgage: over $1,000
Residents with income below the poverty level in 2022:
This zip code:
8.6%
Whole state:
12.2%
Residents with income below 50% of the poverty level in 2022:
This zip code:
3.8%
Whole state:
6.2%
Median number of rooms in houses and condos:
Here:
5.6
State:
6.0
Median number of rooms in apartments:
Here:
4.1
State:
3.9
Notable locations in this zip code not listed on our city pages
Notable locations in zip code 95476: Camp Five (A), Camp Four (B), Camp One (C), Camp Six (D), Camp Three (E), Camp Two (F), Buena Vista Wine Cellars (G), Sweetwater Club (H), Sonoma Valley Club (I), Reclamation (J), Island Land Club (K), Viansa Winery (L), Sonoma Creek Winery (M), Infineon Raceway (N), Roche Winery (O), Homewood Winery (P), Gloria Ferrer Winery (Q), Cline Cellars Winery (R), Los Arroyos Golf Course (S), Castagnasso Farm (T). Display/hide their locations on the map
Churches in zip code 95476 include: First Baptist Church (A), Grace Reformed Church (B), Saint Francis Solano Roman Catholic Church (C), Trinity Episcopal Church (D), Craig Avenue Baptist Church (E), Mission San Francisco Solano (F), First Congregational Church of Sonoma (G), Sonoma Mission (H). Display/hide their locations on the map
Streams, rivers, and creeks: Carriger Creek (A), Champlin Creek (B), Dowdall Creek (C), Felder Creek (D), Fowler Creek (E), Haraszthy Creek (F), Hooker Creek (G), Nathanson Creek (H), Wilson Creek (I). Display/hide their locations on the map
Parks in zip code 95476 include: Vallejo Home State Historical Monument (1), Sonoma Plaza (2), Arnold Field (3), Depot Park (4), Eraldi Park (5), Ernie Smith Park (6), Hughes Park (7), Larson Park (8), Maxwell Farms Regional Park (9). Display/hide their locations on the map
3,552 married couples with children.
1,326 single-parent households (519 men, 807 women).
73.9% of residents of 95476 zip code speak English at home.
22.5% of residents speak Spanish at home (60% very well, 22% well, 13% not well, 5% not at all).
2.5% of residents speak other Indo-European language at home (85% very well, 13% well, 2% not well).
1.2% of residents speak Asian or Pacific Island language at home (64% very well, 19% well, 16% not well).
0.3% of residents speak other language at home (92% very well, 8% well).
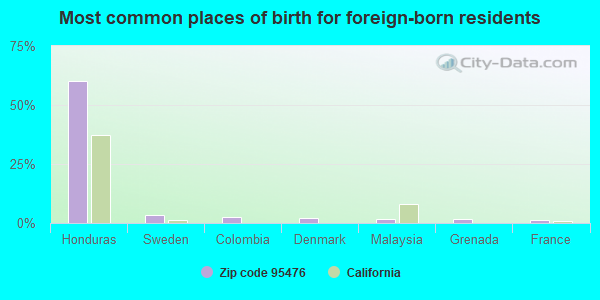
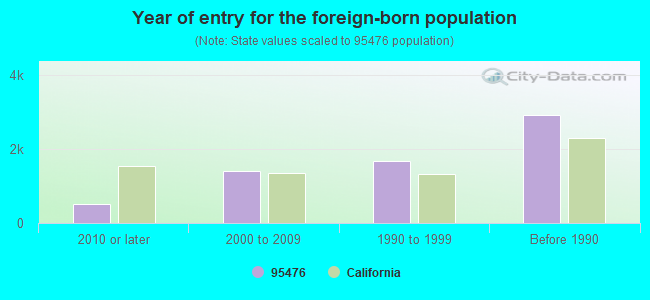
Foreign born population: 6,269 (17.4%) (52.0% of them are naturalized citizens)
This zip code:
17.4%
Whole state:
26.7%
60%Honduras
3%Sweden
2%Colombia
2%Denmark
2%Malaysia
2%Grenada
1%France
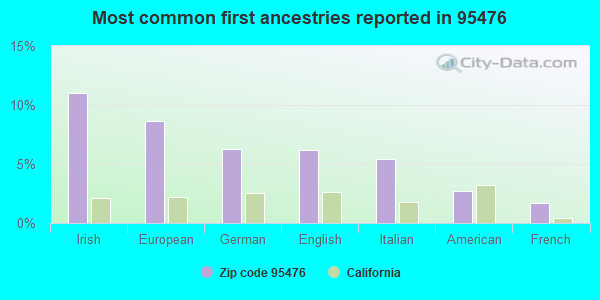
11%Irish
9%European
6%German
6%English
5%Italian
3%American
2%French
Year of entry for the foreign-born population
5152010 or later
1,3922000 to 2009
1,6891990 to 1999
2,919Before 1990
Major facilities with environmental interests located in this zip code:
ALTIMIRA MIDDLE SCHOOL (17805 ARNOLD DRIVE in SONOMA, CA)
(Geographic Names Information System) (National Center for Education Statistics) - STATE ID-6052245 Small Quantity Generators, between 100 kg and 1000 kg of hazardous waste/month (Resource Conservation and Recovery Act (tracking hazardous waste)) Organizations: SONOMA VALLEY UNIFIED (SCHOOL DISTRICT)
Alternative names: ALTAMIRA
MAXWELL VILLAGE CLEANERS (19131 SONOMA HWY in SONOMA, CA)
STATE MASTER (California - Hazardous Waste Tracking) - HAZARDOU WASTE PROGRAM CRITERIA AND HAZARDOUS AIR POLLUTANT INVENTORY (Inventory of air pollution sources) Small Quantity Generators, between 100 kg and 1000 kg of hazardous waste/month (Resource Conservation and Recovery Act (tracking hazardous waste)) - notification Business SIC classification: DRYCLEANING PLANTS, EXCEPT RUG CLEANING Organizations: JIM PITTS (CONTACT/OWNER)
FLOWERY (17600 SONOMA HIGHWAY in SONOMA, CA)
(National Center for Education Statistics) - STATE ID-6052278 Small Quantity Generators, between 100 kg and 1000 kg of hazardous waste/month (Resource Conservation and Recovery Act (tracking hazardous waste)) Organizations: SONOMA VALLEY UNIFIED (SCHOOL DISTRICT)
CALTRANS DISTRICT 4/SCHELLVILLE MAINT ST (101 BONNEAU RD in SONOMA, CA) . Federal Facility
STATE MASTER (California - Hazardous Waste Tracking) - HAZARDOU WASTE PROGRAM Small Quantity Generators, between 100 kg and 1000 kg of hazardous waste/month (Resource Conservation and Recovery Act (tracking hazardous waste)) - notification Organizations: STATE OF CALIFORNIA (CONTACT/OWNER)
Alternative names: SCHELLVILLE MAINTENANCE STN
EQUILON ENTERPRISES LLC (616 BROADWAY in SONOMA, CA) . Federal Facility
STATE MASTER (California - Hazardous Waste Tracking) - HAZARDOU WASTE PROGRAM Small Quantity Generators, between 100 kg and 1000 kg of hazardous waste/month (Resource Conservation and Recovery Act (tracking hazardous waste)) - notification Organizations: EQUILON ENTERPRISES, LLC (CONTACT/OWNER)
Alternative names: SHELL OIL CO
CHEVRON STATION NO 98849 (540 W NAPA ST in SONOMA, CA)
STATE MASTER (California - Hazardous Waste Tracking) - HAZARDOU WASTE PROGRAM Small Quantity Generators, between 100 kg and 1000 kg of hazardous waste/month (Resource Conservation and Recovery Act (tracking hazardous waste)) - notification Organizations: CHEVRON PRODUCTS CO (CONTACT/OWNER)
ADELE HARRISON MIDDLE (1150 BROADWAY in SONOMA, CA)
(National Center for Education Statistics) - STATE ID-6119069 Organizations: SONOMA VALLEY UNIFIED (SCHOOL DISTRICT)
GATEWAY HIGH (17878 RAILROAD AVENUE in SONOMA, CA)
(National Center for Education Statistics) - STATE ID-4930293 Organizations: SONOMA VALLEY UNIFIED (SCHOOL DISTRICT)
GATEWAY MIDDEL SCHOOL (17866 RAILROAD AVE in SONOMA, CA)
(National Center for Education Statistics) - STATE ID-6117832 Organizations: SONOMA VALLEY UNIFIED (SCHOOL DISTRICT)
GEOTHERMAL WETLAND SITE (APPROX 1,100 ACRES IN N SONOMA & S MENDOCINO CNTY in SONOMA, CA)
(Integrated Compliance Information System) - ICIS-09-1997-0129, FORMAL ENFORCEMENT ACTION CRITERIA AND HAZARDOUS AIR POLLUTANT INVENTORY (Inventory of air pollution sources) Business SIC classification: ELECTRIC SERVICES
FUEL OIL POLISHING CO BAY AREA (1222 GROVE ST in SONOMA, CA)
Small Quantity Generators, between 100 kg and 1000 kg of hazardous waste/month (Resource Conservation and Recovery Act (tracking hazardous waste)) - notification TRANSPORTER (Resource Conservation and Recovery Act (tracking hazardous waste)) - notification Organizations: RAMSEY B SUE & THOMAS (CONTACT/OWNER)
CALIFORNIA NORTHERN RAILROAD (CFNR STATION OF SCHELLVILLE in SONOMA, CA)
(Resource Conservation and Recovery Act (tracking hazardous waste))
CALTRANS DIST 4 (HWY 12 KP56 TO 59 BOYES BLVD T in SONOMA, CA)
Large Quantity Generators, more that 1000 kg of hazardous waste/month (Resource Conservation and Recovery Act (tracking hazardous waste)) - notification
Housing units lacking complete plumbing facilities: 1.1% Housing units lacking complete kitchen facilities: 2.2%
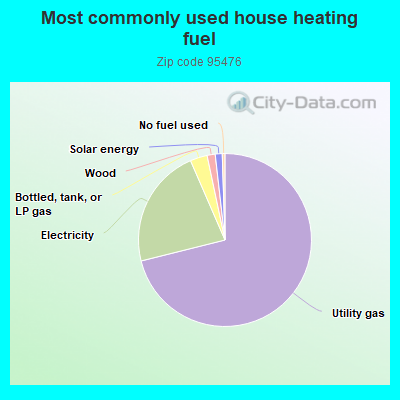
70.9%Utility gas
22.3%Electricity
3.2%Bottled, tank, or LP gas
1.5%Wood
1.3%Solar energy
0.5%No fuel used
Population in 1990: 30,443. Population change in the 1990s: +3,867 (+12.7%).
Place of birth for U.S.-born residents:
This state: 21,227
Northeast: 2,460
Midwest: 2,771
South: 1,838
West: 960
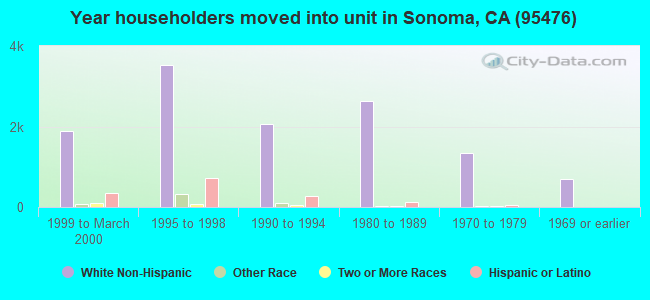
57% of the 95476 zip code residents lived in the same house 5 years ago. Out of people who lived in different houses, 58% lived in this county. Out of people who lived in different counties, 50% lived in California.
89% of the 95476 zip code residents lived in the same house 1 year ago. Out of people who lived in different houses, 37% moved from this county. Out of people who lived in different houses, 50% moved from different county within same state. Out of people who lived in different houses, 12% moved from different state. Out of people who lived in different houses, 2% moved from abroad.
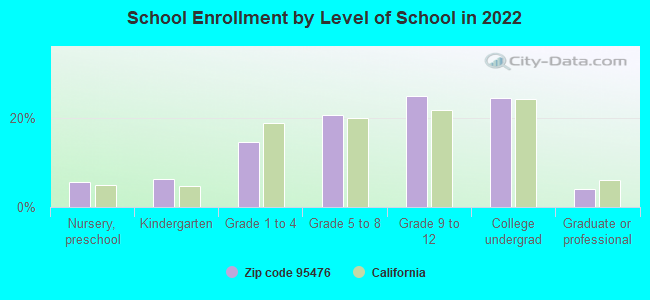
Private vs. public school enrollment:
Students in private schools in grades 1 to 8 (elementary and middle school): 237
Here:
11.7%
California:
10.5%
Students in private schools in grades 9 to 12 (high school): 163
Here:
11.4%
California:
8.5%
Students in private undergraduate colleges: 178
Here:
12.6%
California:
15.9%
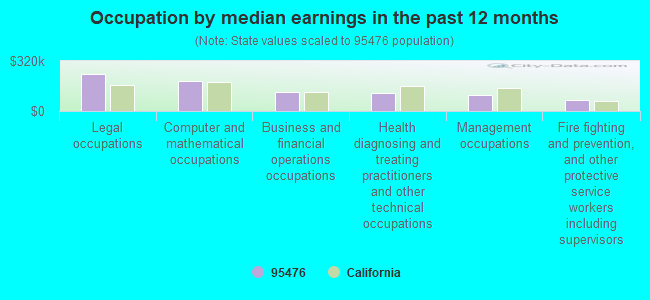
Occupation by median earnings in the past 12 months ($)
237,352Legal occupations
191,600Computer and mathematical occupations
121,983Business and financial operations occupations
113,013Health diagnosing and treating practitioners and other technical occupations
105,569Management occupations
71,687Fire fighting and prevention, and other protective service workers including supervisors
Companies with federal contracts located in this zip code (SONOMA, CA):
TACTICAL EQUIPMENT & APPAREL, (804 PRINCETON DR; small business) : $4,934,638 in 2 contractsin 2005
$4,934,655 with Army for Clothing, Special Purpose. Signed on 2005-06-30. Completion date: 2005-12-30.
-$17, same as above.Signed on 2005-09-16. Completion date: 2005-12-30.
FRONTIER CONTRACTING, INC. (22770 BURNDALE ROAD; small business) : $3,703,301 in 4 contractsin 2000
$2,400,000 with U.S. Army Corps of Engineers - civil program financing only for Construction of Structures and Facilities -- Other Conservation and Development Facilities. Signed on 2000-09-14. Completion date: 2000-09-14.
$1,187,827, same as above.Signed on 2000-09-18. Completion date: 2000-09-18.
$83,380, same as above.Signed on 2000-09-18. Completion date: 2000-09-18.
$32,094, same as above.Signed on 2000-09-18. Completion date: 2000-09-18.
MELLINGER ENGINEERING GROUP LL (1759 DENMARK STREET; small business) : $2,107,791 in 19 contractsfrom 2002 to 2006
Contracts for Valves, Nonpowered, Valves, Powered by NASA, Air Force, Navy Signed by year:2000: $0; 2001: $0; 2002: $1,459,540; 2003: $0; 2004: $142,765; 2005: $290,574; 2006: $214,912.
Biggest contracts:
$763,000 with NASA for Valves, Nonpowered. Signed on 2002-01-15. Completion date: 2002-06-15.
$435,590 with Air Force for Valves, Powered. Signed on 2002-11-14. Completion date: 2003-08-21.
$161,660 with Navy for Valves, Nonpowered. Taking place in OH. Signed on 2005-05-13. Completion date: 2006-05-15.
$154,000 with NASA for Valves, Nonpowered. Signed on 2002-03-15. Completion date: 2002-07-15.
MIKE BOBBITT (1182 LARKIN DRIVE; small business) : $100,000 in 2 contractsin 2003
$60,000 with Army for Engineering and Technical Services. Signed on 2003-08-27. Completion date: 2003-12-31.
$40,000, same as above.Signed on 2003-08-27. Completion date: 2003-12-31.
BRIDGEWORKS LLC (19201 7TH ST E; small business)
$33,500 with Air Force for Lectures For Training. Taking place in OK. Signed on 2003-03-24. Completion date: 2003-03-27.
JIM SCHRATZ & ASSOCIATES (4964 GROVE STREET; small business)
$31,000 with Offices, Boards and Divisions (includes Attorney General, Deputy Attorney General, etc.) for Expert Witness. Signed on 2005-04-01. Completion date: 2005-09-30.
MORLER INTERNATIONAL, INC (1140 BROCKMAN DR; small business)
$9,800 with Navy for Other Professional Services. Taking place in VA. Signed on 2004-01-27. Completion date: 2004-02-13.
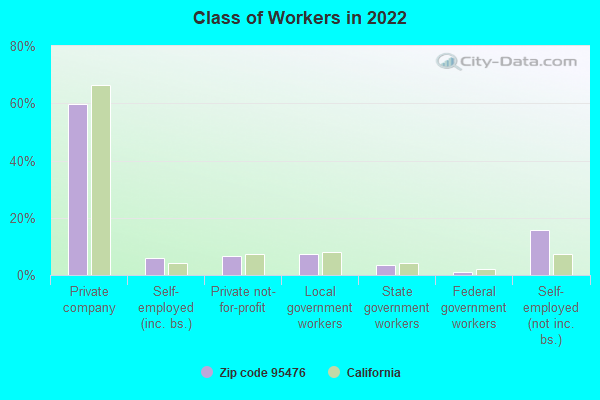
Top industries in this zip code by the number of employees in 2005:
Administrative and Support and Waste Management and Remediation Services: Temporary Help Services (over 1000 employees: 2 establishments, 20-49 employees: 1 establishment, 10-19 employees: 1 establishment)
2005 - 2018 National Fire Incident Reporting System (NFIRS) incidents
According to the data from the years 2005 - 2018 the average number of fires per year is 78. The highest number of reported fire incidents - 143 took place in 2017, and the least - 29 in 2012. The data has an increasing trend.
When looking into fire subcategories, the most incidents belonged to: Outside Fires (53.5%), and Structure Fires (27.8%).
Fire incident types reported to NFIRS in Zip Code 95476
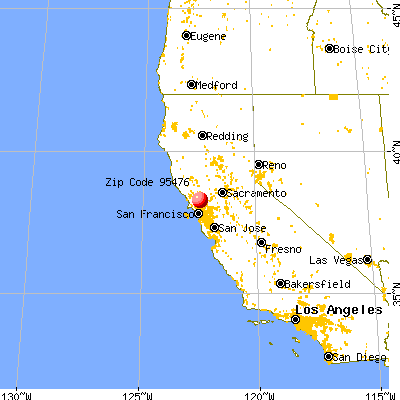


 Nearest zip codes: 94954, 95431, 95442, 94945, 94559, 95452.
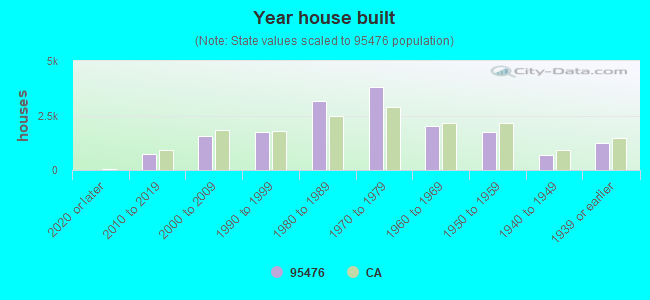


 According to the data from the years 2005 - 2018 the average number of fires per year is 78. The highest number of reported fire incidents - 143 took place in 2017, and the least - 29 in 2012. The data has an increasing trend.
 When looking into fire subcategories, the most incidents belonged to: Outside Fires (53.5%), and Structure Fires (27.8%).