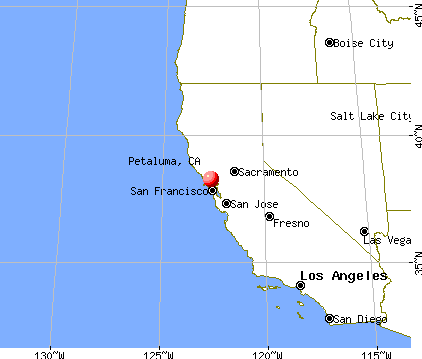
Petaluma, California
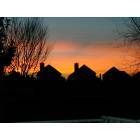
Petaluma: Petaluma Sunrise
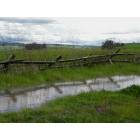
Petaluma: Browns Lane

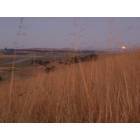
Petaluma: Old Redwood Highway Sunrise
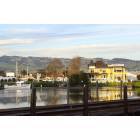
Petaluma: Petaluma
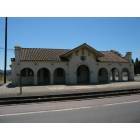
Petaluma: old train depot
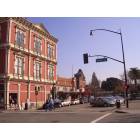
Petaluma: Corner of Western & Kentucky in Petaluma, CA.
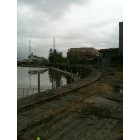
Petaluma: Petaluma River Edge by tracks

Petaluma: Honey Bee foraging for pollen on Petaluma's Official Flower!
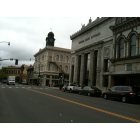
Petaluma: Vintage Bank Antiques and Building with Clock
Petaluma: Summer Solstice Moonrise over Petaluma Valley
Petaluma: Summer Solstice Moonrise over Petaluma Valley
Petaluma: Petaluma River, Turning Basin
- add
your
Submit your own pictures of this city and show them to the world
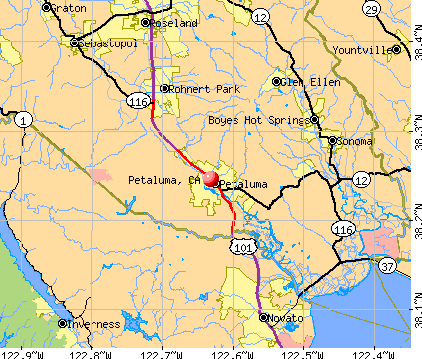
- OSM Map
- General Map
- Google Map
- MSN Map
Population change since 2000: +7.5%
 |
| Males: 29,099 | |
| Females: 29,553 |
| Median resident age: | 44.0 years |
| California median age: | 37.9 years |
Zip codes: 94952.
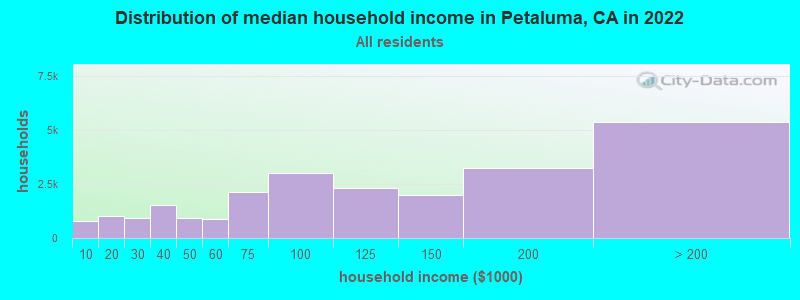
| Petaluma: | $105,864 |
| CA: | $91,551 |
Estimated per capita income in 2022: $57,359 (it was $27,087 in 2000)
Petaluma city income, earnings, and wages data
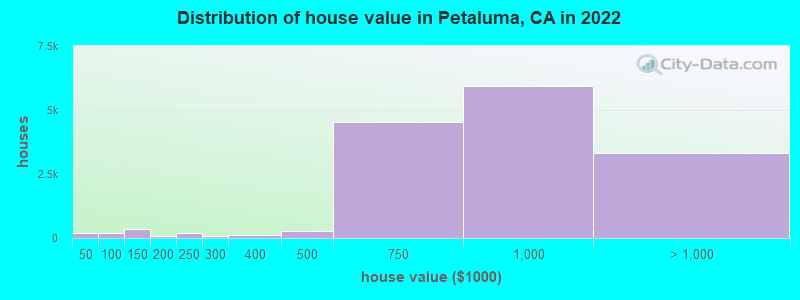
Estimated median house or condo value in 2022: $830,022 (it was $282,800 in 2000)
| Petaluma: | $830,022 |
| CA: | $715,900 |
Mean prices in 2022: all housing units: $908,303; detached houses: $977,748; townhouses or other attached units: $706,009; in 2-unit structures: $633,189; in 3-to-4-unit structures: $617,637; in 5-or-more-unit structures: $815,349; mobile homes: $175,796
Median gross rent in 2022: $2,237.
(5.7% for White Non-Hispanic residents, 4.1% for Black residents, 6.7% for Hispanic or Latino residents, 21.8% for American Indian residents, 6.0% for Native Hawaiian and other Pacific Islander residents, 7.7% for other race residents, 7.9% for two or more races residents)
Detailed information about poverty and poor residents in Petaluma, CA


Compare current foreclosures near Petaluma, CA:
| Photo | Address | Area | Beds / Baths | Price | Details |
|---|---|---|---|---|---|

|
#1
Petaluma Blvd S Apt 28
Petaluma, CA 94952
|
565 sq. feet
|
1 baths 1 beds |
$369,900
|
show details |

|
#2
Hash Ct
Petaluma, CA 94952
|
2,274 sq. feet
|
3 baths 4 beds |
show details | |

|
#3
Jewett Rd
Petaluma, CA 94952
|
1,600 sq. feet
|
2 baths 4 beds |
show details | |

|
#4
Glen Eagle Dr
Petaluma, CA 94952
|
6,762 sq. feet
|
3 baths 3 beds |
show details | |

|
#5
Lavender Ter
Petaluma, CA 94952
|
2,618 sq. feet
|
3 baths 5 beds |
show details | |

|
#6
Nottingham Ct
Petaluma, CA 94954
|
2,815 sq. feet
|
4 baths 4 beds |
show details | |

|
#7
Newcastle Ct
Petaluma, CA 94954
|
1,872 sq. feet
|
3 baths 4 beds |
show details | |

|
#8
Del Oro Cir
Petaluma, CA 94954
|
1,388 sq. feet
|
2 baths 3 beds |
show details | |

|
#9
Andover Way
Petaluma, CA 94954
|
2,538 sq. feet
|
4 baths 5 beds |
show details | |

|
#10
Prospect St
Petaluma, CA 94952
|
- sq. feet
|
- baths - beds |
show details |
| Photo | Address | Area | Beds / Baths | Price | Details |
|---|---|---|---|---|---|

|
#11
Dynamic St
Petaluma, CA 94954
|
- sq. feet
|
- baths - beds |
show details | |

|
#12
Commerce St Ste D
Petaluma, CA 94954
|
- sq. feet
|
- baths - beds |
show details | |

|
#13
1st St Apt 331
Petaluma, CA 94952
|
- sq. feet
|
- baths - beds |
show details | |

|
#14
Edith St
Petaluma, CA 94952
|
- sq. feet
|
- baths - beds |
show details | |

|
#15
Ruth Ct
Petaluma, CA 94952
|
- sq. feet
|
- baths - beds |
show details | |

|
#16
Mcconnell Ave
Santa Rosa, CA 95404
|
1,216 sq. feet
|
2 baths 4 beds |
show details | |

|
#17
Melvin Ave
Sonoma, CA 95476
|
1,417 sq. feet
|
2 baths 3 beds |
show details | |

|
#18
Highway 12
Sonoma, CA 95476
|
1,170 sq. feet
|
2 baths 3 beds |
show details | |

|
#19
Corby Ave
Santa Rosa, CA 95407
|
836 sq. feet
|
1 baths 2 beds |
show details | |

|
#20
Malibu Cir
Santa Rosa, CA 95401
|
1,300 sq. feet
|
3 baths 3 beds |
show details |
| Photo | Address | Area | Beds / Baths | Price | Details |
|---|---|---|---|---|---|

|
#21
Ridgway Ave
Santa Rosa, CA 95401
|
1,603 sq. feet
|
2 baths 3 beds |
show details | |

|
#22
Meadowbrook Ct
Cotati, CA 94931
|
1,733 sq. feet
|
2 baths 2 beds |
show details | |

|
#23
Panorama Dr
Santa Rosa, CA 95404
|
2,763 sq. feet
|
3 baths 3 beds |
show details | |

|
#24
Ivy Lane
Woodacre, CA 94973
|
2,251 sq. feet
|
2 baths 3 beds |
show details | |

|
#25
Montecito Ave
Santa Rosa, CA 95404
|
1,537 sq. feet
|
2 baths 2 beds |
show details | |

|
#26
Sunny Cove Dr
Novato, CA 94949
|
2,568 sq. feet
|
2 baths 4 beds |
show details | |

|
#27
Enterprise Rd
Glen Ellen, CA 95442
|
1,220 sq. feet
|
3 baths 3 beds |
show details | |

|
#28
Mill Station Rd
Sebastopol, CA 95472
|
2,992 sq. feet
|
2 baths 4 beds |
show details | |

|
#29
Harris Hill Dr
Novato, CA 94947
|
2,773 sq. feet
|
3 baths 4 beds |
show details | |

|
#30
Carson St
Santa Rosa, CA 95403
|
1,408 sq. feet
|
2 baths 3 beds |
show details |
| Photo | Address | Area | Beds / Baths | Price | Details |
|---|---|---|---|---|---|

|
#31
Orange Blossom Ln
San Rafael, CA 94903
|
1,892 sq. feet
|
2 baths 3 beds |
show details | |

|
#32
Townview Ave
Santa Rosa, CA 95405
|
2,433 sq. feet
|
3 baths 3 beds |
show details | |

|
#33
S Wright Rd
Santa Rosa, CA 95407
|
1,274 sq. feet
|
1 baths 3 beds |
show details | |

|
#34
De Meo St
Santa Rosa, CA 95407
|
1,901 sq. feet
|
3 baths 4 beds |
show details | |

|
#35
Tarton Dr
Santa Rosa, CA 95405
|
2,145 sq. feet
|
3 baths 4 beds |
show details | |

|
#36
Brookshire Cir
Santa Rosa, CA 95405
|
1,558 sq. feet
|
2 baths 4 beds |
show details | |

|
#37
Rose Meadow Ct
Santa Rosa, CA 95407
|
1,262 sq. feet
|
2 baths 3 beds |
show details | |

|
#38
W Hearn Ave
Santa Rosa, CA 95407
|
1,050 sq. feet
|
2 baths 3 beds |
show details | |

|
#39
Tokay St
Santa Rosa, CA 95404
|
1,569 sq. feet
|
3 baths 4 beds |
show details | |

|
#40
Leo Dr
Santa Rosa, CA 95407
|
1,873 sq. feet
|
2 baths 3 beds |
show details |
| Photo | Address | Area | Beds / Baths | Price | Details |
|---|---|---|---|---|---|

|
#41
Debbie Dr
Santa Rosa, CA 95407
|
1,077 sq. feet
|
2 baths 3 beds |
show details | |

|
#42
Ludwig Ave
Santa Rosa, CA 95407
|
1,062 sq. feet
|
1 baths 2 beds |
show details | |

|
#43
Santa Barbara Dr
Santa Rosa, CA 95404
|
877 sq. feet
|
1 baths 2 beds |
show details | |

|
#44
Ashwood Dr
Santa Rosa, CA 95407
|
1,287 sq. feet
|
1 baths 4 beds |
show details | |

|
#45
Shade Tree Ln
Santa Rosa, CA 95405
|
1,681 sq. feet
|
2 baths 2 beds |
show details | |

|
#46
Cactus Ave
Santa Rosa, CA 95405
|
1,505 sq. feet
|
2 baths 3 beds |
show details | |

|
#47
Manchester Ct
Novato, CA 94947
|
1,344 sq. feet
|
1 baths 3 beds |
show details | |

|
#48
Manzanita Ave
Novato, CA 94945
|
2,000 sq. feet
|
1 baths 1 beds |
show details | |

|
#49
Rowland Blvd
Novato, CA 94947
|
3,732 sq. feet
|
3 baths 4 beds |
show details | |

|
Check over 1 million property listings on Foreclosure.com!
|
browse all offers | |||


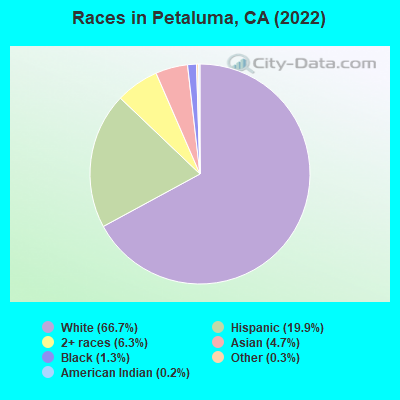
- 39,33166.7%White alone
- 11,75619.9%Hispanic
- 3,7326.3%Two or more races
- 2,7824.7%Asian alone
- 7941.3%Black alone
- 1810.3%Other race alone
- 1200.2%American Indian alone
- 400.07%Native Hawaiian and Other
Pacific Islander alone
According to our research of California and other state lists, there were 45 registered sex offenders living in Petaluma, California as of April 27, 2024.
The ratio of all residents to sex offenders in Petaluma is 1,342 to 1.
The ratio of registered sex offenders to all residents in this city is lower than the state average.
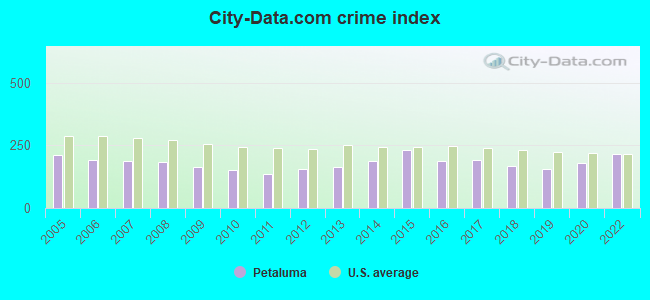
The City-Data.com crime index weighs serious crimes and violent crimes more heavily. Higher means more crime, U.S. average is 246.1. It adjusts for the number of visitors and daily workers commuting into cities.
- means the value is smaller than the state average.- means the value is about the same as the state average.
- means the value is bigger than the state average.
Crime rate in Petaluma detailed stats: murders, rapes, robberies, assaults, burglaries, thefts, arson
Full-time law enforcement employees in 2021, including police officers: 101 (65 officers - 59 male; 6 female).
| Officers per 1,000 residents here: | 1.07 |
| California average: | 2.30 |
 Recent articles from our blog. Our writers, many of them Ph.D. graduates or candidates, create easy-to-read articles on a wide variety of topics.

 | Petaluma City bans new gasoline stations (16 replies) |
| Petaluma Airport- how busy is it? (5 replies) |
| Move to Petaluma or Walnut Creek? Will commute 1–4x/month to Lake Merced in SF. (23 replies) |
| Petaluma - demographics (30 replies) |
| Good School district near Petaluma (8 replies) |
| Petaluma is pretty nice (2 replies) |
Latest news from Petaluma, CA collected exclusively by city-data.com from local newspapers, TV, and radio stations
Ancestries: Italian (9.1%), German (8.0%), Irish (7.8%), European (6.4%), English (4.7%), American (2.7%).
Current Local Time: PST time zone
Elevation: 12 feet
Land area: 13.8 square miles.
Population density: 4,250 people per square mile (average).
8,430 residents are foreign born (7.7% Latin America, 3.1% Asia, 2.3% Europe).
| This city: | 14.3% |
| California: | 26.5% |
Median real estate property taxes paid for housing units with mortgages in 2022: $5,879 (0.7%)
Median real estate property taxes paid for housing units with no mortgage in 2022: $3,987 (0.5%)
Nearest city with pop. 200,000+: West Contra Costa, CA (26.3 miles  , pop. 236,008).
Nearest city with pop. 1,000,000+: Los Angeles, CA (373.1 miles , pop. 3,694,820).
Nearest cities:
), ), ), ), ), Latitude: 38.25 N, Longitude: 122.63 W
Daytime population change due to commuting: +2,026 (+3.4%)
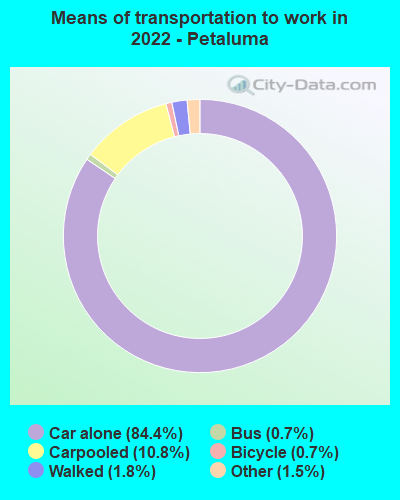
Workers who live and work in this city: 14,221 (47.5%)
Property values in Petaluma, CA
Petaluma tourist attractions:
Petaluma, California accommodation & food services, waste management - Economy and Business Data
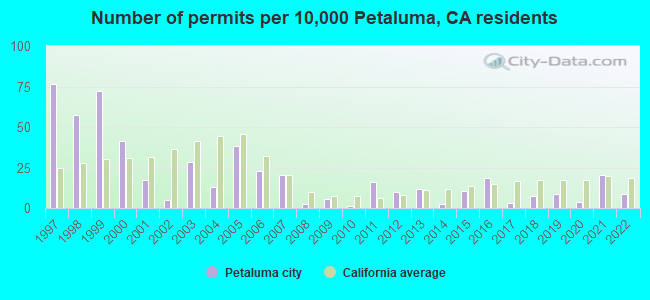
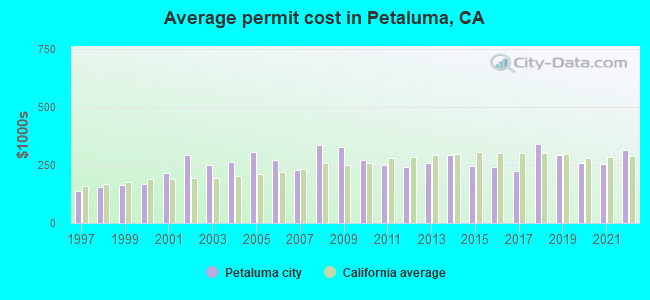
Single-family new house construction building permits:
- 2022: 46 buildings, average cost: $313,800
- 2021: 111 buildings, average cost: $255,100
- 2020: 21 buildings, average cost: $259,300
- 2019: 47 buildings, average cost: $290,600
- 2018: 39 buildings, average cost: $339,800
- 2017: 18 buildings, average cost: $223,300
- 2016: 102 buildings, average cost: $240,100
- 2015: 56 buildings, average cost: $246,300
- 2014: 15 buildings, average cost: $293,400
- 2013: 65 buildings, average cost: $257,600
- 2012: 53 buildings, average cost: $240,200
- 2011: 87 buildings, average cost: $248,300
- 2010: 7 buildings, average cost: $270,600
- 2009: 30 buildings, average cost: $326,000
- 2008: 13 buildings, average cost: $336,900
- 2007: 112 buildings, average cost: $226,800
- 2006: 124 buildings, average cost: $273,400
- 2005: 208 buildings, average cost: $307,200
- 2004: 71 buildings, average cost: $261,800
- 2003: 155 buildings, average cost: $251,500
- 2002: 26 buildings, average cost: $294,500
- 2001: 94 buildings, average cost: $214,300
- 2000: 225 buildings, average cost: $170,200
- 1999: 395 buildings, average cost: $165,300
- 1998: 314 buildings, average cost: $153,400
- 1997: 416 buildings, average cost: $137,700
| Here: | 3.7% |
| California: | 5.1% |
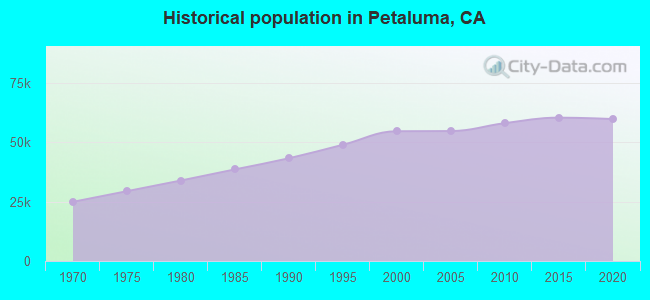
Population change in the 1990s: +10,353 (+23.4%).
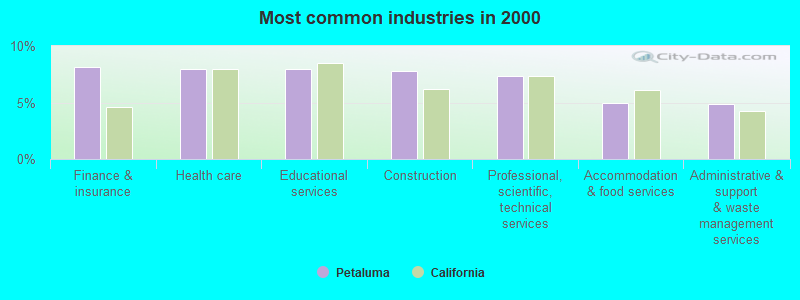
- Finance & insurance (8.2%)
- Health care (8.0%)
- Educational services (8.0%)
- Construction (7.8%)
- Professional, scientific, technical services (7.4%)
- Accommodation & food services (4.9%)
- Administrative & support & waste management services (4.9%)
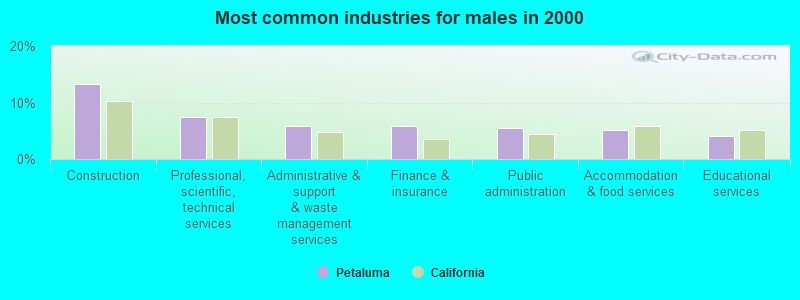
- Construction (13.3%)
- Professional, scientific, technical services (7.4%)
- Administrative & support & waste management services (5.9%)
- Finance & insurance (5.9%)
- Public administration (5.5%)
- Accommodation & food services (5.1%)
- Educational services (4.1%)
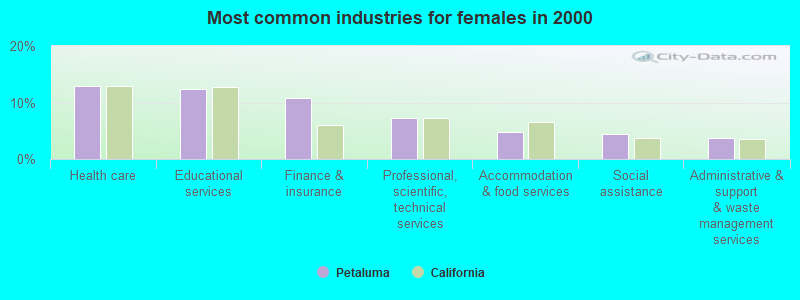
- Health care (13.0%)
- Educational services (12.3%)
- Finance & insurance (10.8%)
- Professional, scientific, technical services (7.3%)
- Accommodation & food services (4.7%)
- Social assistance (4.4%)
- Administrative & support & waste management services (3.7%)
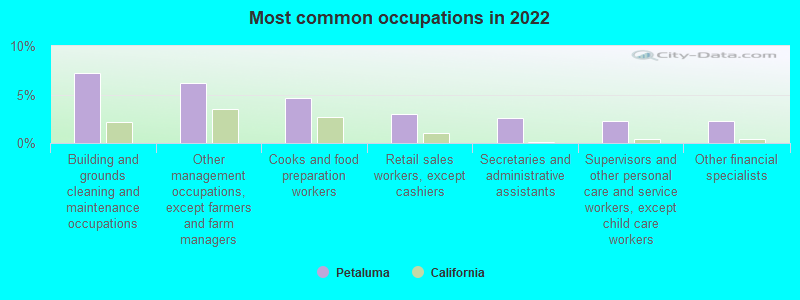
- Building and grounds cleaning and maintenance occupations (7.3%)
- Other management occupations, except farmers and farm managers (6.2%)
- Cooks and food preparation workers (4.6%)
- Retail sales workers, except cashiers (3.0%)
- Secretaries and administrative assistants (2.6%)
- Supervisors and other personal care and service workers, except child care workers (2.3%)
- Other financial specialists (2.2%)
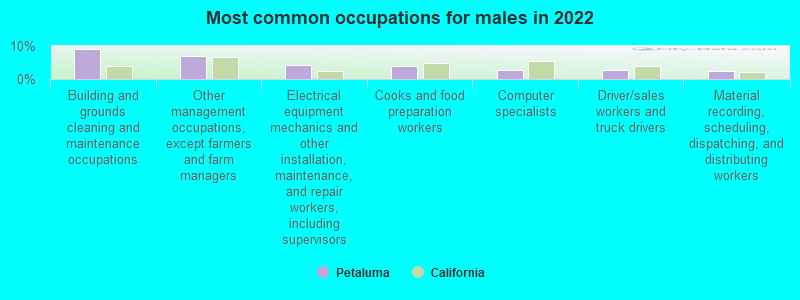
- Building and grounds cleaning and maintenance occupations (9.1%)
- Other management occupations, except farmers and farm managers (7.0%)
- Electrical equipment mechanics and other installation, maintenance, and repair workers, including supervisors (4.3%)
- Cooks and food preparation workers (3.9%)
- Computer specialists (2.8%)
- Driver/sales workers and truck drivers (2.6%)
- Material recording, scheduling, dispatching, and distributing workers (2.3%)
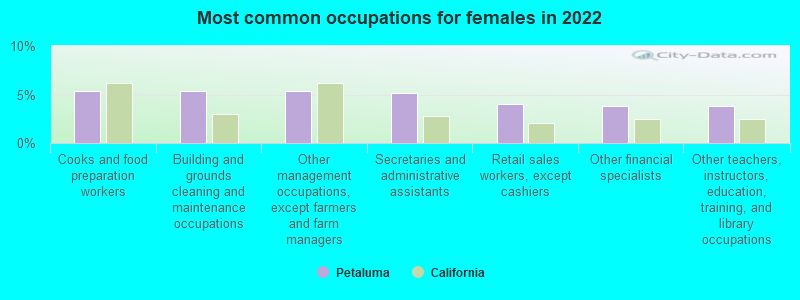
- Cooks and food preparation workers (5.4%)
- Building and grounds cleaning and maintenance occupations (5.4%)
- Other management occupations, except farmers and farm managers (5.3%)
- Secretaries and administrative assistants (5.2%)
- Retail sales workers, except cashiers (4.0%)
- Other financial specialists (3.9%)
- Other teachers, instructors, education, training, and library occupations (3.9%)
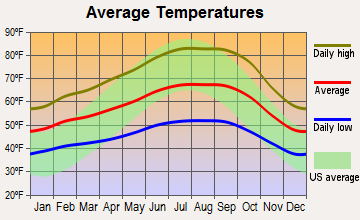
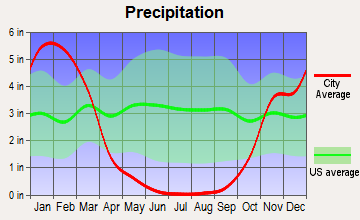
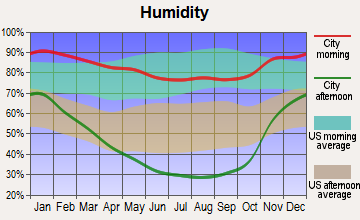
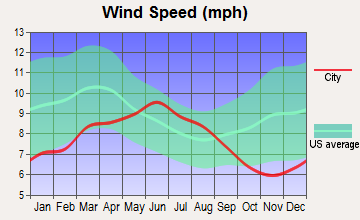
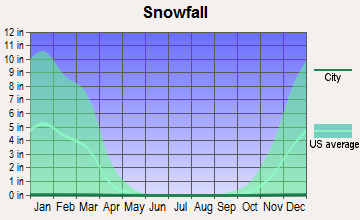
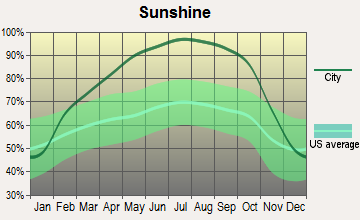
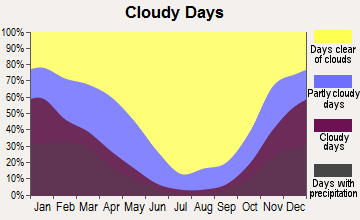
Average climate in Petaluma, California
Based on data reported by over 4,000 weather stations
|
|

(lower is better)
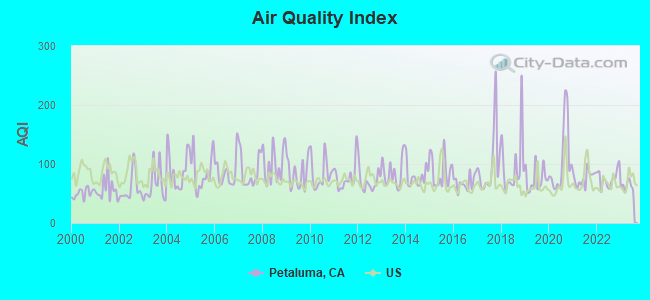
Air Quality Index (AQI) level in 2023 was 62.6. This is about average.
| City: | 62.6 |
| U.S.: | 72.6 |
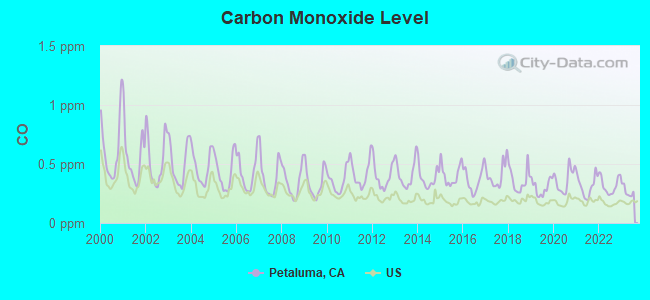
Carbon Monoxide (CO) [ppm] level in 2023 was 0.268. This is about average. Closest monitor was 1.2 miles away from the city center.
| City: | 0.268 |
| U.S.: | 0.251 |
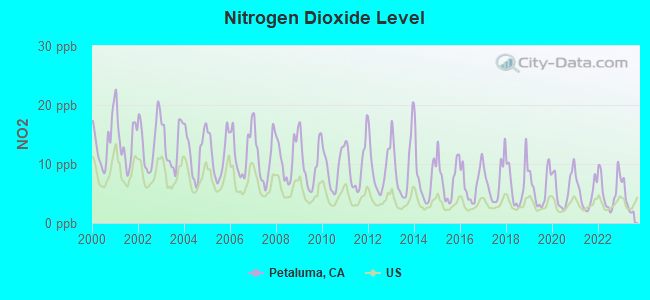
Nitrogen Dioxide (NO2) [ppb] level in 2023 was 3.95. This is better than average. Closest monitor was 1.2 miles away from the city center.
| City: | 3.95 |
| U.S.: | 5.11 |
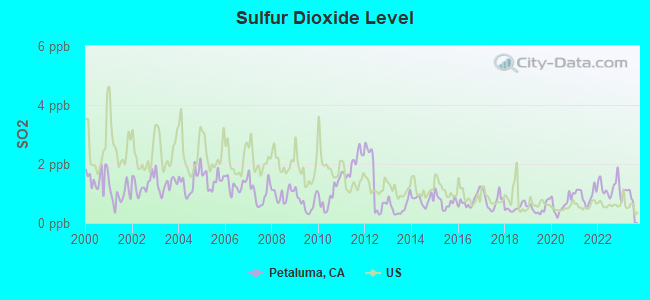
Sulfur Dioxide (SO2) [ppb] level in 2023 was 0.957. This is significantly better than average. Closest monitor was 14.3 miles away from the city center.
| City: | 0.957 |
| U.S.: | 1.515 |
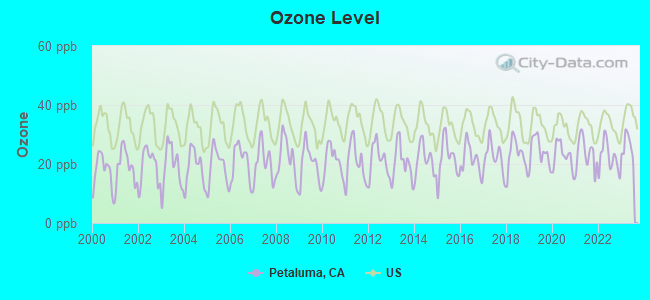
Ozone [ppb] level in 2023 was 26.0. This is better than average. Closest monitor was 4.0 miles away from the city center.
| City: | 26.0 |
| U.S.: | 33.3 |
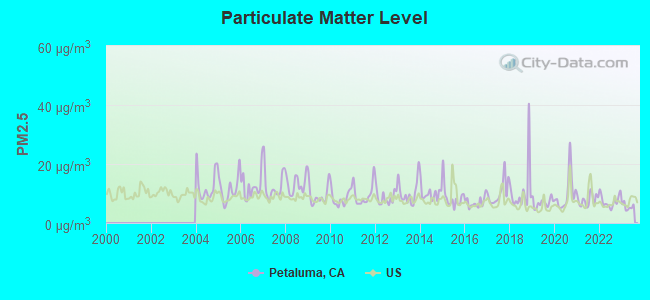
Particulate Matter (PM2.5) [µg/m3] level in 2023 was 5.56. This is significantly better than average. Closest monitor was 14.3 miles away from the city center.
| City: | 5.56 |
| U.S.: | 8.11 |
Earthquake activity:
Petaluma-area historical earthquake activity is significantly above California state average. It is 7374% greater than the overall U.S. average.On 4/18/1906 at 13:12:21, a magnitude 7.9 (7.9 UK, Class: Major, Intensity: VIII - XII) earthquake occurred 26.3 miles away from the city center, causing $524,000,000 total damage
On 10/18/1989 at 00:04:15, a magnitude 7.1 (6.5 MB, 7.1 MS, 6.9 MW, 7.0 ML) earthquake occurred 91.6 miles away from Petaluma center, causing 62 deaths (62 shaking deaths) and 3757 injuries, causing $1,305,032,704 total damage
On 1/31/1922 at 13:17:28, a magnitude 7.6 (7.6 UK) earthquake occurred 230.5 miles away from Petaluma center
On 4/25/1992 at 18:06:04, a magnitude 7.2 (6.3 MB, 7.1 MS, 7.2 MW, 7.1 MW, Depth: 9.4 mi) earthquake occurred 164.6 miles away from the city center, causing $75,000,000 total damage
On 11/4/1927 at 13:51:53, a magnitude 7.5 (7.5 UK) earthquake occurred 246.9 miles away from Petaluma center
On 7/21/1952 at 11:52:14, a magnitude 7.7 (7.7 UK) earthquake occurred 301.7 miles away from the city center, causing $50,000,000 total damage
Magnitude types: body-wave magnitude (MB), local magnitude (ML), surface-wave magnitude (MS), moment magnitude (MW)
Natural disasters:
The number of natural disasters in Sonoma County (23) is greater than the US average (15).Major Disasters (Presidential) Declared: 13
Emergencies Declared: 2
Causes of natural disasters: Floods: 15, Storms: 8, Winter Storms: 7, Landslides: 6, Mudslides: 6, Fires: 4, Drought: 1, Freeze: 1, Heavy Rain: 1, Hurricane: 1, Tornado: 1, Other: 1 (Note: some incidents may be assigned to more than one category).
Main business address for: REGAN HOLDING CORP (LIFE INSURANCE), SPECTRUM ORGANIC PRODUCTS INC (CANNED, FRUITS, VEG & PRESERVES, JAMS & JELLIES), ADVANCED FIBRE COMMUNICATIONS INC (TELEPHONE & TELEGRAPH APPARATUS), TEGAL CORP /DE/ (SPECIAL INDUSTRY MACHINERY, NEC).
Hospitals and medical centers in Petaluma:
- HOSPICE OF PETALUMA (416 PAYRAN STREET)
- PETALUMA VALLEY HOSPITAL (Voluntary non-profit - Other, 400 N MCDOWELL BLVD)
- VITAS HEALTHCARE CORPORATION OF CALIFORNIA (3700 LAKEVILLE HIGHWAY, SUITE 205)
- EMPRESS POST ACUTE REHABILITATION (300 DOUGLAS STREET)
- GOLDEN LIVINGCENTER - PETALUMA (101 MONROE STREET)
- OAKS, THE (450 HAYES LANE)
- PETALUMA POST-ACUTE REHABILITATION (1115 B STREET)
- WINDSOR CARE CENTER OF PETALUMA (523 HAYES LANE)
- FMC PETALUMA (715 SOUTH POINT BLVD., SUITE A)
Airports located in Petaluma:
- Petaluma Municipal Airport (O69) (Runways: 1, Air Taxi Ops: 200, Itinerant Ops: 12,000, Local Ops: 41,000)
Colleges/universities with over 2000 students nearest to Petaluma:
- Sonoma State University (about 7 miles; Rohnert Park, CA; Full-time enrollment: 7,796)
- Santa Rosa Junior College (about 16 miles; Santa Rosa, CA; FT enrollment: 13,047)
- Napa Valley College (about 20 miles; Napa, CA; FT enrollment: 3,780)
- College of Marin (about 21 miles; Kentfield, CA; FT enrollment: 4,489)
- Contra Costa College (about 25 miles; San Pablo, CA; FT enrollment: 4,249)
- Solano Community College (about 28 miles; Fairfield, CA; FT enrollment: 5,790)
- Berkeley City College (about 33 miles; Berkeley, CA; FT enrollment: 3,146)
Public high schools in Petaluma:
- CARPE DIEM HIGH (CONTINUATION) (Location: 199 FAIR ST., Grades: 9-12)
- SONOMA MOUNTAIN HIGH (CONTINUATION) (Location: 299 CASA GRANDE RD., Grades: 9-12)
- CASA GRANDE HIGH (Location: 333 CASA GRANDE RD., Grades: 9-12)
- PETALUMA HIGH (Location: 201 FAIR ST., Grades: 9-12)
- SAN ANTONIO HIGH (CONTINUATION) (Location: 500 VALLEJO ST., Grades: 9-12)
- VALLEY OAKS HIGH (ALTERNATIVE) (Location: 540 VALLEJO ST., Grades: 7-12)
- CROSSROADS (Location: 700 BANTAM WAY, Grades: 7-9)
- GATEWAY TO COLLEGE ACADEMY (Location: 680 SONOMA MOUNTAIN PKWY., Grades: 9-12, Charter school)
Private high school in Petaluma:
Biggest public elementary/middle schools in Petaluma:
- MEADOW ELEMENTARY (Students: 334, Location: 880 MARIA DR., Grades: KG-6)
- CORONA CREEK ELEMENTARY (Students: 314, Location: 1851 HARTMAN LN., Grades: KG-6)
- SONOMA MOUNTAIN ELEMENTARY (Students: 300, Location: 1900 RAINIER CIR., Grades: KG-6, Charter school)
- LA TERCERA ELEMENTARY (Students: 268, Location: 1600 ALBIN WAY, Grades: KG-6)
- OLD ADOBE ELEMENTARY CHARTER (Students: 182, Location: 2856 ADOBE RD., Grades: KG-6, Charter school)
- DUNHAM ELEMENTARY (Students: 120, Location: 4111 ROBLAR RD., Grades: 6)
- TWO ROCK ELEMENTARY (Students: 114, Location: 5001 SPRING HILL RD., Grades: KG-6)
- RIVER MONTESSORI ELEMENTARY CHARTER (Students: 68, Location: 3880 CYPRESS DR. STE. B, Grades: KG-6, Charter school)
- LAGUNA ELEMENTARY (Students: 20, Location: 2657 CHILENO VALLEY RD., Grades: KG-6)
- UNION ELEMENTARY (Students: 7, Location: 5300 RED HILL RD., Grades: KG-6)
Private elementary/middle schools in Petaluma:
Points of interest:
Notable locations in Petaluma: Petaluma Marina (A), Oakmead North-Bay Business Park (B), Marina Business Park (C), Lakeville Business Park (D), Cader Business Park (E), Sonoma-Marin Fairgrounds (F), Petaluma Yacht Club (G), Foundry Wharf Business Park (H), South Point Business Park (I), Redwood Business Park (J), Rancho Arroyo Business Park (K), Petaluma Industrial Park (L), North San Francisco Bay-McDowell Industrial Park (M), Prince Building (N), Phoenix Theater (O), Petaluma Historical Museum and Library (P), Mystic Theatre (Q), McNear Building (R), Herold Building (S), Five Corners Community Center (T). Display/hide their locations on the map
Shopping Centers: Washington Square Shopping Center (1), Plaza North Shopping Center (2), Petaluma Town Plaza Shopping Center (3), Petaluma Plaza Shopping Center (4), Great Petaluma Mill Shopping Center (5), Gateway Plaza Shopping Center (6), Town and Country Shopping Center (7), Golden Eagle Shopping Center (8), Petaluma Factory Outlets Shopping Center (9). Display/hide their locations on the map
Main business address in Petaluma include: REGAN HOLDING CORP (A), SPECTRUM ORGANIC PRODUCTS INC (B), ADVANCED FIBRE COMMUNICATIONS INC (C), TEGAL CORP /DE/ (D). Display/hide their locations on the map
Churches in Petaluma include: Saint Johns Episcopal Church (A), Evangelical Free Church (B), Calvary Life United Pentecostal Church (C), Congregational B'nai Israel (D), Elim Lutheran Church (E), First Assembly of God Church (F), First Christian Church (G), First Church of Christ Scientist (H), First Church of God (I). Display/hide their locations on the map
Creeks: Lynch Creek (A), Lichau Creek (B), Adobe Creek (C). Display/hide their locations on the map
Parks in Petaluma include: Lucchesi Park (1), Bond Park (2), Prince Park (3), Cherry Valley Park (4), Hill Plaza Park (5), Kenilworth Park (6), McNear Park (7), Oak Hill Park (8), Petaluma Swim Center (9). Display/hide their locations on the map
Tourist attractions: Amf Bowling Centers-Amf Boulevard Lanes (Amusement & Theme Parks; 1100 Petaluma Boulevard South) (1), Buckhorn (615 Petaluma Boulevard North) (2). Display/hide their approximate locations on the map
Hotels: A Metro Hotel & Cafe (508 Petaluma Boulevard South) (1), Best Western Petaluma Inn (200 South McDowell Boulevard) (2), Bed & Breakfast Online (PO Box Drawer D) (3), Boccabella ROBT A Business Design Services (47 Maria Drive Suite 815) (4). Display/hide their approximate locations on the map
Birthplace of: Christina Hoff Sommers - Writer, Pauline Kael - Writer, David M. Traversi - Non-fiction writer, Joe Enochs - Soccer player, Richard A. Penry - Army Medal of Honor recipient, Richard D. Hearney - Assistant Commandant of the Marine Corps, Scott Feil - Cannabis activist, Myron Healey - Actor, David Banks (comedian) - Film actor, Josh Akognon - College basketball player (Washington State Cougars).
Drinking water stations with addresses in Petaluma and their reported violations in the past:
LAKE SHASTA PINES RV PARK & CAMPGROUND (Population served: 215, Groundwater):Past monitoring violations:CSP-SUGARLOAF RIDGE STATE PARK (Population served: 200, Groundwater):
- 14 routine major monitoring violations
Past monitoring violations:PETALUMA LIVESTOCK AUCTION YARD (Address: 84 Corona Road , Population served: 100, Groundwater):
- One minor monitoring violation
Past monitoring violations:MARIN FRENCH CHEESE CO (Population served: 100, Surface water):
- Monitoring, Repeat Major (TCR) - In NOV-2007, Contaminant: Coliform (TCR). Follow-up actions: St AO (w/o penalty) issued (DEC-31-2007)
- One regular monitoring violation
Past monitoring violations:LOMBARDI'S DELI & BBQ (Population served: 85, Groundwater):
- One routine major monitoring violation
Past monitoring violations:VALLEY FORD HOTEL (Population served: 50, Groundwater):
- Monitoring, Repeat Major (TCR) - In JAN-2006, Contaminant: Coliform (TCR). Follow-up actions: St AO (w/o penalty) issued (FEB-24-2006)
- One routine major monitoring violation
- One regular monitoring violation
Past health violations:WESTSIDE STORAGE WATER SYSTEM (Population served: 50, Groundwater):
- MCL, Single Sample - Between APR-2014 and JUN-2014, Contaminant: Nitrate. Follow-up actions: St AO (w/o penalty) issued (JUN-09-2014)
Past monitoring violations:WILLOWBROOK ALE HOUSE (Population served: 50, Groundwater):
- One routine major monitoring violation
Past monitoring violations:
- One routine major monitoring violation
- One minor monitoring violation
- One regular monitoring violation
Drinking water stations with addresses in Petaluma that have no violations reported:
- HUNTER HILL REST AREA (Population served: 900, Primary Water Source Type: Groundwater)
- CSP-PETALUMA ADOBE STATE HISTORIC PARK (Population served: 114, Primary Water Source Type: Groundwater)
- CSP-JACK LONDON STATE HISTORIC PARK (Population served: 3, Primary Water Source Type: Groundwater)
| This city: | 2.6 people |
| California: | 2.9 people |
| This city: | 67.6% |
| Whole state: | 68.7% |
| This city: | 7.0% |
| Whole state: | 7.2% |
Likely homosexual households (counted as self-reported same-sex unmarried-partner households)
- Lesbian couples: 0.6% of all households
- Gay men: 0.3% of all households
People in group quarters in Petaluma in 2010:
- 363 people in nursing facilities/skilled-nursing facilities
- 144 people in emergency and transitional shelters (with sleeping facilities) for people experiencing homelessness
- 134 people in other noninstitutional facilities
- 41 people in residential treatment centers for adults
- 22 people in group homes intended for adults
- 20 people in workers' group living quarters and job corps centers
People in group quarters in Petaluma in 2000:
- 321 people in nursing homes
- 209 people in other noninstitutional group quarters
- 157 people in other group homes
- 37 people in other nonhousehold living situations
- 12 people in homes for the mentally retarded
- 4 people in religious group quarters
Banks with most branches in Petaluma (2011 data):
- JPMorgan Chase Bank, National Association: Petaluma - Washington Square, Lakeville Highway Lucky Banking Cent, 101 Western Ave Branch. Info updated 2011/11/10: Bank assets: $1,811,678.0 mil, Deposits: $1,190,738.0 mil, headquarters in Columbus, OH, positive income, International Specialization, 5577 total offices, Holding Company: Jpmorgan Chase & Co.
- Bank of Marin: Petaluma Branch, North Petaluma Branch, Downtown Petaluma Branch. Info updated 2011/02/22: Bank assets: $1,393.3 mil, Deposits: $1,206.0 mil, headquarters in Novato, CA, positive income, Commercial Lending Specialization, 18 total offices, Holding Company: Bank Of Marin Bancorp
- Wells Fargo Bank, National Association: Petaluma Valley Branch, Petaluma Branch, Petaluma-Washington Square Branch. Info updated 2011/04/05: Bank assets: $1,161,490.0 mil, Deposits: $905,653.0 mil, headquarters in Sioux Falls, SD, positive income, 6395 total offices, Holding Company: Wells Fargo & Company
- First Community Bank: Petaluma Branch at 100 Second Street, branch established on 2005/06/13; East Petaluma Branch at 157 N Mcdowell Blvd, branch established on 2009/04/22. Info updated 2009/05/26: Bank assets: $675.7 mil, Deposits: $553.9 mil, headquarters in Santa Rosa, CA, negative income in the last year, Commercial Lending Specialization, 8 total offices, Holding Company: First Community Holdings
- Exchange Bank: Golden Eagle Branch at 2 East Washington Street, branch established on 1973/06/25; Parkway Plaza Branch at 701 Sonoma Mountain Parkway, Suite D-2, branch established on 2002/07/01. Info updated 2010/02/16: Bank assets: $1,575.4 mil, Deposits: $1,350.9 mil, headquarters in Santa Rosa, CA, positive income, Commercial Lending Specialization, 21 total offices, Holding Company: Frank P. Doyle Trust, Article Ix
- Bank of the West: Petaluma Plaza Branch at 311 North Mcdowell Boulevard, branch established on 1965/05/10; Petaluma Main Branch at 20 Petaluma Boulevard South, branch established on 1965/05/10. Info updated 2009/11/16: Bank assets: $62,408.3 mil, Deposits: $43,995.2 mil, headquarters in San Francisco, CA, positive income, 647 total offices, Holding Company: Bnp Paribas
- Bank of America, National Association: East Petaluma Branch at 181 North Mcdowell Boulevard, branch established on 2005/05/23; Petaluma Branch at 200 Kentucky Street, branch established on 1923/01/29. Info updated 2009/11/18: Bank assets: $1,451,969.3 mil, Deposits: $1,077,176.8 mil, headquarters in Charlotte, NC, positive income, 5782 total offices, Holding Company: Bank Of America Corporation
- Sterling Savings Bank: East Petaluma Branch at 701-B Sonoma Mountain Parkway, branch established on 2000/11/16; West Petaluma Branch at 201 Western Avenue, branch established on 2005/05/09. Info updated 2012/03/21: Bank assets: $9,207.8 mil, Deposits: $6,454.1 mil, headquarters in Spokane, WA, positive income, Commercial Lending Specialization, 192 total offices, Holding Company: Sterling Financial Corporation
- Westamerica Bank: Petaluma Branch at 200 Washington Street, branch established on 1963/11/15; Washington Square Branch at 203 South Mcdowell Boulevard, branch established on 1974/04/22. Info updated 2011/06/21: Bank assets: $4,998.1 mil, Deposits: $4,253.2 mil, headquarters in San Rafael, CA, positive income, Commercial Lending Specialization, 98 total offices, Holding Company: Westamerica Bancorporation
- 4 other banks with 4 local branches
For population 15 years and over in Petaluma:
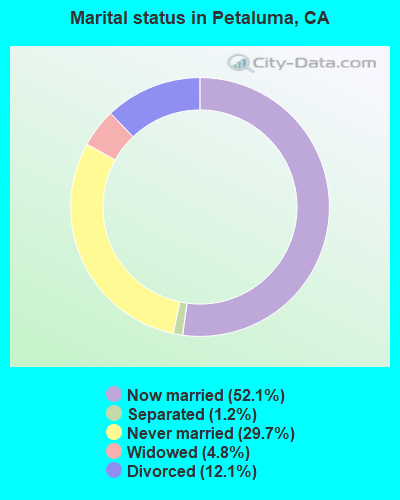
- Never married: 29.7%
- Now married: 52.1%
- Separated: 1.2%
- Widowed: 4.8%
- Divorced: 12.1%
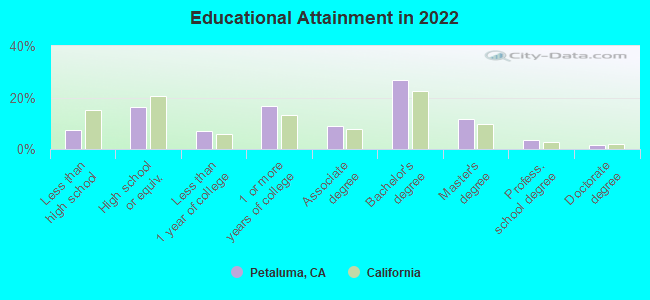
For population 25 years and over in Petaluma:
- High school or higher: 92.4%
- Bachelor's degree or higher: 43.0%
- Graduate or professional degree: 15.6%
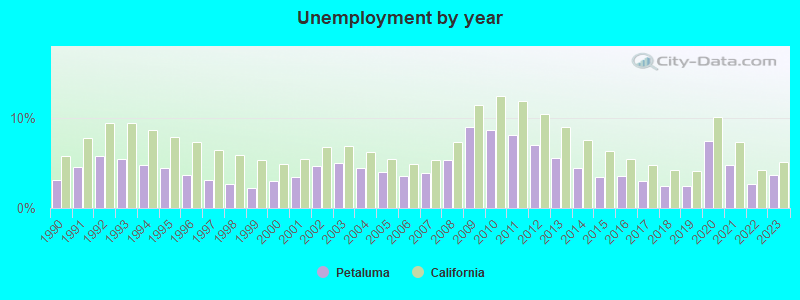
- Unemployed: 3.7%
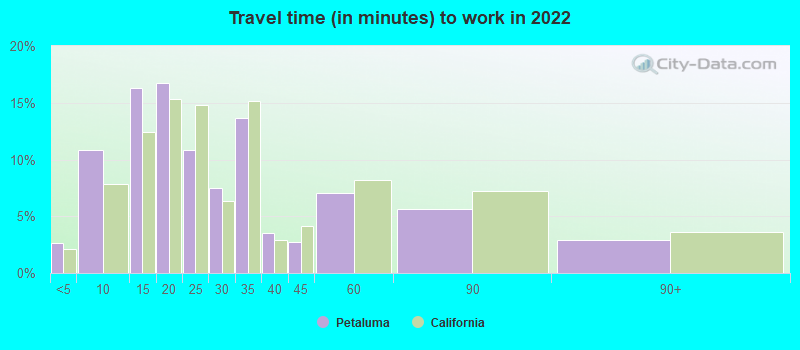
- Mean travel time to work (commute): 25.1 minutes
| Here: | 11.1 |
| California average: | 15.5 |
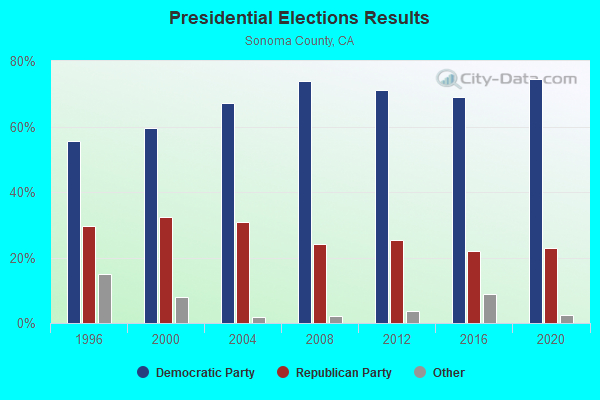

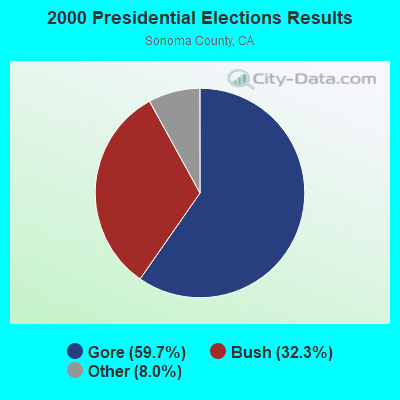
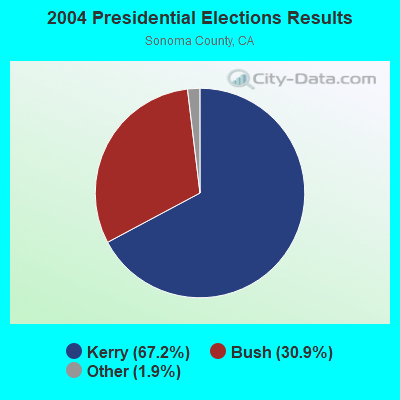

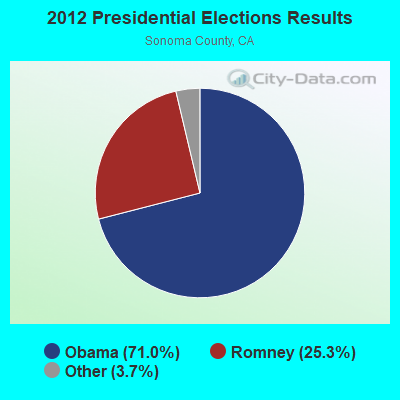
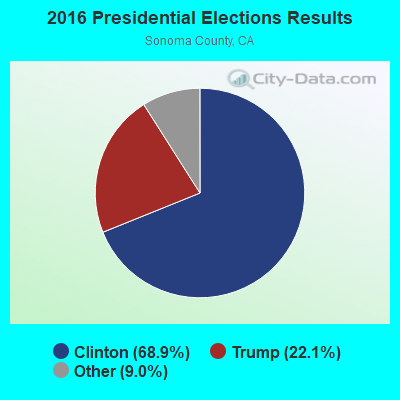
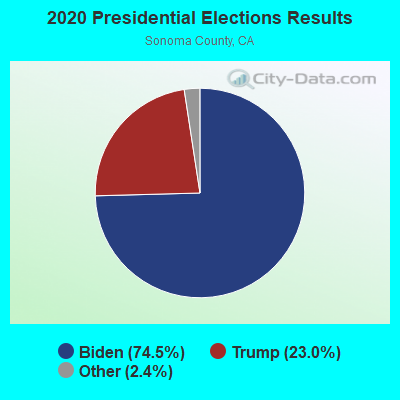
Graphs represent county-level data. Detailed 2008 Election Results
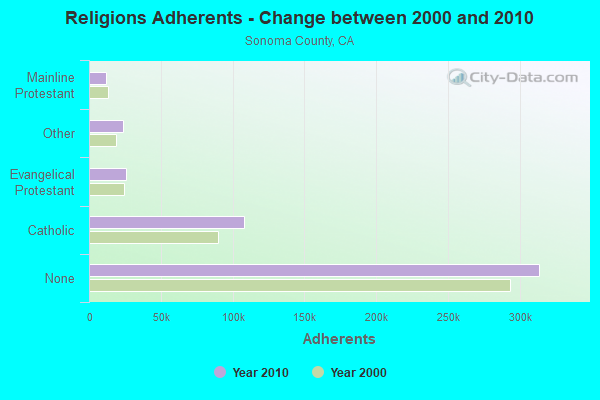
Religion statistics for Petaluma, CA (based on Sonoma County data)
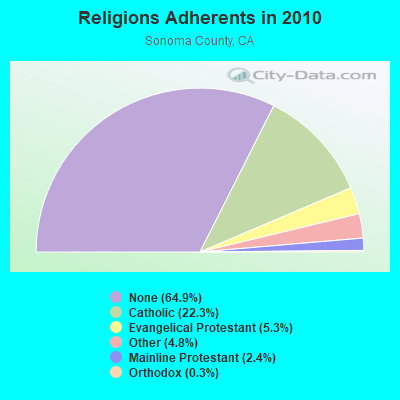
| Religion | Adherents | Congregations |
|---|---|---|
| Catholic | 107,737 | 23 |
| Evangelical Protestant | 25,820 | 159 |
| Other | 23,398 | 76 |
| Mainline Protestant | 11,546 | 49 |
| Orthodox | 1,389 | 7 |
| Black Protestant | 102 | 1 |
| None | 313,886 | - |
Food Environment Statistics:
| This county: | 2.81 / 10,000 pop. |
| California: | 2.14 / 10,000 pop. |
| Sonoma County: | 0.04 / 10,000 pop. |
| State: | 0.04 / 10,000 pop. |
| Here: | 1.02 / 10,000 pop. |
| California: | 0.62 / 10,000 pop. |
| Sonoma County: | 1.99 / 10,000 pop. |
| California: | 1.49 / 10,000 pop. |
| Sonoma County: | 10.12 / 10,000 pop. |
| California: | 7.42 / 10,000 pop. |
| Here: | 6.3% |
| State: | 7.3% |
| This county: | 19.8% |
| California: | 21.3% |
| Sonoma County: | 16.2% |
| California: | 17.9% |
Health and Nutrition:
| Here: | 49.6% |
| California: | 49.4% |
| Petaluma: | 47.6% |
| California: | 48.0% |
| Here: | 28.4 |
| California: | 28.1 |
| This city: | 21.4% |
| State: | 20.2% |
| Petaluma: | 9.7% |
| State: | 11.2% |
| Petaluma: | 6.8 |
| California: | 6.8 |
| Petaluma: | 33.8% |
| California: | 31.5% |
| This city: | 56.6% |
| State: | 56.4% |
| This city: | 79.5% |
| California: | 80.9% |
More about Health and Nutrition of Petaluma, CA Residents
| Local government employment and payroll (March 2022) | |||||
| Function | Full-time employees | Monthly full-time payroll | Average yearly full-time wage | Part-time employees | Monthly part-time payroll |
|---|---|---|---|---|---|
| Police Protection - Officers | 68 | $829,827 | $146,440 | 0 | $0 |
| Firefighters | 50 | $534,885 | $128,372 | 0 | $0 |
| Water Supply | 36 | $262,491 | $87,497 | 1 | $2,510 |
| Police - Other | 35 | $264,796 | $90,787 | 1 | $3,179 |
| Financial Administration | 29 | $271,217 | $112,228 | 1 | $3,089 |
| Sewerage | 27 | $267,174 | $118,744 | 0 | $0 |
| Streets and Highways | 24 | $214,640 | $107,320 | 1 | $2,496 |
| Parks and Recreation | 17 | $148,937 | $105,132 | 19 | $32,904 |
| Other Government Administration | 17 | $112,377 | $79,325 | 0 | $0 |
| Solid Waste Management | 10 | $67,587 | $81,104 | 0 | $0 |
| Fire - Other | 6 | $68,553 | $137,106 | 5 | $7,656 |
| Other and Unallocable | 6 | $47,080 | $94,160 | 0 | $0 |
| Judicial and Legal | 4 | $26,761 | $80,283 | 0 | $0 |
| Transit | 2 | $21,075 | $126,450 | 0 | $0 |
| Housing and Community Development (Local) | 2 | $26,584 | $159,504 | 0 | $0 |
| Airports | 2 | $17,025 | $102,150 | 4 | $3,355 |
| Water Transport and Terminals | 0 | $0 | 1 | $2,013 | |
| Totals for Government | 335 | $3,181,012 | $113,947 | 33 | $57,202 |
Petaluma government finances - Expenditure in 2021 (per resident):
- Construction - Police Protection: $265,000 ($4.52)
General - Other: $109,000 ($1.86)
- Current Operations - Police Protection: $19,893,000 ($339.17)
Regular Highways: $18,525,000 ($315.85)
Water Utilities: $14,924,000 ($254.45)
Local Fire Protection: $12,369,000 ($210.89)
Sewerage: $10,396,000 ($177.25)
Transit Utilities: $5,968,000 ($101.75)
Central Staff Services: $5,172,000 ($88.18)
Health - Other: $4,706,000 ($80.24)
Housing and Community Development: $2,977,000 ($50.76)
Parks and Recreation: $2,700,000 ($46.03)
General - Other: $1,713,000 ($29.21)
Air Transportation: $1,183,000 ($20.17)
Libraries: $39,000 ($0.66)
- General - Interest on Debt: $4,564,000 ($77.81)
- Water Utilities - Interest on Debt: $170,000 ($2.90)
Petaluma government finances - Revenue in 2021 (per resident):
- Charges - Sewerage: $29,964,000 ($510.88)
Other: $13,667,000 ($233.02)
Air Transportation: $1,665,000 ($28.39)
Parks and Recreation: $1,120,000 ($19.10)
Regular Highways: $190,000 ($3.24)
Sea and Inland Port Facilities: $6,000 ($0.10)
Housing and Community Development: $1,000 ($0.02)
- Federal Intergovernmental - Other: $4,576,000 ($78.02)
Transit Utilities: $2,241,000 ($38.21)
Housing and Community Development: $682,000 ($11.63)
Air Transportation: $167,000 ($2.85)
- Local Intergovernmental - Transit Utilities: $1,568,000 ($26.73)
Other: $667,000 ($11.37)
- Miscellaneous - General Revenue - Other: $1,883,000 ($32.10)
Interest Earnings: $1,532,000 ($26.12)
Fines and Forfeits: $387,000 ($6.60)
Rents: $169,000 ($2.88)
Sale of Property: $73,000 ($1.24)
Donations From Private Sources: $37,000 ($0.63)
- Revenue - Water Utilities: $20,786,000 ($354.40)
Transit Utilities: $90,000 ($1.53)
- State Intergovernmental - Other: $3,141,000 ($53.55)
Highways: $2,507,000 ($42.74)
Transit Utilities: $2,033,000 ($34.66)
Sewerage: $178,000 ($3.03)
General Local Government Support: $73,000 ($1.24)
Water Utilities: $3,000 ($0.05)
- Tax - Property: $16,870,000 ($287.63)
General Sales and Gross Receipts: $16,536,000 ($281.93)
Public Utilities Sales: $4,734,000 ($80.71)
Other: $4,019,000 ($68.52)
Other Selective Sales: $2,131,000 ($36.33)
Other License: $2,096,000 ($35.74)
Documentary and Stock Transfer: $1,801,000 ($30.71)
Occupation and Business License - Other: $1,287,000 ($21.94)
Petaluma government finances - Debt in 2021 (per resident):
- Long Term Debt - Beginning Outstanding - Unspecified Public Purpose: $106,600,000 ($1817.50)
Outstanding Unspecified Public Purpose: $101,155,000 ($1724.66)
Retired Unspecified Public Purpose: $6,326,000 ($107.86)
Issue, Unspecified Public Purpose: $881,000 ($15.02)
Petaluma government finances - Cash and Securities in 2021 (per resident):
- Bond Funds - Cash and Securities: $8,350,000 ($142.37)
- Other Funds - Cash and Securities: $124,694,000 ($2126.00)
- Sinking Funds - Cash and Securities: $5,161,000 ($87.99)
| Businesses in Petaluma, CA | ||||
| Name | Count | Name | Count | |
|---|---|---|---|---|
| 24 Hour Fitness | 1 | KFC | 1 | |
| 7-Eleven | 5 | Kmart | 1 | |
| AMF Bowling | 1 | Kohl's | 1 | |
| AT&T | 2 | Kroger | 1 | |
| Ace Hardware | 1 | Lane Bryant | 1 | |
| Aeropostale | 1 | Levi Strauss & Co. | 1 | |
| Ann Taylor | 1 | Little Caesars Pizza | 1 | |
| Applebee's | 1 | MasterBrand Cabinets | 3 | |
| AutoZone | 1 | McDonald's | 2 | |
| Avenue | 1 | Motel 6 | 1 | |
| Banana Republic | 1 | Motherhood Maternity | 1 | |
| Baskin-Robbins | 1 | New Balance | 1 | |
| Best Western | 1 | Nike | 12 | |
| Big O Tires | 1 | Nissan | 1 | |
| Blockbuster | 1 | Pac Sun | 1 | |
| Brooks Brothers | 1 | Panda Express | 1 | |
| Burger King | 2 | Payless | 1 | |
| CVS | 2 | Pier 1 Imports | 1 | |
| Chevrolet | 1 | Quality | 1 | |
| Clarks | 1 | Quiznos | 1 | |
| Cold Stone Creamery | 1 | RadioShack | 1 | |
| Curves | 1 | Sears | 2 | |
| Decora Cabinetry | 2 | Sheraton | 1 | |
| Dennys | 1 | Sprint Nextel | 1 | |
| Domino's Pizza | 1 | Staples | 1 | |
| Famous Footwear | 1 | Starbucks | 6 | |
| FedEx | 14 | Subway | 6 | |
| Ford | 1 | T-Mobile | 2 | |
| GNC | 1 | Taco Bell | 1 | |
| GameStop | 1 | Toyota | 1 | |
| Gap | 1 | Trader Joe's | 1 | |
| Goodwill | 2 | U-Haul | 3 | |
| Gymboree | 1 | UPS | 13 | |
| H&R Block | 2 | Vans | 1 | |
| Honda | 1 | Verizon Wireless | 1 | |
| IHOP | 1 | Vons | 1 | |
| Jack In The Box | 2 | Wendy's | 1 | |
| Jamba Juice | 1 | Whole Foods Market | 1 | |
| Jones New York | 3 | |||
Strongest AM radio stations in Petaluma:
- KCBS (740 AM; 50 kW; SAN FRANCISCO, CA; Owner: INFINITY BROADCASTING OPERATIONS, INC.)
- KTOB (1490 AM; 1 kW; PETALUMA, CA; Owner: MOON BROADCASTING CORPORATION)
- KTRB (860 AM; 50 kW; MODESTO, CA; Owner: PAPPAS RADIO OF CALIFORNIA, A CALIFORNIA LIMITED PARTNERSHIP)
- KIQI (1010 AM; 35 kW; SAN FRANCISCO, CA; Owner: RADIO UNICA OF SAN FRANCISCO LICENSE CORP.)
- KNEW (910 AM; 20 kW; OAKLAND, CA; Owner: AMFM RADIO LICENSES, L.L.C.)
- KNBR (680 AM; 50 kW; SAN FRANCISCO, CA; Owner: KNBR LICO, INC.)
- KTCT (1050 AM; 50 kW; SAN MATEO, CA; Owner: SUSQUEHANNA RADIO CORP.)
- KFAX (1100 AM; 50 kW; SAN FRANCISCO, CA; Owner: GOLDEN GATE BROADCASTING CO, INC.)
- KGO (810 AM; 50 kW; SAN FRANCISCO, CA; Owner: KGO-AM RADIO, INC.)
- KSRO (1350 AM; 5 kW; SANTA ROSA, CA; Owner: MAVERICK MEDIA OF SANTA ROSA LICENSE LLC)
- KDYA (1190 AM; 10 kW; VALLEJO, CA; Owner: BAYBRIDGE COMMUNICATIONS, L.L.C.)
- KDIA (1640 AM; 10 kW; VALLEJO, CA; Owner: BAYBRIDGE COMMUNICATIONS, L.L.C.)
- KYCY (1550 AM; 50 kW; SAN FRANCISCO, CA; Owner: INFINITY BROADCASTING OPERATIONS, INC.)
Strongest FM radio stations in Petaluma:
- KXFX-FM1 (101.7 FM; PETALUMA, CA; Owner: MAVERICK MEDIA OF SANTA ROSA LICENSE LLC)
- K221DQ (92.1 FM; PETALUMA, CA; Owner: EDUCATIONAL MEDIA FOUNDATION)
- KRPQ (104.9 FM; ROHNERT PARK, CA; Owner: RESULTS RADIO OF SONOMA LP)
- KSFB-FM (100.7 FM; SAN RAFAEL, CA; Owner: GOLDEN GATE BROADCASTING COMPANY, INC.)
- KZST-FM2 (100.1 FM; ROHNERT PARK PETALUM, CA; Owner: REDWOOD EMPIRE STEREOCASTERS)
- KNDL (89.9 FM; ANGWIN, CA; Owner: HOWELL MOUNTAIN BROADCASTING COMPANY)
- KLVR (91.9 FM; SANTA ROSA, CA; Owner: EDUCATIONAL MEDIA FOUNDATION)
- KXTS (100.9 FM; CALISTOGA, CA; Owner: SINCLAIR TELECABLE, INC.)
- KBBF (89.1 FM; SANTA ROSA, CA; Owner: BILINGUAL B/CING. FOUNDATION, INC.)
- KJZY (93.7 FM; SEBASTOPOL, CA; Owner: REDWOOD EMPIRE STEREOCASTERS)
- KXFX (101.7 FM; SANTA ROSA, CA; Owner: MAVERICK MEDIA OF SANTA ROSA LICENSE LLC)
- KJZY-FM1 (93.7 FM; ROHNERT PARK, CA; Owner: REDWOOD EMPIRE STEREOCASTERS)
- KWMR (90.5 FM; POINT REYES STATION, CA; Owner: WEST MARIN COMMUNITY RADIO, INC.)
- KUIC (95.3 FM; VACAVILLE, CA; Owner: KUIC, INC.)
- K202CT (88.3 FM; SANTA ROSA, CA; Owner: KQED, INC.)
- KKSF-FM1 (103.7 FM; PLEASANTON, ETC., CA; Owner: AMFM RADIO LICENSES, L.L.C.)
- KBLX-FM2 (102.9 FM; PLEASANTON, CA; Owner: ICBC BROADCAST HOLDINGS -CA, INC.)
- KSOL-FM3 (98.9 FM; PLEASANTON, CA; Owner: TMS LICENSE CALIFORNIA, INC)
- KFRC-FM3 (99.7 FM; WALNUT CREEK, CA; Owner: INFINITY KFRC-FM, INC.)
- KZBR-FM1 (95.7 FM; WALNUT CREEK, CA; Owner: BONNEVILLE HOLDING COMPANY)
TV broadcast stations around Petaluma:
- KQED (Channel 9; SAN FRANCISCO, CA; Owner: KQED, INC.)
- KRCB (Channel 22; COTATI, CA; Owner: RURAL CALIFORNIA BROADCASTING CORP.)
- KGO-TV (Channel 7; SAN FRANCISCO, CA; Owner: KGO TELEVISION, INC.)
- KPIX-TV (Channel 5; SAN FRANCISCO, CA; Owner: CBS BROADCASTING INC.)
- KTVU (Channel 2; OAKLAND, CA; Owner: KTVU PARTNERSHIP)
- KSPX (Channel 29; SACRAMENTO, CA; Owner: PAXSON SACRAMENTO LICENSE, INC.)
- KOVR (Channel 13; STOCKTON, CA; Owner: SCI - SACRAMENTO LICENSEE, LLC)
- KXTV (Channel 10; SACRAMENTO, CA; Owner: KXTV, INC.)
- KTXL (Channel 40; SACRAMENTO, CA; Owner: CHANNEL 40, INC.)
- KRON-TV (Channel 4; SAN FRANCISCO, CA; Owner: YOUNG BROADCASTING OF SAN FRANCISCO, INC.)
- KQCA (Channel 58; STOCKTON, CA; Owner: KCRA HEARST-ARGYLE TELEVISION, INC.)
- KVIE (Channel 6; SACRAMENTO, CA; Owner: KVIE, INC.)
- KMTP-TV (Channel 32; SAN FRANCISCO, CA; Owner: MINORITY TELEVISION PROJECT)
- KBHK-TV (Channel 44; SAN FRANCISCO, CA; Owner: VIACOM TELEVISION STATIONS GROUP OF SAN FRANCISCO INC.)
- KBWB (Channel 20; SAN FRANCISCO, CA; Owner: KBWB LICENSE, INC.)
- KFSF (Channel 66; VALLEJO, CA; Owner: TELEFUTURA SAN FRANCISCO LLC)
- KCNS (Channel 38; SAN FRANCISCO, CA; Owner: WRAY, INC.)
- KTLN-TV (Channel 68; NOVATO, CA; Owner: CHRISTIAN COMMUNICATIONS CHICAGOLAND)
- K30DO (Channel 30; SANTA ROSA, CA; Owner: YOUNG BROADCASTING OF SAN FRANCISCO, INC.)
- National Bridge Inventory (NBI) Statistics
- 60Number of bridges
- 801ft / 244mTotal length
- 1,477,483Total average daily traffic
- 95,505Total average daily truck traffic
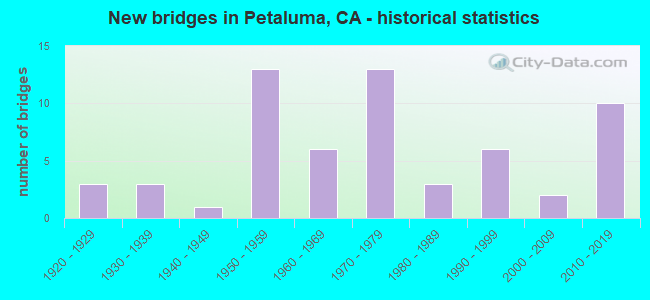
- New bridges - historical statistics
- 31920-1929
- 31930-1939
- 11940-1949
- 131950-1959
- 61960-1969
- 131970-1979
- 31980-1989
- 61990-1999
- 22000-2009
- 102010-2019
FCC Registered Antenna Towers: 170 (See the full list of FCC Registered Antenna Towers)
FCC Registered Private Land Mobile Towers: 1 (See the full list of FCC Registered Private Land Mobile Towers in Petaluma, CA)
FCC Registered Broadcast Land Mobile Towers: 53 (See the full list of FCC Registered Broadcast Land Mobile Towers)
FCC Registered Microwave Towers: 36 (See the full list of FCC Registered Microwave Towers in this town)
FCC Registered Paging Towers: 9 (See the full list of FCC Registered Paging Towers)
FCC Registered Maritime Coast & Aviation Ground Towers: 4 (See the full list of FCC Registered Maritime Coast & Aviation Ground Towers)
FCC Registered Amateur Radio Licenses: 560 (See the full list of FCC Registered Amateur Radio Licenses in Petaluma)
FAA Registered Aircraft Manufacturers and Dealers: 2 (See the full list of FAA Registered Manufacturers and Dealers in Petaluma)
FAA Registered Aircraft: 120 (See the full list of FAA Registered Aircraft)
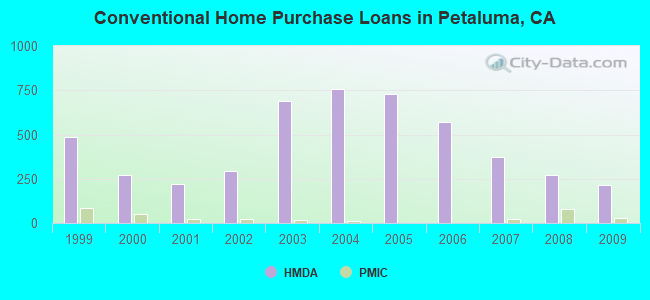
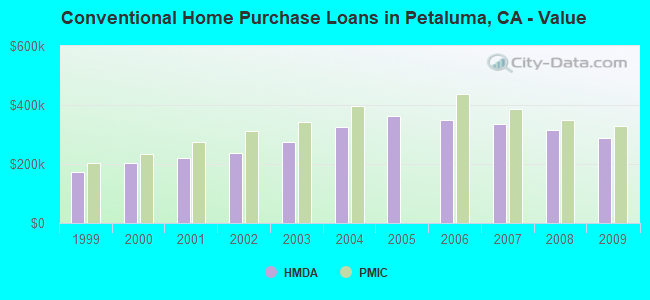
| Home Mortgage Disclosure Act Aggregated Statistics For Year 2009 (Based on 3 full and 7 partial tracts) | ||||||||||||||
| A) FHA, FSA/RHS & VA Home Purchase Loans | B) Conventional Home Purchase Loans | C) Refinancings | D) Home Improvement Loans | E) Loans on Dwellings For 5+ Families | F) Non-occupant Loans on < 5 Family Dwellings (A B C & D) | G) Loans On Manufactured Home Dwelling (A B C & D) | ||||||||
|---|---|---|---|---|---|---|---|---|---|---|---|---|---|---|
| Number | Average Value | Number | Average Value | Number | Average Value | Number | Average Value | Number | Average Value | Number | Average Value | Number | Average Value | |
| LOANS ORIGINATED | 105 | $334,251 | 217 | $287,960 | 898 | $274,062 | 29 | $194,168 | 2 | $6,799,160 | 109 | $211,701 | 3 | $84,563 |
| APPLICATIONS APPROVED, NOT ACCEPTED | 6 | $320,192 | 26 | $295,087 | 91 | $334,088 | 5 | $138,294 | 1 | $16,761,670 | 12 | $262,842 | 3 | $72,380 |
| APPLICATIONS DENIED | 17 | $349,711 | 30 | $261,348 | 261 | $324,985 | 11 | $167,193 | 0 | $0 | 26 | $256,819 | 4 | $137,548 |
| APPLICATIONS WITHDRAWN | 14 | $348,694 | 23 | $302,026 | 160 | $287,911 | 9 | $118,317 | 1 | $12,465,520 | 22 | $215,741 | 0 | $0 |
| FILES CLOSED FOR INCOMPLETENESS | 4 | $347,745 | 8 | $279,655 | 42 | $339,552 | 1 | $105,850 | 0 | $0 | 4 | $174,218 | 0 | $0 |
Detailed mortgage data for all 10 tracts in Petaluma, CA
| Private Mortgage Insurance Companies Aggregated Statistics For Year 2009 (Based on 3 full and 7 partial tracts) | ||||||
| A) Conventional Home Purchase Loans | B) Refinancings | C) Non-occupant Loans on < 5 Family Dwellings (A & B) | ||||
|---|---|---|---|---|---|---|
| Number | Average Value | Number | Average Value | Number | Average Value | |
| LOANS ORIGINATED | 27 | $328,737 | 13 | $356,413 | 1 | $326,320 |
| APPLICATIONS APPROVED, NOT ACCEPTED | 6 | $352,783 | 5 | $356,760 | 0 | $0 |
| APPLICATIONS DENIED | 8 | $354,529 | 1 | $294,870 | 0 | $0 |
| APPLICATIONS WITHDRAWN | 3 | $372,597 | 1 | $537,610 | 0 | $0 |
| FILES CLOSED FOR INCOMPLETENESS | 1 | $324,970 | 0 | $0 | 0 | $0 |
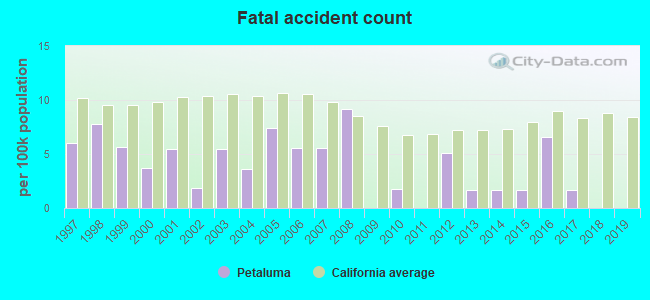
2005 - 2018 National Fire Incident Reporting System (NFIRS) incidents
- Fire incident types reported to NFIRS in Petaluma, CA
- 1,12152.5%Outside Fires
- 66931.3%Structure Fires
- 28513.3%Mobile Property/Vehicle Fires
- 612.9%Other
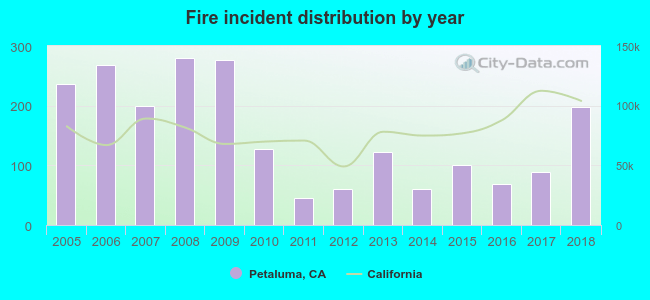 According to the data from the years 2005 - 2018 the average number of fires per year is 152. The highest number of fire incidents - 280 took place in 2008, and the least - 46 in 2011. The data has a decreasing trend.
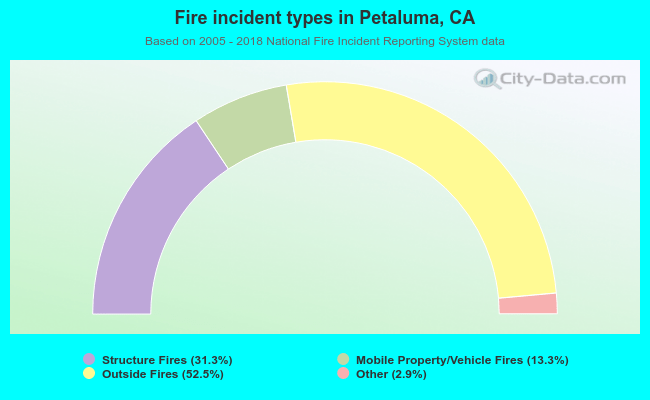 When looking into fire subcategories, the most incidents belonged to: Outside Fires (52.5%), and Structure Fires (31.3%).
Fire-safe hotels and motels in Petaluma, California:
- Americas Best Value Inn, 5135 Montero Way, Petaluma, California 94954 , Phone: (707) 795-9000, Fax: (707) 795-9005
- Quality Inn Petaluma, 5100 Montero Way, Petaluma, California 94954 , Phone: (707) 664-1155, Fax: (707) 664-8566
- Sheraton Hotel, 745 Baywood Dr, Petaluma, California 94954 , Phone: (707) 283-2888, Fax: (707) 283-2828
- Hotel Petaluma, an Ascend Hotel Collection Member, 205 Kentucky St, Petaluma, California 94952 , Phone: (707) 559-3393
- Hampton Inn Petaluma, 450 Jefferson St, Petaluma, California 94952 , Phone: (707) 397-0000, Fax: (707) 397-5522
| Most common first names in Petaluma, CA among deceased individuals | ||
| Name | Count | Lived (average) |
|---|---|---|
| John | 370 | 76.5 years |
| William | 306 | 76.0 years |
| Mary | 298 | 81.6 years |
| Robert | 239 | 72.1 years |
| James | 193 | 73.7 years |
| Joseph | 173 | 75.9 years |
| Charles | 173 | 74.3 years |
| George | 172 | 77.0 years |
| Dorothy | 157 | 79.0 years |
| Helen | 149 | 80.8 years |
| Most common last names in Petaluma, CA among deceased individuals | ||
| Last name | Count | Lived (average) |
|---|---|---|
| Smith | 117 | 76.2 years |
| Johnson | 100 | 76.1 years |
| Brown | 63 | 81.3 years |
| Anderson | 62 | 81.1 years |
| Miller | 57 | 76.4 years |
| Williams | 56 | 74.0 years |
| Petersen | 52 | 80.5 years |
| Jones | 51 | 80.1 years |
| Jensen | 43 | 79.2 years |
| Thompson | 41 | 78.8 years |
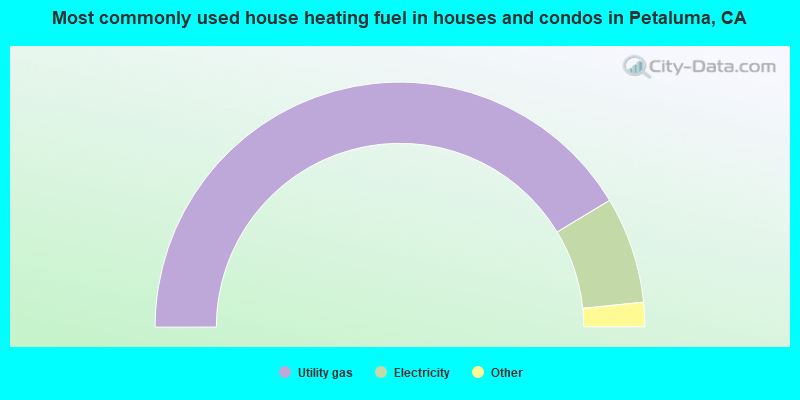
- 82.7%Utility gas
- 14.1%Electricity
- 1.4%Solar energy
- 1.1%Bottled, tank, or LP gas
- 0.4%Wood
- 0.3%No fuel used
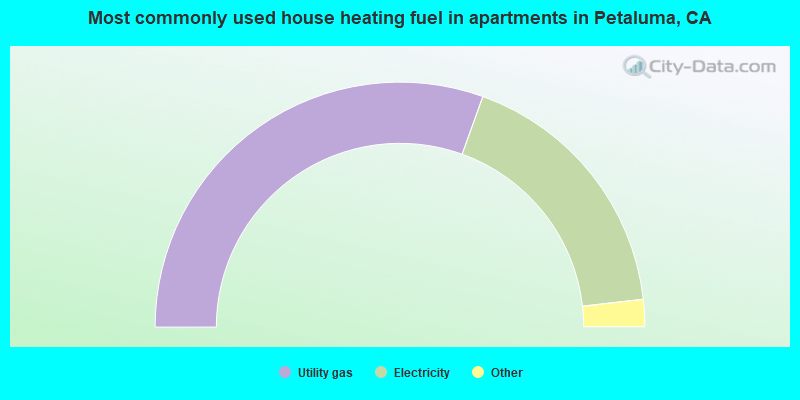
- 61.0%Utility gas
- 35.4%Electricity
- 2.1%Bottled, tank, or LP gas
- 0.9%Wood
- 0.6%No fuel used
Petaluma compared to California state average:
- Unemployed percentage significantly below state average.
- Black race population percentage significantly below state average.
- Hispanic race population percentage below state average.
- Median age significantly above state average.
- Foreign-born population percentage below state average.
- Length of stay since moving in significantly above state average.
- Percentage of population with a bachelor's degree or higher above state average.
Petaluma on our top lists:
- #32 on the list of "Top 101 cities with the largest city-data.com crime index increase from 2011 to 2012 (population 50,000+)"
- #36 on the list of "Top 101 cities with the highest maximum monthly sunshine amount (population 50,000+)"
- #40 on the list of "Top 101 cities with the lowest number of thefts per 100,000 residents (population 50,000+)"
- #51 on the list of "Top 101 cities with the lowest number of burglaries per 100,000 residents (population 50,000+)"
- #52 on the list of "Top 101 cities with the largest differences between morning and afternoon humidity (population 50,000+)"
- #52 on the list of "Top 101 cities with the largest humidity differences during a year (population 50,000+)"
- #54 on the list of "Top 101 cities with the largest sunshine amount differences during a year (population 50,000+)"
- #56 on the list of "Top 101 cities with largest percentage of males in occupations: building and grounds cleaning and maintenance occupations (population 50,000+)"
- #57 on the list of "Top 101 cities with the highest ratio of rapes to murders between 2002 and 2012 (population 50,000+)"
- #59 on the list of "Top 101 cities with the largest percentage of likely lesbian couples (counted as self-reported female-female unmarried-partner households) (population 50,000+)"
- #64 on the list of "Top 101 cities with largest percentage of females in industries: other services, except public administration (population 50,000+)"
- #78 on the list of "Top 101 cities with the largest percentage of one, detached housing units in structures (20,000+ housing units)"
- #80 on the list of "Top 101 cities with the most users submitting photos to our site per 10,000 residents (population 50,000+)"
- #84 on the list of "Top 101 cities with the lowest number of auto thefts per 100,000 residents (population 50,000+)"
- #84 on the list of "Top 100 high-educated but low-earning cities (pop. 50,000+)"
- #92 on the list of "Top 101 cities with the lowest number of police officers per 1000 residents (population 50,000+)"
- #93 on the list of "Top 101 cities with the highest average sunshine amount (population 50,000+)"
- #95 on the list of "Top 101 cities with the highest percentage of workers working at home, population 50,000+"
- #100 on the list of "Top 101 cities with largest percentage of males in industries: arts, entertainment, and recreation (population 50,000+)"
- #101 on the list of "Top 101 cities with the highest number of days clear of clouds (population 50,000+)"
- #5 on the list of "Top 101 counties with the lowest Ozone (1-hour) air pollution readings in 2012 (ppm)"
- #10 on the list of "Top 101 counties with the lowest Particulate Matter (PM10) Annual air pollution readings in 2012 (µg/m3)"
- #20 on the list of "Top 101 counties with the lowest number of infant deaths per 1000 residents 2007-2013 (pop. 50,000+)"
- #24 on the list of "Top 101 counties with highest percentage of residents voting for 3rd party candidates in the 2012 Presidential Election (pop. 50,000+)"
- #29 on the list of "Top 101 counties with the highest Nitrogen Dioxide air pollution readings in 2012 (ppm)"

|
|
Total of 974 patent applications in 2008-2024.