Estimated zip code population in 2022: 46,140 Zip code population in 2010: 46,377 Zip code population in 2000: 43,172
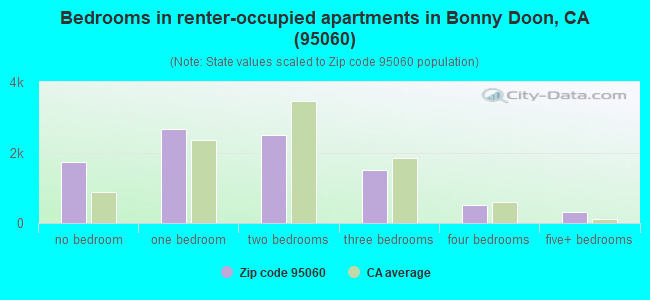
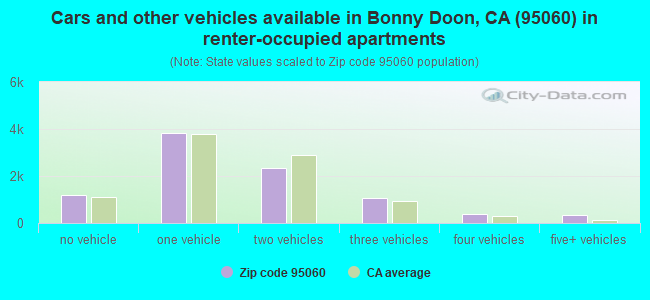
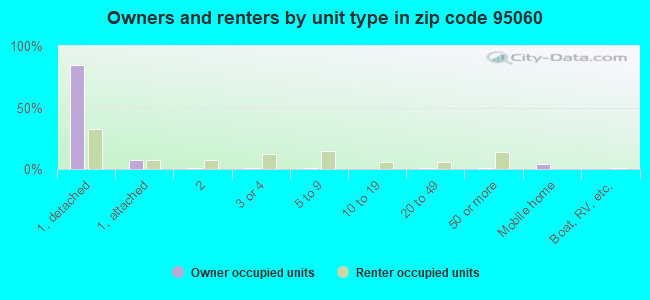
Houses and condos: 20,634 Renter-occupied apartments: 9,151
% of renters here:
49%
State:
44%
March 2022 cost of living index in zip code 95060: 132.6 (high, U.S. average is 100)
Land area: 67.8 sq. mi. Water area: 3.3 sq. mi.
Population density: 680 people per square mile
(low).
OSM Map
General Map
Google Map
MSN Map
OSM Map
General Map
Google Map
MSN Map
OSM Map
General Map
Google Map
MSN Map
OSM Map
General Map
Google Map
MSN Map
Please wait while loading the map...
Real estate property taxes paid for housing units in 2022:
This zip code:
0.5% ($6,600)
California:
0.7% ($4,831)
Median real estate property taxes paid for housing units with mortgages in 2022: $8,027 (0.6%) Median real estate property taxes paid for housing units with no mortgage in 2022: $3,632 (0.3%)
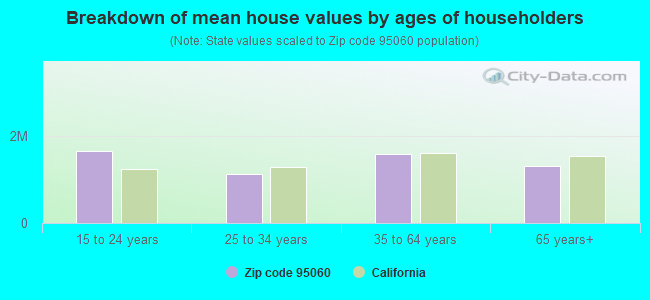
Estimated median house/condo value in 2022: $1,246,228
95060:
$1,246,228
California:
$715,900
According to our research of California and other state lists, there were 38 registered sex offenders living in 95060 zip code as of April 27, 2024. The ratio of all residents to sex offenders in zip code 95060 is 1,261 to 1. The ratio of registered sex offenders to all residents in this zip code is lower than the state average.
Median resident age:
This zip code:
36.0 years
California median age:
37.9 years
Average household size:
This zip code:
2.4 people
California:
2.8 people
Averages for the 2020 tax year for zip code 95060, filed in 2021:
Average Adjusted Gross Income (AGI) in 2020: $144,615 (Individual Income Tax Returns)
Here:
$144,615
State:
$95,910
Salary/wage: $94,456 (reported on 76.0% of returns)
Here:
$94,456
State:
$77,331
(% of AGI for various income ranges: 1211.9% for AGIs below $25k, 4213.9% for AGIs $25k-50k, 7072.1% for AGIs $50k-75k, 10655.7% for AGIs $75k-100k, 19498.4% for AGIs $100k-200k, 120071.9% for AGIs over 200k)
Taxable interest for individuals: $2,457 (reported on 40.9% of returns)
This zip code:
$2,457
California:
$2,294
(% of AGI for various income ranges: 23.6% for AGIs below $25k, 45.2% for AGIs $25k-50k, 88.4% for AGIs $50k-75k, 183.5% for AGIs $75k-100k, 275.8% for AGIs $100k-200k, 1668.0% for AGIs over 200k)
Ordinary dividends: $12,698 (reported on 32.1% of returns)
Here:
$12,698
State:
$10,949
(% of AGI for various income ranges: 64.2% for AGIs below $25k, 114.2% for AGIs $25k-50k, 226.8% for AGIs $50k-75k, 503.0% for AGIs $75k-100k, 963.2% for AGIs $100k-200k, 8142.1% for AGIs over 200k)
Net capital gain/loss in AGI: +$43,875 (reported on 31.2% of returns)
Here:
+$43,875
State:
+$49,306
(% of AGI for various income ranges: 41.3% for AGIs below $25k, 90.4% for AGIs $25k-50k, 283.6% for AGIs $50k-75k, 450.6% for AGIs $75k-100k, 1341.2% for AGIs $100k-200k, 36392.6% for AGIs over 200k)
Profit/loss from business: +$23,569 (reported on 20.3% of returns)
Here:
+$23,569
State:
+$15,671
(% of AGI for various income ranges: 189.2% for AGIs below $25k, 361.1% for AGIs $25k-50k, 488.0% for AGIs $50k-75k, 778.1% for AGIs $75k-100k, 1464.3% for AGIs $100k-200k, 6636.6% for AGIs over 200k)
Taxable individual retirement arrangement distribution: $24,552 (reported on 9.7% of returns)
95060:
$24,552
California:
$23,505
(% of AGI for various income ranges: 51.9% for AGIs below $25k, 122.2% for AGIs $25k-50k, 275.3% for AGIs $50k-75k, 474.4% for AGIs $75k-100k, 1050.8% for AGIs $100k-200k, 2816.0% for AGIs over 200k)
Self-employed (Keogh) retirement plans: $23,487 (reported on 1.8% of returns)
95060:
$23,487
California:
$30,163
(% of AGI for various income ranges: 14.8% for AGIs $25k-50k, 18.6% for AGIs $50k-75k, 32.8% for AGIs $75k-100k, 133.0% for AGIs $100k-200k, 863.9% for AGIs over 200k)
Total itemized deductions: $40,154 (reported on 18.3% of returns)
Here:
$40,154
State:
$39,517
(% of AGI for various income ranges: 131.6% for AGIs below $25k, 238.6% for AGIs $25k-50k, 572.7% for AGIs $50k-75k, 1104.5% for AGIs $75k-100k, 2495.7% for AGIs $100k-200k, 12170.3% for AGIs over 200k)
Charity contributions: $9,415 (reported on 14.7% of returns)
Here:
$9,415
State:
$12,598
(% of AGI for various income ranges: 4.7% for AGIs below $25k, 16.5% for AGIs $25k-50k, 46.2% for AGIs $50k-75k, 125.6% for AGIs $75k-100k, 282.0% for AGIs $100k-200k, 3168.4% for AGIs over 200k)
Taxes paid: $8,938 (reported on 18.1% of returns)
95060:
$8,938
State:
$8,807
(% of AGI for various income ranges: 22.9% for AGIs below $25k, 54.8% for AGIs $25k-50k, 137.1% for AGIs $50k-75k, 326.5% for AGIs $75k-100k, 667.1% for AGIs $100k-200k, 2300.3% for AGIs over 200k)
Earned income credit: $1,269 (reported on 8.3% of returns)
Here:
$1,269
State:
$2,074
(% of AGI for various income ranges: 41.5% for AGIs below $25k, 27.8% for AGIs $25k-50k)
Percentage of individuals using paid preparers for their 2020 taxes: 91.7%
Here:
92%
State:
92%
(% for various income ranges: 89.0% for AGIs below $25k, 92.3% for AGIs $25k-50k, 91.7% for AGIs $50k-75k, 91.6% for AGIs $75k-100k, 93.0% for AGIs $100k-200k, 94.8% for AGIs over 200k)
Averages for the 2012 tax year for zip code 95060, filed in 2013:
Average Adjusted Gross Income (AGI) in 2012: $82,260 (Individual Income Tax Returns)
Here:
$82,260
State:
$72,726
Salary/wage: $64,583 (reported on 78.6% of returns)
Here:
$64,583
State:
$59,079
(% of AGI for various income ranges: 74.2% for AGIs below $25k, 74.8% for AGIs $25k-50k, 69.3% for AGIs $50k-75k, 65.0% for AGIs $75k-100k, 67.2% for AGIs $100k-200k, 52.1% for AGIs over 200k)
Taxable interest for individuals: $2,660 (reported on 40.5% of returns)
This zip code:
$2,660
California:
$2,146
(% of AGI for various income ranges: 1.5% for AGIs below $25k, 1.2% for AGIs $25k-50k, 1.2% for AGIs $50k-75k, 1.2% for AGIs $75k-100k, 1.2% for AGIs $100k-200k, 1.4% for AGIs over 200k)
Ordinary dividends: $10,751 (reported on 28.6% of returns)
Here:
$10,751
State:
$9,308
(% of AGI for various income ranges: 3.1% for AGIs below $25k, 2.1% for AGIs $25k-50k, 2.9% for AGIs $50k-75k, 2.8% for AGIs $75k-100k, 2.9% for AGIs $100k-200k, 5.0% for AGIs over 200k)
Net capital gain/loss in AGI: +$21,815 (reported on 26.1% of returns)
Here:
+$21,815
State:
+$30,460
(% of AGI for various income ranges: 0.3% for AGIs below $25k, 0.9% for AGIs $25k-50k, 1.0% for AGIs $50k-75k, 1.5% for AGIs $75k-100k, 2.2% for AGIs $100k-200k, 14.0% for AGIs over 200k)
Profit/loss from business: +$23,087 (reported on 21.3% of returns)
Here:
+$23,087
State:
+$17,064
(% of AGI for various income ranges: 11.1% for AGIs below $25k, 7.3% for AGIs $25k-50k, 7.4% for AGIs $50k-75k, 6.7% for AGIs $75k-100k, 7.1% for AGIs $100k-200k, 3.9% for AGIs over 200k)
Taxable individual retirement arrangement distribution: $22,463 (reported on 9.9% of returns)
95060:
$22,463
California:
$19,557
(% of AGI for various income ranges: 2.3% for AGIs below $25k, 2.6% for AGIs $25k-50k, 3.0% for AGIs $50k-75k, 3.5% for AGIs $75k-100k, 3.0% for AGIs $100k-200k, 2.4% for AGIs over 200k)
Self-employment retirement plans: $19,721 (reported on 2.0% of returns)
95060:
$19,721
California:
$24,530
(% of AGI for various income ranges: 0.2% for AGIs $25k-50k, 0.4% for AGIs $50k-75k, 0.3% for AGIs $75k-100k, 0.5% for AGIs $100k-200k, 0.6% for AGIs over 200k)
Total itemized deductions: $39,488 (23% of AGI, reported on 37.2% of returns)
Here:
$39,488
State:
$34,004
Here:
23.5% of AGI
State:
22.7% of AGI
(% of AGI for various income ranges: 12.8% for AGIs below $25k, 11.4% for AGIs $25k-50k, 16.3% for AGIs $50k-75k, 17.5% for AGIs $75k-100k, 19.4% for AGIs $100k-200k, 19.3% for AGIs over 200k)
Charity contributions: $4,279 (reported on 30.4% of returns)
Here:
$4,279
State:
$4,659
(% of AGI for various income ranges: 0.4% for AGIs below $25k, 0.6% for AGIs $25k-50k, 1.2% for AGIs $50k-75k, 1.4% for AGIs $75k-100k, 1.7% for AGIs $100k-200k, 2.0% for AGIs over 200k)
Taxes paid: $16,729 (reported on 37.0% of returns)
95060:
$16,729
State:
$14,448
(% of AGI for various income ranges: 2.5% for AGIs below $25k, 2.6% for AGIs $25k-50k, 4.7% for AGIs $50k-75k, 6.0% for AGIs $75k-100k, 8.1% for AGIs $100k-200k, 9.7% for AGIs over 200k)
Earned income credit: $1,444 (reported on 10.8% of returns)
Here:
$1,444
State:
$2,286
(% of AGI for various income ranges: 2.6% for AGIs below $25k, 0.5% for AGIs $25k-50k)
Percentage of individuals using paid preparers for their 2012 taxes: 52.9%
Here:
53%
State:
64%
(% for various income ranges: 44.0% for AGIs below $25k, 47.9% for AGIs $25k-50k, 56.5% for AGIs $50k-75k, 61.4% for AGIs $75k-100k, 64.0% for AGIs $100k-200k, 75.7% for AGIs over 200k)
Averages for the 2004 tax year for zip code 95060, filed in 2005:
Average Adjusted Gross Income (AGI) in 2004: $69,431 (Individual Income Tax Returns)
Here:
$69,431
State:
$58,600
Salary/wage: $53,800 (reported on 79.7% of returns)
Here:
$53,800
State:
$49,455
(% of AGI for various income ranges: 144.6% for AGIs below $10k, 77.1% for AGIs $10k-25k, 76.3% for AGIs $25k-50k, 74.0% for AGIs $50k-75k, 72.2% for AGIs $75k-100k, 53.0% for AGIs over 100k)
Taxable interest for individuals: $3,439 (reported on 51.8% of returns)
This zip code:
$3,439
California:
$2,365
(% of AGI for various income ranges: 10.7% for AGIs below $10k, 3.0% for AGIs $10k-25k, 2.1% for AGIs $25k-50k, 2.2% for AGIs $50k-75k, 2.3% for AGIs $75k-100k, 2.6% for AGIs over 100k)
Taxable dividends: $5,104 (reported on 32.9% of returns)
Here:
$5,104
State:
$4,746
(% of AGI for various income ranges: 9.6% for AGIs below $10k, 2.3% for AGIs $10k-25k, 2.1% for AGIs $25k-50k, 2.4% for AGIs $50k-75k, 2.2% for AGIs $75k-100k, 2.4% for AGIs over 100k)
Net capital gain/loss: +$25,415 (reported on 29.5% of returns)
Here:
+$25,415
State:
+$23,418
(% of AGI for various income ranges: -2.5% for AGIs below $10k, 0.6% for AGIs $10k-25k, 0.8% for AGIs $25k-50k, 1.6% for AGIs $50k-75k, 2.1% for AGIs $75k-100k, 16.6% for AGIs over 100k)
Profit/loss from business: +$20,200 (reported on 21.5% of returns)
Here:
+$20,200
State:
+$16,826
(% of AGI for various income ranges: 12.4% for AGIs below $10k, 7.8% for AGIs $10k-25k, 8.1% for AGIs $25k-50k, 7.9% for AGIs $50k-75k, 7.6% for AGIs $75k-100k, 5.2% for AGIs over 100k)
IRA payment deduction: $3,266 (reported on 3.4% of returns)
95060:
$3,266
California:
$3,192
(% of AGI for various income ranges: 0.6% for AGIs below $10k, 0.3% for AGIs $10k-25k, 0.3% for AGIs $25k-50k, 0.3% for AGIs $50k-75k, 0.2% for AGIs $75k-100k, 0.1% for AGIs over 100k)
Self-employed pension: $16,080 (reported on 2.8% of returns)
Here:
$16,080
California:
$17,688
(% of AGI for various income ranges: 0.6% for AGIs below $10k, 0.1% for AGIs $10k-25k, 0.4% for AGIs $25k-50k, 0.5% for AGIs $50k-75k, 0.7% for AGIs $75k-100k, 0.8% for AGIs over 100k)
Total itemized deductions: $31,622 (23% of AGI, reported on 39.0% of returns)
Here:
$31,622
State:
$28,113
Here:
22.6% of AGI
State:
25.3% of AGI
(% of AGI for various income ranges: 36.3% for AGIs below $10k, 13.1% for AGIs $10k-25k, 14.4% for AGIs $25k-50k, 20.5% for AGIs $50k-75k, 22.5% for AGIs $75k-100k, 17.3% for AGIs over 100k)
Charity contributions deductions: $5,210 (3% of AGI, reported on 34.0% of returns)
Here:
$5,210
State:
$3,923
Here:
3.5% of AGI
State:
3.3% of AGI
(% of AGI for various income ranges: 1.3% for AGIs below $10k, 0.8% for AGIs $10k-25k, 1.1% for AGIs $25k-50k, 1.7% for AGIs $50k-75k, 1.9% for AGIs $75k-100k, 3.2% for AGIs over 100k)
Total tax: $13,588 (reported on 79.3% of returns)
95060:
$13,588
State:
$10,761
(% of AGI for various income ranges: 7.0% for AGIs below $10k, 5.1% for AGIs $10k-25k, 8.5% for AGIs $25k-50k, 10.6% for AGIs $50k-75k, 11.3% for AGIs $75k-100k, 19.3% for AGIs over 100k)
Earned income credit: $1,128 (reported on 9.1% of returns)
Here:
$1,128
State:
$1,763
Percentage of individuals using paid preparers for their 2004 taxes: 53.2%
Here:
53%
State:
66%
(% for various income ranges: 42.1% for AGIs below $10k, 46.4% for AGIs $10k-25k, 51.8% for AGIs $25k-50k, 59.4% for AGIs $50k-75k, 61.3% for AGIs $75k-100k, 70.3% for AGIs over 100k)
Likely homosexual households (counted as self-reported same-sex unmarried-partner households)
Lesbian couples: 0.4% of all households
Gay men: 0.1% of all households
Household received Food Stamps/SNAP in the past 12 months: 2,485 Household did not receive Food Stamps/SNAP in the past 12 months: 16,289
Women who had a birth in the past 12 months: 372 (206 now married, 167 unmarried) Women who did not have a birth in the past 12 months: 11,981 (3,170 now married, 8,877 unmarried)
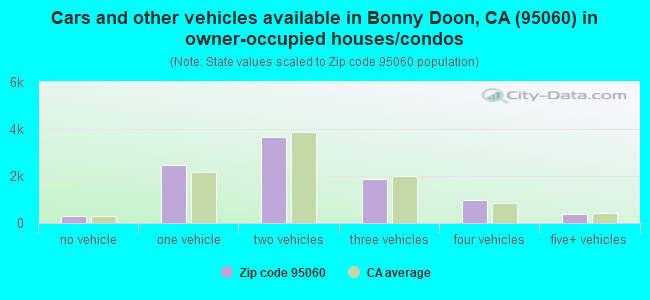
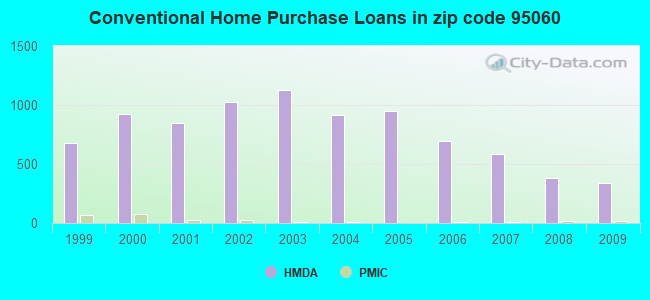
Housing units in zip code 95060 with a mortgage: 6,092 (850 second mortgage, 44 home equity loan, 727 both second mortgage and home equity loan) Houses without a mortgage: 68
Median monthly owner costs for units with a mortgage: $3,531 Median monthly owner costs for units without a mortgage: $852
Residents with income below the poverty level in 2022:
This zip code:
18.4%
Whole state:
12.2%
Residents with income below 50% of the poverty level in 2022:
This zip code:
6.9%
Whole state:
6.2%
Median number of rooms in houses and condos:
Here:
5.8
State:
6.0
Median number of rooms in apartments:
Here:
3.4
State:
3.9
Notable locations in this zip code not listed on our city pages
Notable locations in zip code 95060: Camp Ben Lomond (A), Bonnie Doon Substation (B), Santa Cruz Looff Carousel and Roller Coaster (C), The Circles (D), Joseph M Long Marine Laboratory (E), Pasatiempo Golf Course (F), Santa Cruz Water Treatment Plant (G), Locatelli Ranch (H), Wilder Spur (I), Warrenella Ranch (J), Skyline Ranch (K), Santa Cruz Municipal Wharf (L), Santa Cruz Surfing Museum (M), Santa Cruz County Law Library (N), Santa Cruz County Historical Trust Archives (O), Santa Cruz County Courthouse (P), Santa Cruz County Adult Detention Facility (Q), Santa Cruz Civic Auditorium (R), Santa Cruz City Hall (S), Santa Cruz City Chamber of Commerce (T). Display/hide their locations on the map
Shopping Centers: Cooperhouse Shopping Center (1), Cooper Street Plaza Shopping Center (2), San Lorenzo Park Plaza Shopping Center (3). Display/hide their locations on the map
Churches in zip code 95060 include: Mission Santa Cruz (A), Community Covenant Church (B), First Principle Church (C), Kingdom Hall of Jehovahs Witnesses (D), New Life Center (E), Society of Abidence In Truth (F), Calvary Epsicopal Church (G), Christian Life Center (H), First Church of Christ Scientist (I). Display/hide their locations on the map
Creeks: Branciforte Creek (A), Carbonera Creek (B), East Branch Liddell Creek (C), Laguna Creek (D), Moore Creek (E), Yellow Bank Creek (F), Meder Creek (G), Wilder Creek (H), West Liddell Creek (I). Display/hide their locations on the map
Parks in zip code 95060 include: Derby Park (1), Garfield Park (2), Grant Park (3), Harvey West Park (4), Laurel Park (5), Lighthouse Field State Beach (6), Lighthouse Point Park (7), Neary Lagoon Park (8), Santa Cruz Mission State Historic Park (9). Display/hide their locations on the map
Beaches: Cowell Beach (A), Santa Cruz Beach (B), Red, White and Blue Beach (C), Bonny Doon Beach (D), Four Mile Beach (E), Panther Beach (F), Three Mile Beach (G), Wilder Beach (H). Display/hide their locations on the map
3,895 married couples with children.
1,845 single-parent households (1,014 men, 831 women).
75.4% of residents of 95060 zip code speak English at home.
13.9% of residents speak Spanish at home (77% very well, 14% well, 7% not well, 2% not at all).
4.7% of residents speak other Indo-European language at home (88% very well, 8% well, 3% not well, 1% not at all).
4.5% of residents speak Asian or Pacific Island language at home (70% very well, 23% well, 6% not well, 2% not at all).
1.2% of residents speak other language at home (99% very well, 1% well).
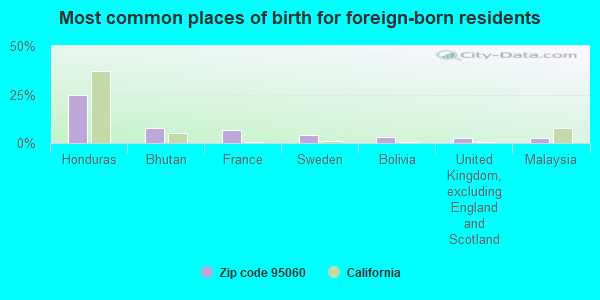
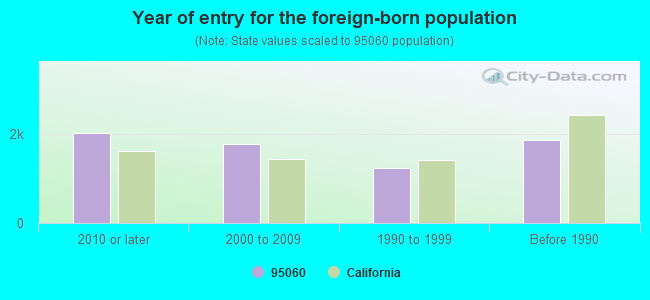
Foreign born population: 5,955 (12.9%) (47.5% of them are naturalized citizens)
Major facilities with environmental interests located in this zip code:
EXXON SERVICE STATION NO 7-3176 (1415 OCEAN ST/PRYCE in SANTA CRUZ, CA)
STATE MASTER (California - Hazardous Waste Tracking) - HAZARDOU WASTE PROGRAM CRITERIA AND HAZARDOUS AIR POLLUTANT INVENTORY (Inventory of air pollution sources) Small Quantity Generators, between 100 kg and 1000 kg of hazardous waste/month (Resource Conservation and Recovery Act (tracking hazardous waste)) - notification Business SIC classification: GASOLINE SERVICE STATIONS Organizations: EXXON CO USA (CONTACT/OWNER)
Alternative names: ABBAS ALI NAZEMI, EXXON MOBIL CORPORATION #731760, SAV-ON GASOLINE
CHEVRON STATION 91361 (805 OCEAN ST in SANTA CRUZ, CA)
STATE MASTER (California - Hazardous Waste Tracking) - HAZARDOU WASTE PROGRAM CRITERIA AND HAZARDOUS AIR POLLUTANT INVENTORY (Inventory of air pollution sources) Small Quantity Generators, between 100 kg and 1000 kg of hazardous waste/month (Resource Conservation and Recovery Act (tracking hazardous waste)) - notification Business SIC classification: GASOLINE SERVICE STATIONS Organizations: CHEVRON PRODUCTS CO (CONTACT/OWNER)
Alternative names: BOBS CHEVRON, CHEVRON PRODUCTS COMPANY, CHEVRON STATION #91361
CHEVRON STATION NO 93865 (823 MISSION ST in SANTA CRUZ, CA)
STATE MASTER (California - Hazardous Waste Tracking) - HAZARDOU WASTE PROGRAM CRITERIA AND HAZARDOUS AIR POLLUTANT INVENTORY (Inventory of air pollution sources) Small Quantity Generators, between 100 kg and 1000 kg of hazardous waste/month (Resource Conservation and Recovery Act (tracking hazardous waste)) - notification Business SIC classification: GASOLINE SERVICE STATIONS Organizations: CHEVRON PRODUCTS CO (CONTACT/OWNER)
Alternative names: CHEVRON PRODUCTS COMPANY, COLES CHEVRON SERVICE
BARITEAUS OF SANTA CRUZ (620 WATER ST in SANTA CRUZ, CA)
STATE MASTER (California - Hazardous Waste Tracking) - HAZARDOU WASTE PROGRAM CRITERIA AND HAZARDOUS AIR POLLUTANT INVENTORY (Inventory of air pollution sources) Small Quantity Generators, between 100 kg and 1000 kg of hazardous waste/month (Resource Conservation and Recovery Act (tracking hazardous waste)) Business SIC classification: DRYCLEANING PLANTS, EXCEPT RUG CLEANING
MIDAS MUFFLER & BRAKES (1218 OCEAN ST in SANTA CRUZ, CA)
STATE MASTER (California - Hazardous Waste Tracking) - HAZARDOU WASTE PROGRAM Small Quantity Generators, between 100 kg and 1000 kg of hazardous waste/month (Resource Conservation and Recovery Act (tracking hazardous waste)) - notification Organizations: R R WARDELL (CONTACT/OWNER)
Alternative names: MIDAS MUFFLER & BRAKE SHOP
MISSION HILL JUNIOR HIGH (425 KING ST. in SANTA CRUZ, CA)
(National Center for Education Statistics) - STATE ID-6060156 Organizations: SANTA CRUZ CITY HIGH (SCHOOL DISTRICT)
MONARCH ELEMENTARY ALTERNATIVE (313 SWIFT ST in SANTA CRUZ, CA)
(National Center for Education Statistics) - STATE ID-6108203 Organizations: SANTA CRUZ CITY ELEMENTARY (SCHOOL DISTRICT)
NATURAL BRIDGES ELEMENTARY (255 SWIFT ST. in SANTA CRUZ, CA)
(National Center for Education Statistics) - STATE ID-6049910 Organizations: SANTA CRUZ CITY ELEMENTARY (SCHOOL DISTRICT)
LOCKHEED MISSILES AND SPACE CORPORATION DS (16020 EMPIRE GRADE ROAD in SANTA CRUZ, CA)
CRITERIA AND HAZARDOUS AIR POLLUTANT INVENTORY (Inventory of air pollution sources) Large Quantity Generators, more that 1000 kg of hazardous waste/month (Resource Conservation and Recovery Act (tracking hazardous waste)) Business SIC classification: REFUSE SYSTEMS Business NAICS classification: GUIDED MISSILE AND SPACE VEHICLE MANUFACTURING.; SOLID WASTE LANDFILL. Organizations: LOCKHEED MISSILES & SPACE COMPANY INC (CONTACT/OPERATOR)
Alternative names: LOCKHEED MISSILES & SPACE COMPANY INC
ACC U TUNE & BRAKE (2335 SOQUEL DR in SANTA CRUZ, CA)
Small Quantity Generators, between 100 kg and 1000 kg of hazardous waste/month (Resource Conservation and Recovery Act (tracking hazardous waste)) - notification Organizations: TERPSTRA BOGNER STRAWMEYER (CONTACT/OWNER)
ACE AUTO BODY (217 MCPHERSON ST in SANTA CRUZ, CA)
Small Quantity Generators, between 100 kg and 1000 kg of hazardous waste/month (Resource Conservation and Recovery Act (tracking hazardous waste)) Organizations: MICHAEL FULLER (CONTACT/OWNER)
ADVENCO HOLDING CORP (555 HWY 17 in SANTA CRUZ, CA)
National Pollutant Discharge Elimination System NON-MAJOR (Tracking pollutant discharge elimination systems) - permit
EUROTECHS (211 CEDAR ST in SANTA CRUZ, CA)
Small Quantity Generators, between 100 kg and 1000 kg of hazardous waste/month (Resource Conservation and Recovery Act (tracking hazardous waste)) - notification Business NAICS classification: GENERAL AUTOMOTIVE REPAIR. Organizations: WILLIAM J MAKEL (CONTACT/OWNER)
Housing units lacking complete plumbing facilities: 0.8% Housing units lacking complete kitchen facilities: 2.1%
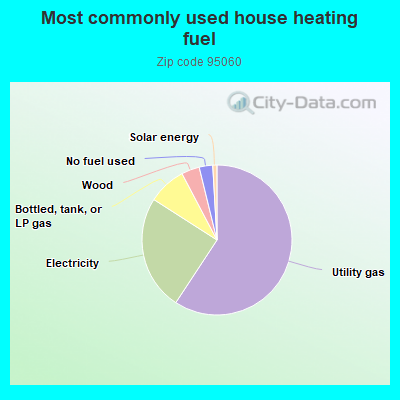
59.2%Utility gas
24.8%Electricity
8.2%Bottled, tank, or LP gas
3.9%Wood
2.9%No fuel used
0.9%Solar energy
Population in 1990: 40,334. Population change in the 1990s: +2,838 (+7.0%).
Place of birth for U.S.-born residents:
This state: 28,578
Northeast: 2,905
Midwest: 3,269
South: 2,046
West: 2,394
48% of the 95060 zip code residents lived in the same house 5 years ago. Out of people who lived in different houses, 50% lived in this county. Out of people who lived in different counties, 50% lived in California.
83% of the 95060 zip code residents lived in the same house 1 year ago. Out of people who lived in different houses, 42% moved from this county. Out of people who lived in different houses, 36% moved from different county within same state. Out of people who lived in different houses, 16% moved from different state. Out of people who lived in different houses, 4% moved from abroad.
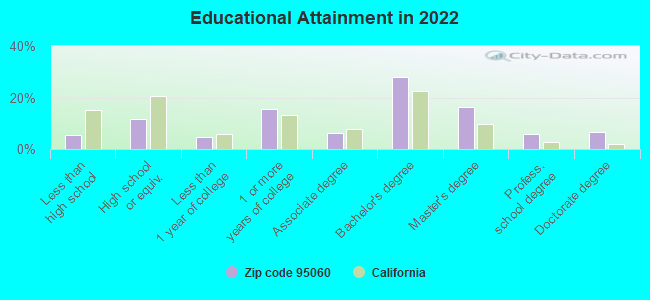
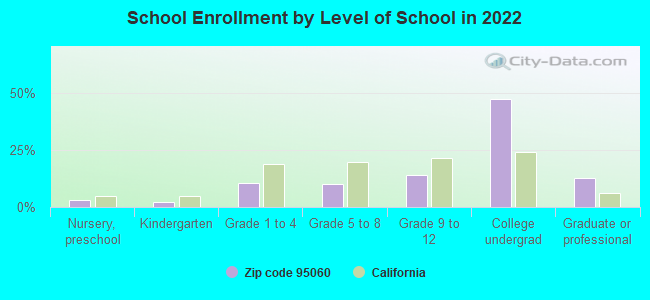
Private vs. public school enrollment:
Students in private schools in grades 1 to 8 (elementary and middle school): 387
Here:
13.7%
California:
10.5%
Students in private schools in grades 9 to 12 (high school): 164
Here:
8.7%
California:
8.5%
Students in private undergraduate colleges: 417
Here:
6.6%
California:
15.9%
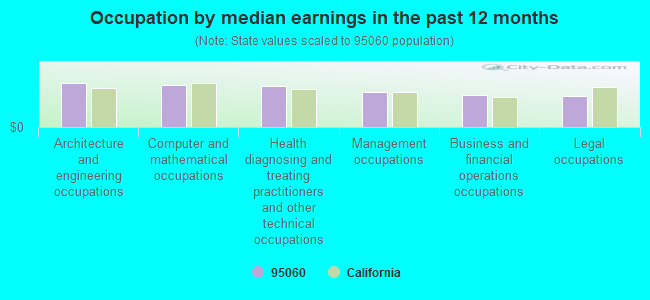
Occupation by median earnings in the past 12 months ($)
119,270Architecture and engineering occupations
113,201Computer and mathematical occupations
112,450Health diagnosing and treating practitioners and other technical occupations
93,634Management occupations
86,688Business and financial operations occupations
84,985Legal occupations
Companies with biggest federal contracts located in this zip code (SANTA CRUZ, CA):
MASS EX CONSTRUCTION COMPANY (720 RIVER STREET, STE 2; small business) : $4,009,272 in 20 contractsfrom 2003 to 2005
Contracts for Maintenance, Repair or Alteration of Real Property -- Other Non-Building Facilities, Construction of Structures and Facilities -- Parking Facilities Conservation, Construction of Structures and Facilities -- Other Non-Building Facilities by U.S. Army Corps of Engineers - civil program financing only, Army, Bureau of Land Management Signed by year:2000: $0; 2001: $0; 2002: $0; 2003: $2,700,000; 2004: $1,282,312; 2005: $26,960; 2006: $0.
Biggest contracts:
$1,300,000 with U.S. Army Corps of Engineers - civil program financing only for Maintenance, Repair or Alteration of Real Property -- Other Non-Building Facilities. Signed on 2003-07-10. Completion date: 2004-06-24.
$1,100,000 with Army for Maintenance, Repair or Alteration of Real Property -- Other Non-Building Facilities. Signed on 2003-10-23. Completion date: 2004-06-24.
$1,100,000 with U.S. Army Corps of Engineers - civil program financing only for Maintenance, Repair or Alteration of Real Property -- Other Non-Building Facilities. Signed on 2003-10-23. Completion date: 2004-06-24.
$431,932 with Army for Maintenance, Repair or Alteration of Real Property -- Other Non-Building Facilities. Signed on 2004-04-22. Completion date: 2004-06-24.
MONTEREY BAY COMMUNICATIONS (1010 FAIR AVE; small business) : $1,501,216 in 70 contractsfrom 2000 to 2006
Contracts for ADP Central Processing Unit (CPU, Computer), Digital, Electrical and Electronic assemblies, Boards, Cards, and Associated Hardware, ADP Components, Aircraft Maintenance and Repair Shop Specialized Equipment, and moreby Navy, Air Force, Defense Logistics Agency, NASA, and others Signed by year:2000: $114,598; 2001: $95,855; 2002: $25,500; 2003: $431,553; 2004: $105,025; 2005: $638,139; 2006: $90,546.
Biggest contracts:
$199,776 with Navy for ADP Central Processing Unit (CPU, Computer), Digital. Signed on 2005-07-22. Completion date: 2005-08-01.
$156,750 with Navy for Electrical and Electronic assemblies, Boards, Cards, and Associated Hardware. Signed on 2003-07-25. Completion date: 2003-08-09.
$101,739 with Navy for ADP Components. Signed on 2005-03-22. Completion date: 2005-05-05.
$63,843 with Air Force for Aircraft Maintenance and Repair Shop Specialized Equipment. Signed on 2000-04-26. Completion date: 2000-04-24.
UNIVERSITY BUSINESS PARK LLC () : $950,814 in 33 contractsfrom 2002 to 2006
Contracts for Lease or Rental of Facilities -- Office Buildings by Public Buildings Service Signed by year:2000: $0; 2001: $0; 2002: $63,000; 2003: $210,267; 2004: $84,704; 2005: $338,731; 2006: $254,112.
Biggest contracts:
$42,352 with Public Buildings Service for Lease or Rental of Facilities -- Office Buildings. Signed on 2006-07-01. Completion date: 2006-09-30.
$42,352, same as above.Signed on 2006-07-01. Completion date: 2006-09-30.
$42,352, same as above.Signed on 2006-04-01. Completion date: 2006-09-30.
$42,352, same as above.Signed on 2006-04-01. Completion date: 2006-09-30.
TARANTELLA INC (425 ENCINAL ST) : $151,557 in 7 contractsfrom 2000 to 2005
Contracts for ADP Central Processing Unit (CPU, Computer), Analog, ADP Software, Office Furniture, Other ADP and Telecommunications Services (includes data storage on tapes, compact disks, etc.), and moreby Army, Navy, Air Force Signed by year:2000: $75,500; 2001: $0; 2002: $13,740; 2003: $12,369; 2004: $34,374; 2005: $15,574; 2006: $0.
Biggest contracts:
$75,500 with Army for ADP Central Processing Unit (CPU, Computer), Analog. Signed on 2000-09-18. Completion date: 2000-10-31.
$24,000 with Navy for ADP Software. Signed on 2004-12-29. Completion date: 2004-12-30.
$13,740 with Army for Office Furniture. Taking place in AZ. Signed on 2002-05-07. Completion date: 2002-05-02.
$12,369 with Army for Other ADP and Telecommunications Services (includes data storage on tapes, compact disks, etc.). Signed on 2003-04-08. Completion date: 2003-04-11.
DATA COLLECTION & MANAGEMENT (819 1 2 PACIFIC AVENUE; small business) : $69,645 in 2 contractsin 2002
$67,000 with Army for ADP Software. Signed on 2002-08-22. Completion date: 2002-09-27.
$2,645 with Department of Defense for ADP Software. Signed on 2002-05-21. Completion date: 2002-05-22.
WISDOM JACKET CONSULTING INC (228 TRESCONY ST; small business) : $53,000 in 2 contractsfrom 2005 to 2006
$35,000 with Navy for Education Services. Signed on 2006-05-31. Completion date: 2006-09-30.
$18,000 with Navy for Other Professional Services. Signed on 2005-08-23. Completion date: 2005-09-30.
KINNETIC LABORATORIES, INC (307 WASHINGTON STREET; small business) : $41,200 in 4 contractsin 2004
$14,500 with Army for Other Environmental Services, Studies, and Analytical Support. Signed on 2004-09-02. Completion date: 2004-09-30.
$14,500 with U.S. Army Corps of Engineers - civil program financing only for Other Environmental Services, Studies, and Analytical Support. Signed on 2004-09-02. Completion date: 2004-09-30.
$6,100, same as above.Signed on 2004-06-24. Completion date: 2004-09-30.
$6,100 with Army for Other Environmental Services, Studies, and Analytical Support. Signed on 2004-06-24. Completion date: 2004-09-30.
NISENE TECHNOLOGY GROUP INC (330 ENCINAL STREET; small business)
$36,236 with Navy for Chemical Analysis Instruments. Signed on 2000-08-14. Completion date: 2000-09-04.
PACIFIC COAST PHOTO CO (280 CRESS RD; small business)
$36,156 with Air Force for Photographic Supplies. Signed on 2003-06-27. Completion date: 2003-09-02.
ROBERT FAIRLIE, PHD (1909 GINA CT; small business)
$35,000 with Small Business Administration for Patent and Trademark Services. Taking place in DC. Signed on 2003-09-15. Completion date: 2004-09-15.
Top industries in this zip code by the number of employees in 2005:
2005 - 2018 National Fire Incident Reporting System (NFIRS) incidents
According to the data from the years 2005 - 2018 the average number of fire incidents per year is 74. The highest number of fire incidents - 165 took place in 2017, and the least - 9 in 2005. The data has a growing trend.
When looking into fire subcategories, the most incidents belonged to: Outside Fires (52.4%), and Structure Fires (31.6%).
Fire incident types reported to NFIRS in Zip Code 95060

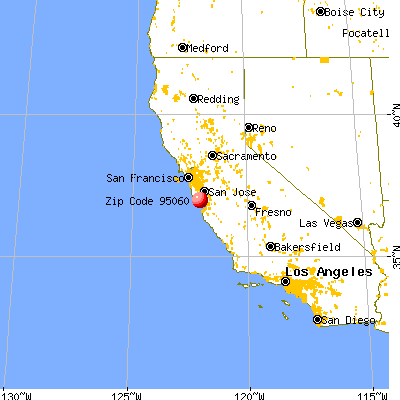


 Nearest zip codes: 95041, 95005, 95007, 95018, 95064, 95066.


 According to the data from the years 2005 - 2018 the average number of fire incidents per year is 74. The highest number of fire incidents - 165 took place in 2017, and the least - 9 in 2005. The data has a growing trend.
 When looking into fire subcategories, the most incidents belonged to: Outside Fires (52.4%), and Structure Fires (31.6%).