Estimated zip code population in 2022: 6,004 Zip code population in 2010: 7,778 Zip code population in 2000: 8,720
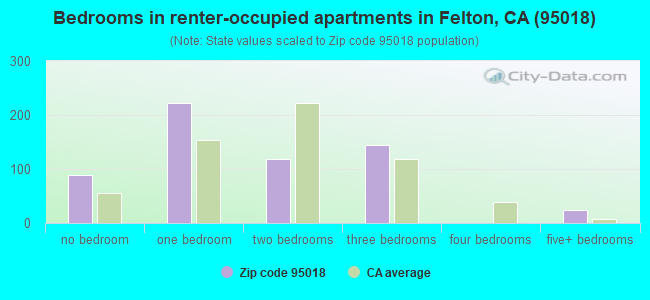
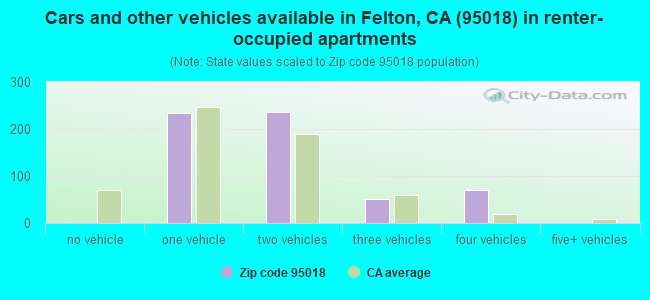
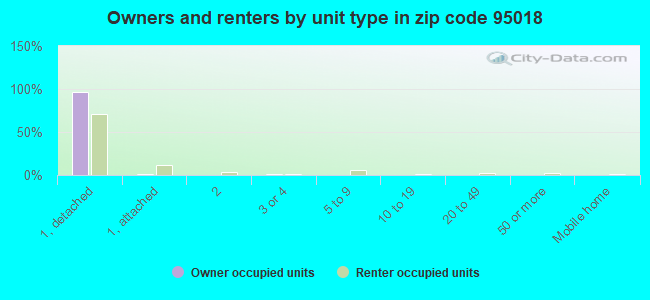
Houses and condos: 3,018 Renter-occupied apartments: 594
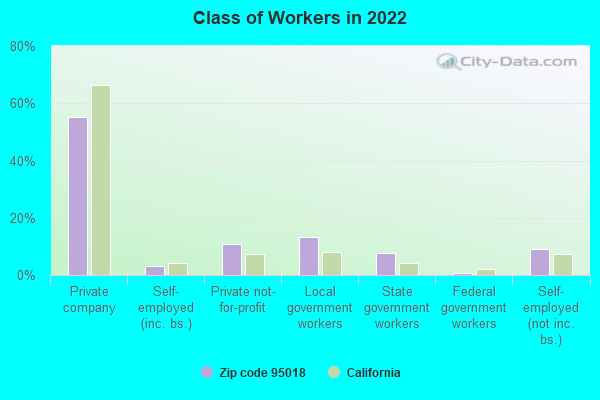
% of renters here:
22%
State:
44%
March 2022 cost of living index in zip code 95018: 127.1 (high, U.S. average is 100)
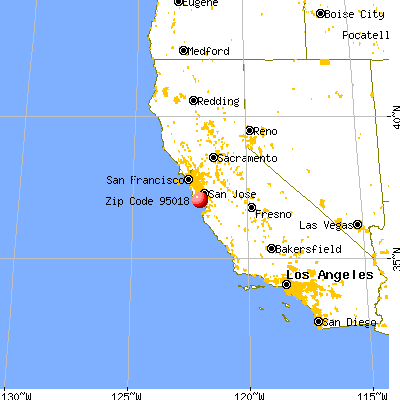
Land area: 18.8 sq. mi. Water area: 0.0 sq. mi.
Population density: 319 people per square mile
(very low).
OSM Map
General Map
Google Map
MSN Map
OSM Map
General Map
Google Map
MSN Map
OSM Map
General Map
Google Map
MSN Map
OSM Map
General Map
Google Map
MSN Map
Please wait while loading the map...
Real estate property taxes paid for housing units in 2022:
This zip code:
0.6% ($5,129)
California:
0.7% ($4,831)
Median real estate property taxes paid for housing units with mortgages in 2022: $6,299 (0.7%) Median real estate property taxes paid for housing units with no mortgage in 2022: $3,749 (0.5%)
Business Search- 14 Million verified businesses
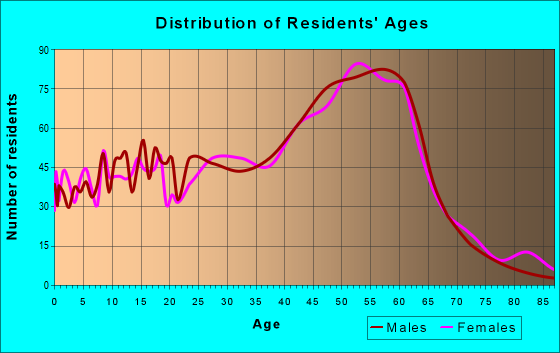
Males: 3,087
(51.4%)
Females: 2,916
(48.6%)
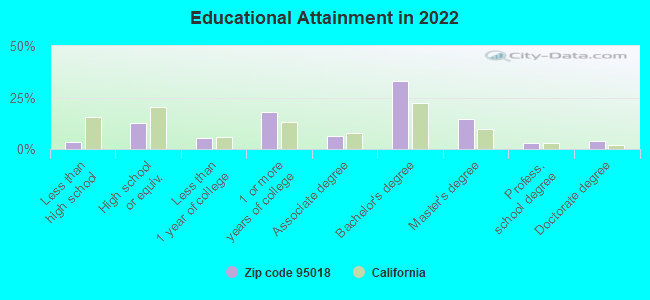
For population 25 years and over in 95018:
High school or higher: 97.3%
Bachelor's degree or higher: 54.4%
Graduate or professional degree: 21.1%
Unemployed: 2.7%
Mean travel time to work (commute): 30.6 minutes
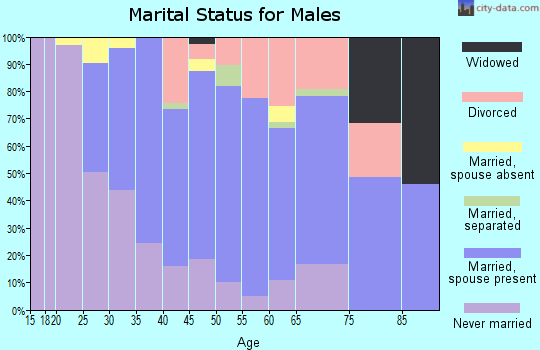
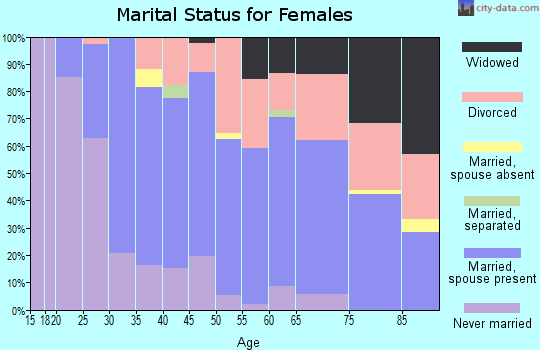
For population 15 years and over in 95018:
Never married: 33.9%
Now married: 49.9%
Separated: 0.6%
Widowed: 4.4%
Divorced: 11.2%
Zip code 95018 compared to state average:
Unemployed percentage below state average.
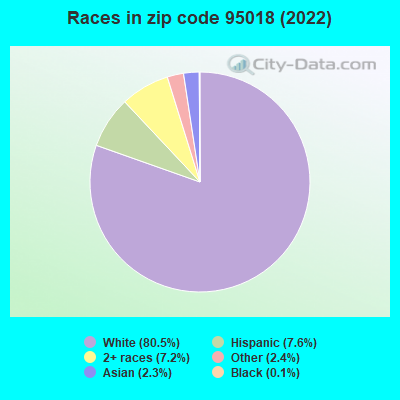
Black race population percentage significantly below state average.
Hispanic race population percentage significantly below state average.
Median age significantly above state average.
Foreign-born population percentage significantly below state average.
Renting percentage below state average.
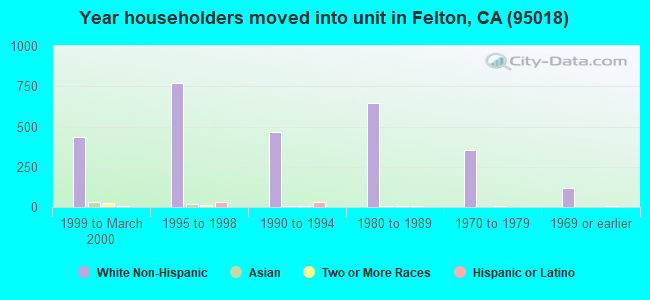
Length of stay since moving in significantly above state average.
House age above state average.
Percentage of population with a bachelor's degree or higher above state average.
Averages for the 2020 tax year for zip code 95018, filed in 2021:
Average Adjusted Gross Income (AGI) in 2020: $97,650 (Individual Income Tax Returns)
Here:
$97,650
State:
$95,910
Salary/wage: $86,972 (reported on 75.4% of returns)
Here:
$86,972
State:
$77,331
(% of AGI for various income ranges: 1110.4% for AGIs below $25k, 3810.2% for AGIs $25k-50k, 6719.0% for AGIs $50k-75k, 9522.9% for AGIs $75k-100k, 21065.2% for AGIs $100k-200k, 91930.0% for AGIs over 200k)
Taxable interest for individuals: $1,714 (reported on 43.8% of returns)
This zip code:
$1,714
California:
$2,294
(% of AGI for various income ranges: 26.6% for AGIs below $25k, 50.0% for AGIs $25k-50k, 85.2% for AGIs $50k-75k, 120.7% for AGIs $75k-100k, 174.8% for AGIs $100k-200k, 1169.1% for AGIs over 200k)
Ordinary dividends: $4,980 (reported on 27.1% of returns)
Here:
$4,980
State:
$10,949
(% of AGI for various income ranges: 72.5% for AGIs below $25k, 135.0% for AGIs $25k-50k, 196.5% for AGIs $50k-75k, 165.4% for AGIs $75k-100k, 430.2% for AGIs $100k-200k, 1354.5% for AGIs over 200k)
Net capital gain/loss in AGI: +$21,119 (reported on 26.6% of returns)
Here:
+$21,119
State:
+$49,306
(% of AGI for various income ranges: 36.4% for AGIs below $25k, 85.0% for AGIs $25k-50k, 230.6% for AGIs $50k-75k, 300.4% for AGIs $75k-100k, 725.2% for AGIs $100k-200k, 15717.3% for AGIs over 200k)
Profit/loss from business: +$19,636 (reported on 21.6% of returns)
Here:
+$19,636
State:
+$15,671
(% of AGI for various income ranges: 244.5% for AGIs below $25k, 444.3% for AGIs $25k-50k, 639.4% for AGIs $50k-75k, 991.1% for AGIs $75k-100k, 925.7% for AGIs $100k-200k, 4561.8% for AGIs over 200k)
Taxable individual retirement arrangement distribution: $23,239 (reported on 10.2% of returns)
95018:
$23,239
California:
$23,505
(% of AGI for various income ranges: 84.5% for AGIs below $25k, 179.5% for AGIs $25k-50k, 292.3% for AGIs $50k-75k, 320.4% for AGIs $75k-100k, 785.5% for AGIs $100k-200k, 2765.5% for AGIs over 200k)
Self-employed (Keogh) retirement plans: $12,900 (reported on 1.2% of returns)
95018:
$12,900
California:
$30,163
(% of AGI for various income ranges: 44.5% for AGIs $25k-50k, 104.1% for AGIs $100k-200k)
Total itemized deductions: $30,852 (reported on 22.6% of returns)
Here:
$30,852
State:
$39,517
(% of AGI for various income ranges: 215.7% for AGIs below $25k, 402.4% for AGIs $25k-50k, 820.6% for AGIs $50k-75k, 1033.2% for AGIs $75k-100k, 2483.6% for AGIs $100k-200k, 8010.9% for AGIs over 200k)
Charity contributions: $4,478 (reported on 16.2% of returns)
Here:
$4,478
State:
$12,598
(% of AGI for various income ranges: 3.9% for AGIs below $25k, 16.0% for AGIs $25k-50k, 70.3% for AGIs $50k-75k, 103.9% for AGIs $75k-100k, 228.9% for AGIs $100k-200k, 1187.3% for AGIs over 200k)
Taxes paid: $8,987 (reported on 22.1% of returns)
95018:
$8,987
State:
$8,807
(% of AGI for various income ranges: 44.8% for AGIs below $25k, 114.8% for AGIs $25k-50k, 212.9% for AGIs $50k-75k, 340.4% for AGIs $75k-100k, 762.7% for AGIs $100k-200k, 2087.3% for AGIs over 200k)
Earned income credit: $1,178 (reported on 8.0% of returns)
Here:
$1,178
State:
$2,074
(% of AGI for various income ranges: 43.8% for AGIs below $25k, 31.4% for AGIs $25k-50k)
Percentage of individuals using paid preparers for their 2020 taxes: 90.8%
Here:
91%
State:
92%
(% for various income ranges: 87.4% for AGIs below $25k, 88.7% for AGIs $25k-50k, 92.3% for AGIs $50k-75k, 91.3% for AGIs $75k-100k, 93.3% for AGIs $100k-200k, 95.0% for AGIs over 200k)
Averages for the 2012 tax year for zip code 95018, filed in 2013:
Average Adjusted Gross Income (AGI) in 2012: $69,723 (Individual Income Tax Returns)
Here:
$69,723
State:
$72,726
Salary/wage: $62,014 (reported on 80.3% of returns)
Here:
$62,014
State:
$59,079
(% of AGI for various income ranges: 66.0% for AGIs below $25k, 71.0% for AGIs $25k-50k, 71.3% for AGIs $50k-75k, 73.0% for AGIs $75k-100k, 79.7% for AGIs $100k-200k, 59.9% for AGIs over 200k)
Taxable interest for individuals: $1,091 (reported on 42.4% of returns)
This zip code:
$1,091
California:
$2,146
(% of AGI for various income ranges: 1.7% for AGIs below $25k, 1.1% for AGIs $25k-50k, 0.8% for AGIs $50k-75k, 0.7% for AGIs $75k-100k, 0.4% for AGIs $100k-200k, 0.5% for AGIs over 200k)
Ordinary dividends: $4,156 (reported on 25.6% of returns)
Here:
$4,156
State:
$9,308
(% of AGI for various income ranges: 3.1% for AGIs below $25k, 1.3% for AGIs $25k-50k, 1.3% for AGIs $50k-75k, 1.5% for AGIs $75k-100k, 1.2% for AGIs $100k-200k, 1.8% for AGIs over 200k)
Net capital gain/loss in AGI: +$9,835 (reported on 22.4% of returns)
Here:
+$9,835
State:
+$30,460
(% of AGI for various income ranges: 1.0% for AGIs $25k-50k, 1.0% for AGIs $50k-75k, 0.8% for AGIs $75k-100k, 1.7% for AGIs $100k-200k, 9.8% for AGIs over 200k)
Profit/loss from business: +$15,283 (reported on 25.1% of returns)
Here:
+$15,283
State:
+$17,064
(% of AGI for various income ranges: 16.3% for AGIs below $25k, 10.9% for AGIs $25k-50k, 6.8% for AGIs $50k-75k, 4.0% for AGIs $75k-100k, 3.8% for AGIs $100k-200k, 3.2% for AGIs over 200k)
Taxable individual retirement arrangement distribution: $16,495 (reported on 10.1% of returns)
95018:
$16,495
California:
$19,557
(% of AGI for various income ranges: 3.1% for AGIs below $25k, 2.8% for AGIs $25k-50k, 2.6% for AGIs $50k-75k, 3.5% for AGIs $75k-100k, 2.0% for AGIs $100k-200k, 1.9% for AGIs over 200k)
Self-employment retirement plans: $14,033 (reported on 1.6% of returns)
95018:
$14,033
California:
$24,530
Total itemized deductions: $27,437 (25% of AGI, reported on 48.3% of returns)
Here:
$27,437
State:
$34,004
Here:
25.0% of AGI
State:
22.7% of AGI
(% of AGI for various income ranges: 26.6% for AGIs below $25k, 15.8% for AGIs $25k-50k, 19.4% for AGIs $50k-75k, 19.9% for AGIs $75k-100k, 21.1% for AGIs $100k-200k, 14.9% for AGIs over 200k)
Charity contributions: $2,296 (reported on 36.5% of returns)
Here:
$2,296
State:
$4,659
(% of AGI for various income ranges: 0.7% for AGIs below $25k, 0.8% for AGIs $25k-50k, 1.1% for AGIs $50k-75k, 1.7% for AGIs $75k-100k, 1.3% for AGIs $100k-200k, 1.0% for AGIs over 200k)
Taxes paid: $10,173 (reported on 47.7% of returns)
95018:
$10,173
State:
$14,448
(% of AGI for various income ranges: 4.3% for AGIs below $25k, 3.8% for AGIs $25k-50k, 5.0% for AGIs $50k-75k, 6.4% for AGIs $75k-100k, 8.2% for AGIs $100k-200k, 8.8% for AGIs over 200k)
Earned income credit: $1,367 (reported on 11.5% of returns)
Here:
$1,367
State:
$2,286
(% of AGI for various income ranges: 3.0% for AGIs below $25k, 0.6% for AGIs $25k-50k)
Percentage of individuals using paid preparers for their 2012 taxes: 52.3%
Here:
52%
State:
64%
(% for various income ranges: 39.5% for AGIs below $25k, 49.3% for AGIs $25k-50k, 57.9% for AGIs $50k-75k, 60.5% for AGIs $75k-100k, 64.1% for AGIs $100k-200k, 70.6% for AGIs over 200k)
Averages for the 2004 tax year for zip code 95018, filed in 2005:
Average Adjusted Gross Income (AGI) in 2004: $53,592 (Individual Income Tax Returns)
Here:
$53,592
State:
$58,600
Salary/wage: $51,871 (reported on 80.6% of returns)
Here:
$51,871
State:
$49,455
(% of AGI for various income ranges: 109.6% for AGIs below $10k, 65.4% for AGIs $10k-25k, 77.0% for AGIs $25k-50k, 78.7% for AGIs $50k-75k, 84.4% for AGIs $75k-100k, 76.3% for AGIs over 100k)
Taxable interest for individuals: $1,458 (reported on 54.0% of returns)
This zip code:
$1,458
California:
$2,365
(% of AGI for various income ranges: 7.1% for AGIs below $10k, 2.1% for AGIs $10k-25k, 1.5% for AGIs $25k-50k, 1.6% for AGIs $50k-75k, 1.0% for AGIs $75k-100k, 1.4% for AGIs over 100k)
Taxable dividends: $2,486 (reported on 28.3% of returns)
Here:
$2,486
State:
$4,746
(% of AGI for various income ranges: 5.4% for AGIs below $10k, 2.1% for AGIs $10k-25k, 1.4% for AGIs $25k-50k, 1.0% for AGIs $50k-75k, 1.0% for AGIs $75k-100k, 1.4% for AGIs over 100k)
Net capital gain/loss: +$7,278 (reported on 25.6% of returns)
Here:
+$7,278
State:
+$23,418
(% of AGI for various income ranges: -3.5% for AGIs below $10k, 0.1% for AGIs $10k-25k, 1.0% for AGIs $25k-50k, 1.3% for AGIs $50k-75k, 0.9% for AGIs $75k-100k, 7.2% for AGIs over 100k)
Profit/loss from business: +$14,756 (reported on 25.9% of returns)
Here:
+$14,756
State:
+$16,826
(% of AGI for various income ranges: 5.3% for AGIs below $10k, 18.2% for AGIs $10k-25k, 9.8% for AGIs $25k-50k, 8.0% for AGIs $50k-75k, 4.5% for AGIs $75k-100k, 5.4% for AGIs over 100k)
IRA payment deduction: $3,165 (reported on 3.9% of returns)
95018:
$3,165
California:
$3,192
(% of AGI for various income ranges: 0.3% for AGIs $10k-25k, 0.4% for AGIs $25k-50k, 0.4% for AGIs $50k-75k, 0.2% for AGIs $75k-100k, 0.1% for AGIs over 100k)
Self-employed pension: $11,687 (reported on 1.9% of returns)
Here:
$11,687
California:
$17,688
(% of AGI for various income ranges: 0.4% for AGIs $25k-50k, 0.3% for AGIs $50k-75k, 0.2% for AGIs $75k-100k, 0.6% for AGIs over 100k)
Total itemized deductions: $24,788 (30% of AGI, reported on 49.1% of returns)
Here:
$24,788
State:
$28,113
Here:
29.6% of AGI
State:
25.3% of AGI
(% of AGI for various income ranges: 52.2% for AGIs below $10k, 23.5% for AGIs $10k-25k, 27.4% for AGIs $25k-50k, 22.0% for AGIs $50k-75k, 23.5% for AGIs $75k-100k, 20.1% for AGIs over 100k)
Charity contributions deductions: $2,212 (3% of AGI, reported on 42.3% of returns)
Here:
$2,212
State:
$3,923
Here:
2.5% of AGI
State:
3.3% of AGI
(% of AGI for various income ranges: 1.8% for AGIs below $10k, 1.5% for AGIs $10k-25k, 1.3% for AGIs $25k-50k, 1.7% for AGIs $50k-75k, 1.8% for AGIs $75k-100k, 1.9% for AGIs over 100k)
Total tax: $7,976 (reported on 82.2% of returns)
95018:
$7,976
State:
$10,761
(% of AGI for various income ranges: 5.6% for AGIs below $10k, 6.7% for AGIs $10k-25k, 8.3% for AGIs $25k-50k, 9.9% for AGIs $50k-75k, 10.4% for AGIs $75k-100k, 16.6% for AGIs over 100k)
Earned income credit: $1,245 (reported on 9.2% of returns)
Here:
$1,245
State:
$1,763
Percentage of individuals using paid preparers for their 2004 taxes: 56.1%
Here:
56%
State:
66%
(% for various income ranges: 46.5% for AGIs below $10k, 49.2% for AGIs $10k-25k, 55.6% for AGIs $25k-50k, 60.8% for AGIs $50k-75k, 63.2% for AGIs $75k-100k, 67.9% for AGIs over 100k)
Household received Food Stamps/SNAP in the past 12 months: 227 Household did not receive Food Stamps/SNAP in the past 12 months: 2,498
Women who did not have a birth in the past 12 months: 1,176 (476 now married, 700 unmarried)
Housing units in zip code 95018 with a mortgage: 1,437 (153 second mortgage, 119 both second mortgage and home equity loan) Houses without a mortgage: 56
Median monthly owner costs for units with a mortgage: $3,092 Median monthly owner costs for units without a mortgage: $703
Residents with income below the poverty level in 2022:
This zip code:
6.7%
Whole state:
12.2%
Residents with income below 50% of the poverty level in 2022:
This zip code:
2.7%
Whole state:
6.2%
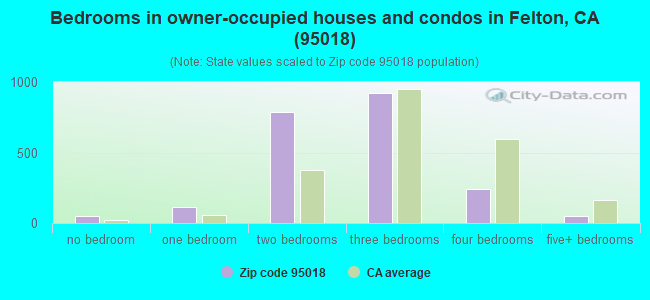
Median number of rooms in houses and condos:
Here:
5.5
State:
6.0
Median number of rooms in apartments:
Here:
3.7
State:
3.9
Notable locations in this zip code not listed on our city pages
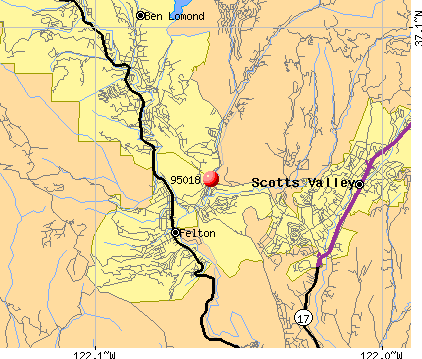
Notable locations in zip code 95018: Camp Wasibo (A), Santa Cruz Mountain Area State Parks Headquarters (B), Roaring Camp Depot (C), Roaring Camp (D), Henry Cowell Redwoods State Park Headquarters (E), Christian Conference Grounds (F), Mount Cross Camp (G), Santa Cruz Probation Center (H), Felton Branch Santa Cruz City-County Library (I), American Medical Response Santa Cruz Division (J), Zayante Fire Protection District Station 2 (K), Department of Forestry and Fire Protection Station 31 Felton Fire Station (L), Zayante Fire Protection District Station 1 (M), Felton Fire Protection District (N). Display/hide their locations on the map
Streams, rivers, and creeks: Bull Creek (A), Fall Creek (B), Lompico Creek (C), Manson Creek (D), Mill Creek (E), Zayante Creek (F), Boulder Brook (G), Ferndell Creek (H), Gold Gulch Creek (I). Display/hide their locations on the map
In group quarters: 52 (-1 institutionalized population)
Size of family households: 884 2-persons, 395 3-persons, 213 4-persons, 91 5-persons, 10 6-persons
Size of nonfamily households: 894 1-person, 262 2-persons, 23 4-persons
422 married couples with children.
235 single-parent households (147 men, 88 women).
92.0% of residents of 95018 zip code speak English at home.
3.0% of residents speak Spanish at home (95% very well, 5% well).
2.7% of residents speak other Indo-European language at home (100% very well).
1.1% of residents speak Asian or Pacific Island language at home (77% very well, 23% not well).
1.0% of residents speak other language at home (100% very well).
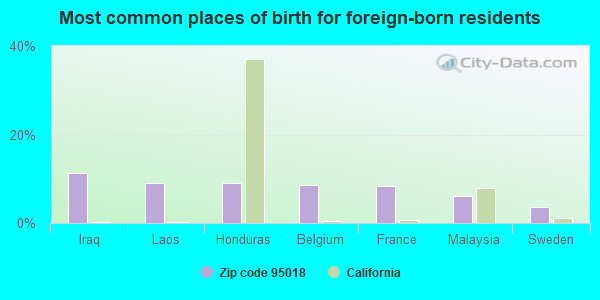
Foreign born population: 400 (6.7%) (68.9% of them are naturalized citizens)
This zip code:
6.7%
Whole state:
26.7%
11%Iraq
9%Laos
9%Honduras
9%Belgium
8%France
6%Malaysia
4%Sweden
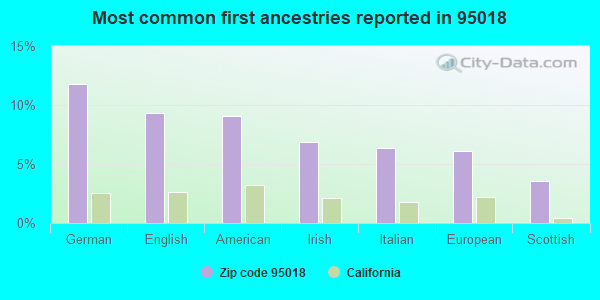
12%German
9%English
9%American
7%Irish
6%Italian
6%European
4%Scottish
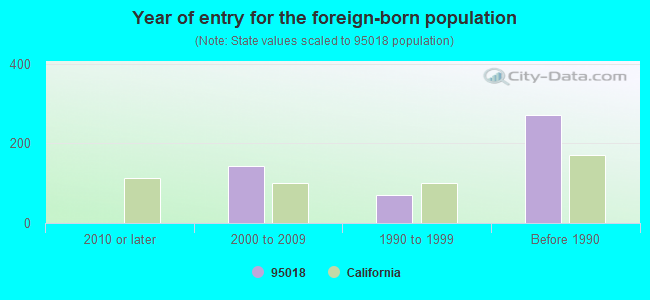
Year of entry for the foreign-born population
02010 or later
1442000 to 2009
711990 to 1999
271Before 1990
Facilities with environmental interests located in this zip code:
CHEVRON STATION NO 94909 (6325 HWY 9 in FELTON, CA)
STATE MASTER (California - Hazardous Waste Tracking) - HAZARDOU WASTE PROGRAM CRITERIA AND HAZARDOUS AIR POLLUTANT INVENTORY (Inventory of air pollution sources) National Pollutant Discharge Elimination System NON-MAJOR (Tracking pollutant discharge elimination systems) - permit Small Quantity Generators, between 100 kg and 1000 kg of hazardous waste/month (Resource Conservation and Recovery Act (tracking hazardous waste)) - notification Business SIC classification: GASOLINE SERVICE STATIONS Organizations: CHEVRON PRODUCTS CO (CONTACT/OWNER)
Alternative names: CHEVRON PRODUCTS COMPANY, CHEVRON USA, GIBLINS CHEVRON
Small Quantity Generators, between 100 kg and 1000 kg of hazardous waste/month (Resource Conservation and Recovery Act (tracking hazardous waste)) - notification Organizations: FELTON EMPIRE VYD INC (CONTACT/OWNER)
FELTON MAINTENANCE YARD (201 HIHN ST in FELTON, CA)
Small Quantity Generators, between 100 kg and 1000 kg of hazardous waste/month (Resource Conservation and Recovery Act (tracking hazardous waste)) - notification Organizations: COUNTY OF SANTA CRUZ (CONTACT/OWNER)
CALIFORNIA AUTO BODY (6085 HIGHWAY 9 in FELTON, CA)
Small Quantity Generators, between 100 kg and 1000 kg of hazardous waste/month (Resource Conservation and Recovery Act (tracking hazardous waste)) - notification Organizations: WHITLEY JAMES (CONTACT/OWNER)
ARCHIRAL COLOR COMPANY (5445 HIGHWAY 9 in FELTON, CA)
Small Quantity Generators, between 100 kg and 1000 kg of hazardous waste/month (Resource Conservation and Recovery Act (tracking hazardous waste))
GRANITE CONSTRUCTION CO. (SAN LORENZO AVENUE in FELTON, CA)
CRITERIA AND HAZARDOUS AIR POLLUTANT INVENTORY (Inventory of air pollution sources) Business SIC classification: CRUSHED AND BROKEN GRANITE
GRANITE ROCK CO. (QUAIL HOLLOW RD in FELTON, CA)
CRITERIA AND HAZARDOUS AIR POLLUTANT INVENTORY (Inventory of air pollution sources) Business SIC classification: CONSTRUCTION SAND AND GRAVEL
HILLSIDE HOME (6346 ASHLEY ST in FELTON, CA)
COMPLIANCE ACTIVITY (Tracking inspections of insecticide, fungicide, and rodenticide, and toxic substances)
Housing units lacking complete plumbing facilities: 4.3% Housing units lacking complete kitchen facilities: 4.5%
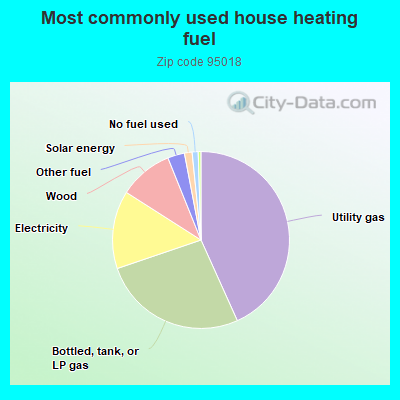
43.4%Utility gas
26.6%Bottled, tank, or LP gas
14.3%Electricity
9.9%Wood
3.1%Other fuel
1.4%Solar energy
1.1%No fuel used
Population in 1990: 8,194. Population change in the 1990s: +526 (+6.4%).
Place of birth for U.S.-born residents:
This state: 4,010
Northeast: 423
Midwest: 340
South: 332
West: 362
52% of the 95018 zip code residents lived in the same house 5 years ago. Out of people who lived in different houses, 38% lived in this county. Out of people who lived in different counties, 50% lived in California.
93% of the 95018 zip code residents lived in the same house 1 year ago. Out of people who lived in different houses, 68% moved from this county. Out of people who lived in different houses, 27% moved from different county within same state. Out of people who lived in different houses, 4% moved from abroad.
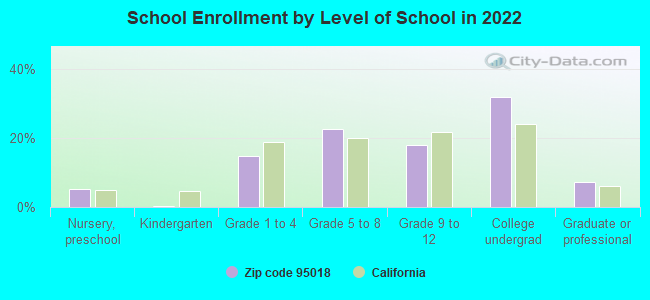
Private vs. public school enrollment:
Students in private schools in grades 1 to 8 (elementary and middle school): 36
Here:
8.0%
California:
10.5%
Students in private schools in grades 9 to 12 (high school): 5
Here:
2.7%
California:
8.5%
Students in private undergraduate colleges: 114
Here:
29.2%
California:
15.9%
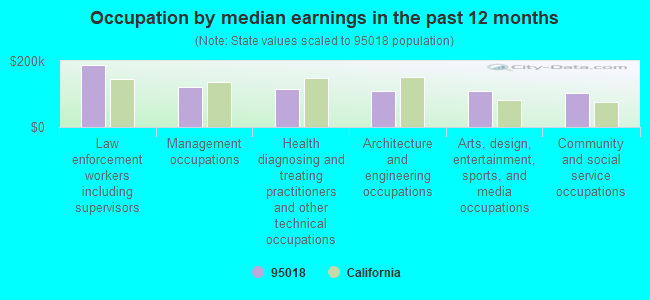
Occupation by median earnings in the past 12 months ($)
187,958Law enforcement workers including supervisors
120,237Management occupations
114,712Health diagnosing and treating practitioners and other technical occupations
109,859Architecture and engineering occupations
108,267Arts, design, entertainment, sports, and media occupations
102,097Community and social service occupations
Companies with federal contracts located in this zip code:
PROS TECHNOLOGY INC (561 MADRONA AVE in FELTON, CA; small business)
$20,282 with Navy for Installation of Equipment -- Communication, Detection, and Coherent Radiation Equipment. Signed on 2003-01-22. Completion date: 2003-01-25.
N2 GROUP, INC (1 TERRACE WAY in FELTON, CA; small business)
$18,435 with Army for ADPE System Configuration. Taking place in VA. Signed on 2005-09-23. Completion date: 2005-10-27.
ADAPTIVE COMMUNICATIONS BUSIN (6600 HWY 9 in FELTON, CA; small business)
$2,752 with Army for Headsets, Handsets, Microphones and Speakers. Taking place in VA. Signed on 2004-06-02. Completion date: 2004-06-30.
Top industries in this zip code by the number of employees in 2005:
2005 - 2018 National Fire Incident Reporting System (NFIRS) incidents
According to the data from the years 2005 - 2018 the average number of fire incidents per year is 31. The highest number of fire incidents - 67 took place in 2007, and the least - 11 in 2006. The data has a growing trend.
When looking into fire subcategories, the most incidents belonged to: Outside Fires (37.4%), and Structure Fires (31.9%).
Fire incident types reported to NFIRS in Zip Code 95018


 Nearest zip codes: 95041, 95005, 95066, 95007, 95060, 95064.
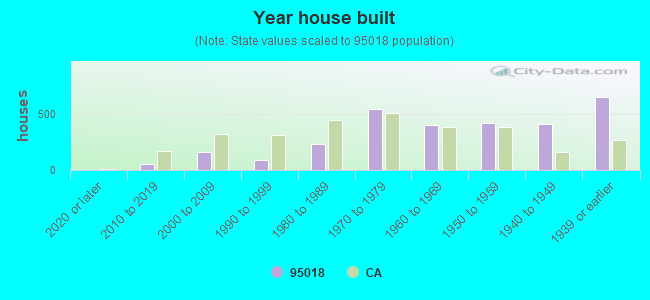


 According to the data from the years 2005 - 2018 the average number of fire incidents per year is 31. The highest number of fire incidents - 67 took place in 2007, and the least - 11 in 2006. The data has a growing trend.
 When looking into fire subcategories, the most incidents belonged to: Outside Fires (37.4%), and Structure Fires (31.9%).