Estimated zip code population in 2022: 48,736 Zip code population in 2010: 42,675 Zip code population in 2000: 36,728
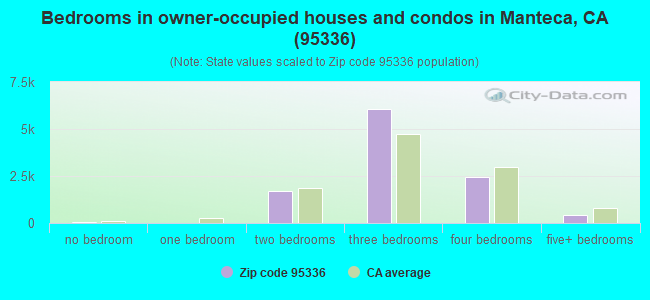
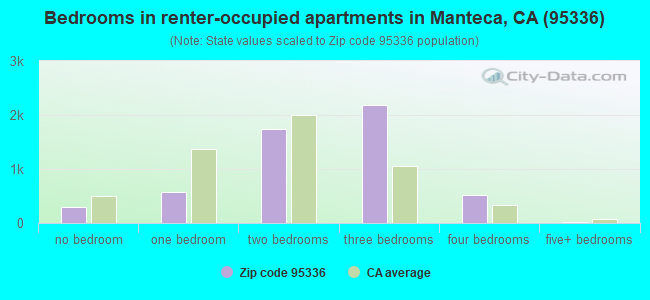
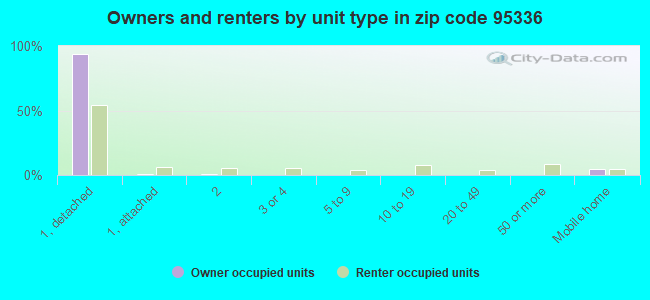
Houses and condos: 16,948 Renter-occupied apartments: 5,328
% of renters here:
33%
State:
44%
March 2022 cost of living index in zip code 95336: 100.5 (near average, U.S. average is 100)
Land area: 38.3 sq. mi. Water area: 0.0 sq. mi.
Population density: 1,273 people per square mile
(low).
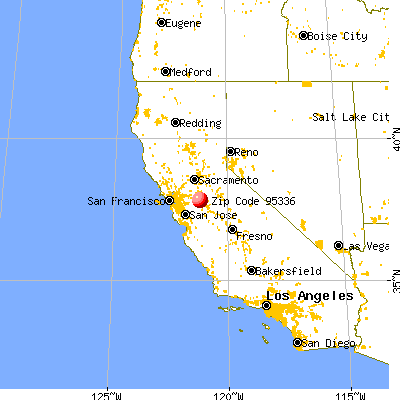
OSM Map
General Map
Google Map
MSN Map
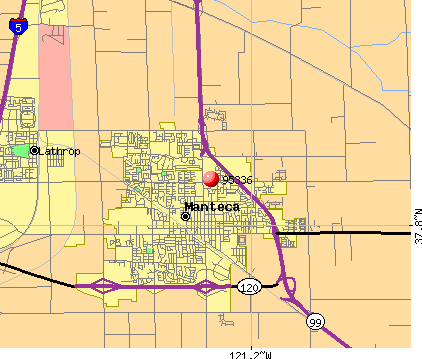
OSM Map
General Map
Google Map
MSN Map
OSM Map
General Map
Google Map
MSN Map
OSM Map
General Map
Google Map
MSN Map
Please wait while loading the map...
Real estate property taxes paid for housing units in 2022:
This zip code:
0.7% ($3,660)
California:
0.7% ($4,831)
Median real estate property taxes paid for housing units with mortgages in 2022: $3,921 (0.7%) Median real estate property taxes paid for housing units with no mortgage in 2022: $2,825 (0.6%)
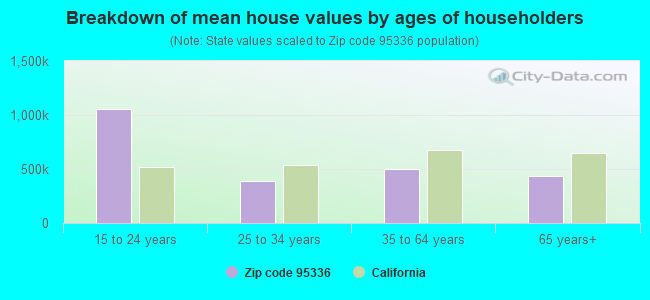
Estimated median house/condo value in 2022: $517,081
95336:
$517,081
California:
$715,900
According to our research of California and other state lists, there were 76 registered sex offenders living in 95336 zip code as of April 26, 2024. The ratio of all residents to sex offenders in zip code 95336 is 638 to 1. The ratio of registered sex offenders to all residents in this zip code is near the state average.
Median resident age:
This zip code:
38.7 years
California median age:
37.9 years
Average household size:
This zip code:
3.0 people
California:
2.8 people
Averages for the 2020 tax year for zip code 95336, filed in 2021:
Average Adjusted Gross Income (AGI) in 2020: $65,377 (Individual Income Tax Returns)
Here:
$65,377
State:
$95,910
Salary/wage: $55,451 (reported on 79.2% of returns)
Here:
$55,451
State:
$77,331
(% of AGI for various income ranges: 1206.0% for AGIs below $25k, 3785.3% for AGIs $25k-50k, 6973.7% for AGIs $50k-75k, 9928.9% for AGIs $75k-100k, 18338.5% for AGIs $100k-200k, 58952.4% for AGIs over 200k)
Taxable interest for individuals: $1,064 (reported on 34.0% of returns)
This zip code:
$1,064
California:
$2,294
(% of AGI for various income ranges: 12.8% for AGIs below $25k, 17.9% for AGIs $25k-50k, 24.4% for AGIs $50k-75k, 46.9% for AGIs $75k-100k, 86.4% for AGIs $100k-200k, 1931.0% for AGIs over 200k)
Ordinary dividends: $5,249 (reported on 11.7% of returns)
Here:
$5,249
State:
$10,949
(% of AGI for various income ranges: 22.5% for AGIs below $25k, 23.1% for AGIs $25k-50k, 59.1% for AGIs $50k-75k, 90.2% for AGIs $75k-100k, 199.7% for AGIs $100k-200k, 2596.2% for AGIs over 200k)
Net capital gain/loss in AGI: +$18,254 (reported on 11.7% of returns)
Here:
+$18,254
State:
+$49,306
(% of AGI for various income ranges: 5.4% for AGIs below $25k, 9.7% for AGIs $25k-50k, 54.8% for AGIs $50k-75k, 106.2% for AGIs $75k-100k, 458.5% for AGIs $100k-200k, 17602.9% for AGIs over 200k)
Profit/loss from business: +$11,686 (reported on 13.2% of returns)
Here:
+$11,686
State:
+$15,671
(% of AGI for various income ranges: 123.3% for AGIs below $25k, 228.3% for AGIs $25k-50k, 232.7% for AGIs $50k-75k, 179.5% for AGIs $75k-100k, 301.7% for AGIs $100k-200k, 3063.3% for AGIs over 200k)
Taxable individual retirement arrangement distribution: $18,636 (reported on 7.6% of returns)
95336:
$18,636
California:
$23,505
(% of AGI for various income ranges: 45.2% for AGIs below $25k, 86.8% for AGIs $25k-50k, 168.6% for AGIs $50k-75k, 329.1% for AGIs $75k-100k, 649.1% for AGIs $100k-200k, 2503.8% for AGIs over 200k)
Self-employed (Keogh) retirement plans: $19,400 (reported on 0.2% of returns)
95336:
$19,400
California:
$30,163
(% of AGI for various income ranges: 40.4% for AGIs $100k-200k)
Total itemized deductions: $30,341 (reported on 12.0% of returns)
Here:
$30,341
State:
$39,517
(% of AGI for various income ranges: 73.9% for AGIs below $25k, 158.4% for AGIs $25k-50k, 481.9% for AGIs $50k-75k, 809.4% for AGIs $75k-100k, 1568.1% for AGIs $100k-200k, 9139.0% for AGIs over 200k)
Charity contributions: $7,491 (reported on 9.6% of returns)
Here:
$7,491
State:
$12,598
(% of AGI for various income ranges: 5.3% for AGIs below $25k, 15.2% for AGIs $25k-50k, 49.5% for AGIs $50k-75k, 85.8% for AGIs $75k-100k, 273.3% for AGIs $100k-200k, 3807.6% for AGIs over 200k)
Taxes paid: $8,182 (reported on 11.9% of returns)
95336:
$8,182
State:
$8,807
(% of AGI for various income ranges: 14.3% for AGIs below $25k, 37.7% for AGIs $25k-50k, 134.4% for AGIs $50k-75k, 259.1% for AGIs $75k-100k, 495.7% for AGIs $100k-200k, 1617.1% for AGIs over 200k)
Earned income credit: $2,110 (reported on 13.3% of returns)
Here:
$2,110
State:
$2,074
(% of AGI for various income ranges: 79.1% for AGIs below $25k, 68.9% for AGIs $25k-50k, 0.9% for AGIs $50k-75k)
Percentage of individuals using paid preparers for their 2020 taxes: 94.0%
Here:
94%
State:
92%
(% for various income ranges: 93.2% for AGIs below $25k, 94.4% for AGIs $25k-50k, 93.9% for AGIs $50k-75k, 94.9% for AGIs $75k-100k, 94.7% for AGIs $100k-200k, 94.4% for AGIs over 200k)
Averages for the 2012 tax year for zip code 95336, filed in 2013:
Average Adjusted Gross Income (AGI) in 2012: $51,333 (Individual Income Tax Returns)
Here:
$51,333
State:
$72,726
Salary/wage: $44,232 (reported on 81.5% of returns)
Here:
$44,232
State:
$59,079
(% of AGI for various income ranges: 69.2% for AGIs below $25k, 75.3% for AGIs $25k-50k, 75.8% for AGIs $50k-75k, 73.5% for AGIs $75k-100k, 75.1% for AGIs $100k-200k, 34.7% for AGIs over 200k)
Taxable interest for individuals: $944 (reported on 35.0% of returns)
This zip code:
$944
California:
$2,146
(% of AGI for various income ranges: 0.8% for AGIs below $25k, 0.5% for AGIs $25k-50k, 0.4% for AGIs $50k-75k, 0.5% for AGIs $75k-100k, 0.5% for AGIs $100k-200k, 1.7% for AGIs over 200k)
Ordinary dividends: $4,457 (reported on 12.0% of returns)
Here:
$4,457
State:
$9,308
(% of AGI for various income ranges: 0.9% for AGIs below $25k, 0.6% for AGIs $25k-50k, 0.5% for AGIs $50k-75k, 0.7% for AGIs $75k-100k, 0.7% for AGIs $100k-200k, 4.4% for AGIs over 200k)
Net capital gain/loss in AGI: +$6,078 (reported on 9.9% of returns)
Here:
+$6,078
State:
+$30,460
(% of AGI for various income ranges: 0.1% for AGIs $25k-50k, 0.5% for AGIs $75k-100k, 1.0% for AGIs $100k-200k, 7.7% for AGIs over 200k)
Profit/loss from business: +$11,975 (reported on 12.3% of returns)
Here:
+$11,975
State:
+$17,064
(% of AGI for various income ranges: 7.9% for AGIs below $25k, 4.1% for AGIs $25k-50k, 2.0% for AGIs $50k-75k, 1.2% for AGIs $75k-100k, 1.8% for AGIs $100k-200k, 3.1% for AGIs over 200k)
Taxable individual retirement arrangement distribution: $15,484 (reported on 9.0% of returns)
95336:
$15,484
California:
$19,557
(% of AGI for various income ranges: 2.9% for AGIs below $25k, 2.1% for AGIs $25k-50k, 2.1% for AGIs $50k-75k, 2.5% for AGIs $75k-100k, 3.0% for AGIs $100k-200k, 4.2% for AGIs over 200k)
Self-employment retirement plans: $20,960 (reported on 0.3% of returns)
95336:
$20,960
California:
$24,530
Total itemized deductions: $22,203 (25% of AGI, reported on 33.9% of returns)
Here:
$22,203
State:
$34,004
Here:
24.6% of AGI
State:
22.7% of AGI
(% of AGI for various income ranges: 10.7% for AGIs below $25k, 11.2% for AGIs $25k-50k, 14.3% for AGIs $50k-75k, 16.5% for AGIs $75k-100k, 17.4% for AGIs $100k-200k, 14.9% for AGIs over 200k)
Charity contributions: $2,903 (reported on 28.1% of returns)
Here:
$2,903
State:
$4,659
(% of AGI for various income ranges: 0.6% for AGIs below $25k, 1.0% for AGIs $25k-50k, 1.5% for AGIs $50k-75k, 1.8% for AGIs $75k-100k, 2.1% for AGIs $100k-200k, 2.1% for AGIs over 200k)
Taxes paid: $7,213 (reported on 33.8% of returns)
95336:
$7,213
State:
$14,448
(% of AGI for various income ranges: 1.9% for AGIs below $25k, 2.4% for AGIs $25k-50k, 3.6% for AGIs $50k-75k, 4.7% for AGIs $75k-100k, 6.4% for AGIs $100k-200k, 9.1% for AGIs over 200k)
Earned income credit: $2,237 (reported on 19.6% of returns)
Here:
$2,237
State:
$2,286
(% of AGI for various income ranges: 6.6% for AGIs below $25k, 1.3% for AGIs $25k-50k)
Percentage of individuals using paid preparers for their 2012 taxes: 61.0%
Here:
61%
State:
64%
(% for various income ranges: 56.0% for AGIs below $25k, 62.4% for AGIs $25k-50k, 62.8% for AGIs $50k-75k, 65.2% for AGIs $75k-100k, 66.3% for AGIs $100k-200k, 82.6% for AGIs over 200k)
Averages for the 2004 tax year for zip code 95336, filed in 2005:
Average Adjusted Gross Income (AGI) in 2004: $46,686 (Individual Income Tax Returns)
Here:
$46,686
State:
$58,600
Salary/wage: $42,238 (reported on 86.3% of returns)
Here:
$42,238
State:
$49,455
(% of AGI for various income ranges: 125.3% for AGIs below $10k, 74.4% for AGIs $10k-25k, 82.2% for AGIs $25k-50k, 84.6% for AGIs $50k-75k, 86.1% for AGIs $75k-100k, 64.5% for AGIs over 100k)
Taxable interest for individuals: $1,257 (reported on 43.5% of returns)
This zip code:
$1,257
California:
$2,365
(% of AGI for various income ranges: 4.3% for AGIs below $10k, 1.3% for AGIs $10k-25k, 0.9% for AGIs $25k-50k, 0.6% for AGIs $50k-75k, 0.7% for AGIs $75k-100k, 1.9% for AGIs over 100k)
Taxable dividends: $1,960 (reported on 14.3% of returns)
Here:
$1,960
State:
$4,746
(% of AGI for various income ranges: 2.1% for AGIs below $10k, 0.7% for AGIs $10k-25k, 0.4% for AGIs $25k-50k, 0.3% for AGIs $50k-75k, 0.3% for AGIs $75k-100k, 1.1% for AGIs over 100k)
Net capital gain/loss: +$14,352 (reported on 11.8% of returns)
Here:
+$14,352
State:
+$23,418
(% of AGI for various income ranges: -1.5% for AGIs below $10k, 0.1% for AGIs $10k-25k, 0.5% for AGIs $25k-50k, 0.6% for AGIs $50k-75k, 1.0% for AGIs $75k-100k, 10.9% for AGIs over 100k)
Profit/loss from business: +$12,889 (reported on 12.0% of returns)
Here:
+$12,889
State:
+$16,826
(% of AGI for various income ranges: -8.8% for AGIs below $10k, 5.1% for AGIs $10k-25k, 3.8% for AGIs $25k-50k, 2.1% for AGIs $50k-75k, 2.6% for AGIs $75k-100k, 4.3% for AGIs over 100k)
IRA payment deduction: $2,904 (reported on 1.7% of returns)
95336:
$2,904
California:
$3,192
(% of AGI for various income ranges: 0.2% for AGIs $10k-25k, 0.1% for AGIs $25k-50k, 0.1% for AGIs $50k-75k, 0.1% for AGIs $75k-100k, 0.1% for AGIs over 100k)
Self-employed pension: $11,400 (reported on 0.4% of returns)
Here:
$11,400
California:
$17,688
(% of AGI for various income ranges: 0.0% for AGIs $25k-50k, 0.0% for AGIs $50k-75k, 0.1% for AGIs $75k-100k, 0.3% for AGIs over 100k)
Total itemized deductions: $21,397 (28% of AGI, reported on 41.6% of returns)
Here:
$21,397
State:
$28,113
Here:
27.9% of AGI
State:
25.3% of AGI
(% of AGI for various income ranges: 22.6% for AGIs below $10k, 12.1% for AGIs $10k-25k, 17.1% for AGIs $25k-50k, 22.1% for AGIs $50k-75k, 22.7% for AGIs $75k-100k, 17.7% for AGIs over 100k)
Charity contributions deductions: $2,367 (3% of AGI, reported on 36.4% of returns)
Here:
$2,367
State:
$3,923
Here:
3.0% of AGI
State:
3.3% of AGI
(% of AGI for various income ranges: 0.9% for AGIs below $10k, 0.9% for AGIs $10k-25k, 1.4% for AGIs $25k-50k, 1.8% for AGIs $50k-75k, 2.3% for AGIs $75k-100k, 2.2% for AGIs over 100k)
Total tax: $6,056 (reported on 74.4% of returns)
95336:
$6,056
State:
$10,761
(% of AGI for various income ranges: 3.3% for AGIs below $10k, 3.8% for AGIs $10k-25k, 5.9% for AGIs $25k-50k, 7.4% for AGIs $50k-75k, 9.0% for AGIs $75k-100k, 16.3% for AGIs over 100k)
Earned income credit: $1,676 (reported on 14.8% of returns)
Here:
$1,676
State:
$1,763
Percentage of individuals using paid preparers for their 2004 taxes: 65.4%
Here:
65%
State:
66%
(% for various income ranges: 51.7% for AGIs below $10k, 64.7% for AGIs $10k-25k, 67.8% for AGIs $25k-50k, 70.2% for AGIs $50k-75k, 68.5% for AGIs $75k-100k, 73.4% for AGIs over 100k)
Likely homosexual households (counted as self-reported same-sex unmarried-partner households)
Lesbian couples: 0.1% of all households
Gay men: 0.0% of all households
Household received Food Stamps/SNAP in the past 12 months: 2,001 Household did not receive Food Stamps/SNAP in the past 12 months: 14,078
Women who had a birth in the past 12 months: 611 (439 now married, 171 unmarried) Women who did not have a birth in the past 12 months: 10,693 (3,986 now married, 6,717 unmarried)
Housing units in zip code 95336 with a mortgage: 7,352 (590 second mortgage, 11 home equity loan, 470 both second mortgage and home equity loan) Houses without a mortgage: 85
Median monthly owner costs for units with a mortgage: $2,154 Median monthly owner costs for units without a mortgage: $631
Residents with income below the poverty level in 2022:
This zip code:
9.9%
Whole state:
12.2%
Residents with income below 50% of the poverty level in 2022:
This zip code:
4.3%
Whole state:
6.2%
Median number of rooms in houses and condos:
Here:
6.0
State:
6.0
Median number of rooms in apartments:
Here:
4.9
State:
3.9
Notable locations in this zip code not listed on our city pages
Notable locations in zip code 95336: Ripon Poultry Farm (A), San Joaquin Delta College Farm Laboratory (B), Manteca District Ambulance Service (C), Lathrop - Manteca Fire Protection District Station 33 New Haven (D), Manteca Fire Department Station 3 (E), Manteca Fire Department Station 1 (F), Manteca City Hall (G), Manteca Branch Stockton-San Joaquin County Public Library (H). Display/hide their locations on the map
Shopping Centers: Lucky-Long Shopping Center (1), Cardoza Shopping Center (2), Raleys Union Square Shopping Center (3), Lincoln Shopping Center (4). Display/hide their locations on the map
Churches in zip code 95336 include: The Church of Jesus Christ of Latter Day Saints (A), First Assembly of God Church (B), First Baptist Church (C), First Christian Church (D), First Missionary Baptist Church (E), Manteca First Church of the Nazarene (F), North Side Church of Christ (G), Northgate Community Brethren Church (H), Pentecostal Church of God (I). Display/hide their locations on the map
Parks in zip code 95336 include: Button Estates Park (1), Doxey Park (2), North Gate Park (3), Raymus Village Park (4), Saint Francis Park (5), Baymeadows Park (6), Colony Park (7), Crestwood Park (8), Franciscan Park (9). Display/hide their locations on the map
5,524 married couples with children.
3,071 single-parent households (1,440 men, 1,631 women).
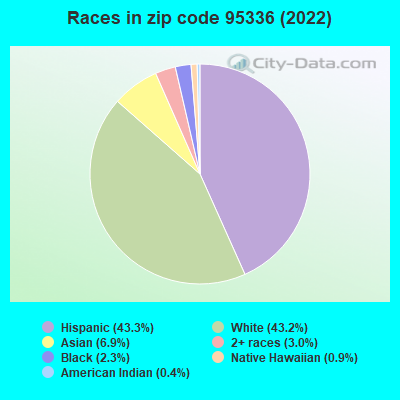
69.7% of residents of 95336 zip code speak English at home.
23.1% of residents speak Spanish at home (60% very well, 22% well, 11% not well, 6% not at all).
2.8% of residents speak other Indo-European language at home (50% very well, 32% well, 11% not well, 7% not at all).
3.9% of residents speak Asian or Pacific Island language at home (57% very well, 24% well, 18% not well, 1% not at all).
0.1% of residents speak other language at home (75% very well, 21% well, 4% not well).
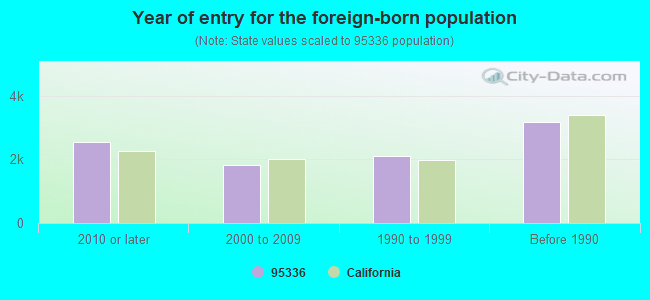
Foreign born population: 8,316 (17.1%) (54.3% of them are naturalized citizens)
Major facilities with environmental interests located in this zip code:
FORWARD INCORPORATED DISPOSAL SITE (9999 SOUTH AUSTIN ROAD in MANTECA, CA)
AIR MAJOR (AIRS/AFS) STATE MASTER (California Solid Waste disposal sites tracking) - REFUSE DISPOSAL CRITERIA AND HAZARDOUS AIR POLLUTANT INVENTORY (Inventory of air pollution sources) TSD (Resource Conservation and Recovery Act (tracking hazardous waste)) REFUSE DISPOSAL (Solid waste facilities tracking) Business SIC classification: REFUSE SYSTEMS Business NAICS classification: SOLID WASTE LANDFILL. Organizations: FORWARD, INC./ALLIED WASTE NORTH AMERICA (CONTACT/OPERATOR)
, FOREWARD INC (CONTACT/OPERATOR)
Alternative names: FORWARD, INC, FORWARD DSPL SITE
MANTECA FORD MERCURY INC (555 N MAIN ST in MANTECA, CA)
STATE MASTER (California - Hazardous Waste Tracking) - HAZARDOU WASTE PROGRAM Small Quantity Generators, between 100 kg and 1000 kg of hazardous waste/month (Resource Conservation and Recovery Act (tracking hazardous waste)) - notification
CABRAL WESTERN MOTORS (1115 W YOSEMITE AVE in MANTECA, CA)
STATE MASTER (California - Hazardous Waste Tracking) - HAZARDOU WASTE PROGRAM Small Quantity Generators, between 100 kg and 1000 kg of hazardous waste/month (Resource Conservation and Recovery Act (tracking hazardous waste)) - notification Organizations: BILL CABRAL (CONTACT/OWNER)
FRENCH CLEANERS (416 WEST YOSEMITE in MANTECA, CA)
STATE MASTER (California - Hazardous Waste Tracking) - HAZARDOU WASTE PROGRAM CRITERIA AND HAZARDOUS AIR POLLUTANT INVENTORY (Inventory of air pollution sources) Small Quantity Generators, between 100 kg and 1000 kg of hazardous waste/month (Resource Conservation and Recovery Act (tracking hazardous waste)) Business SIC classification: DRYCLEANING PLANTS, EXCEPT RUG CLEANING
MOTOR GUARD CORP (580 CARNEGIE ST in MANTECA, CA)
STATE MASTER (California - Hazardous Waste Tracking) - HAZARDOU WASTE PROGRAM Small Quantity Generators, between 100 kg and 1000 kg of hazardous waste/month (Resource Conservation and Recovery Act (tracking hazardous waste)) - notification
CHEVRON STATION NO 209167 (1234 YOSEMITE AVE in MANTECA, CA)
STATE MASTER (California - Hazardous Waste Tracking) - HAZARDOU WASTE PROGRAM Small Quantity Generators, between 100 kg and 1000 kg of hazardous waste/month (Resource Conservation and Recovery Act (tracking hazardous waste)) - notification Organizations: CHEVRON PRODUCTS CO (CONTACT/OWNER)
G B INDUSTRIAL SPRAY INC (1140 BESSEMER AVE NO 1 in MANTECA, CA)
STATE MASTER (California - Hazardous Waste Tracking) - HAZARDOU WASTE PROGRAM Small Quantity Generators, between 100 kg and 1000 kg of hazardous waste/month (Resource Conservation and Recovery Act (tracking hazardous waste)) - notification Organizations: GARY BEAUCHAMP (CONTACT/OWNER)
MOUNTAIN VALLEY EXPRESS CO INC (1019 BESSEMER DR in MANTECA, CA)
STATE MASTER (California - Hazardous Waste Tracking) - HAZARDOU WASTE PROGRAM Small Quantity Generators, between 100 kg and 1000 kg of hazardous waste/month (Resource Conservation and Recovery Act (tracking hazardous waste)) - notification Organizations: CHARLES GILES (CONTACT/OWNER)
LINCOLN ELEMENTARY (750 E. YOSEMITE AVE. in MANTECA, CA)
(National Center for Education Statistics) - STATE ID-6042345 Organizations: MANTECA UNIFIED (SCHOOL DISTRICT)
GOLDEN WEST ELEMENTARY (1111 N. MAIN ST. in MANTECA, CA)
(National Center for Education Statistics) - STATE ID-6042329 Organizations: MANTECA UNIFIED (SCHOOL DISTRICT)
HAFLEY (NEIL) ELEMENTARY (849 NORTHGATE AVE. in MANTECA, CA)
(National Center for Education Statistics) - STATE ID-6104533 Organizations: MANTECA UNIFIED (SCHOOL DISTRICT)
CALLA HIGH (CONT.) (10500 E. HWY. 120 in MANTECA, CA)
(National Center for Education Statistics) - STATE ID-3935111 Organizations: MANTECA UNIFIED (SCHOOL DISTRICT)
MANTECA COMMUNITY DAY (7-12) (680 MIKESELL AVE. in MANTECA, CA)
(National Center for Education Statistics) - STATE ID-3930328 Organizations: MANTECA UNIFIED (SCHOOL DISTRICT)
Housing units lacking complete plumbing facilities: 0.1% Housing units lacking complete kitchen facilities: 1.2%
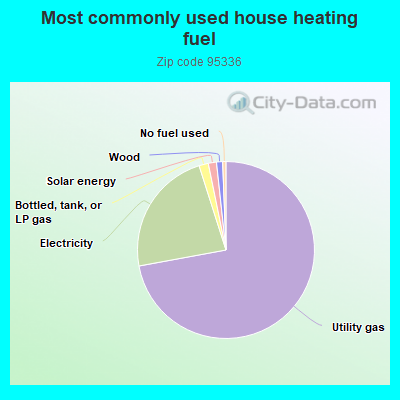
71.9%Utility gas
22.9%Electricity
1.7%Bottled, tank, or LP gas
1.5%Solar energy
1.1%Wood
0.6%No fuel used
Population in 1990: 51,728.
Place of birth for U.S.-born residents:
This state: 33,722
Northeast: 849
Midwest: 1,718
South: 1,399
West: 1,514
51% of the 95336 zip code residents lived in the same house 5 years ago. Out of people who lived in different houses, 57% lived in this county. Out of people who lived in different counties, 50% lived in California.
92% of the 95336 zip code residents lived in the same house 1 year ago. Out of people who lived in different houses, 55% moved from this county. Out of people who lived in different houses, 41% moved from different county within same state. Out of people who lived in different houses, 3% moved from different state. Out of people who lived in different houses, 1% moved from abroad.
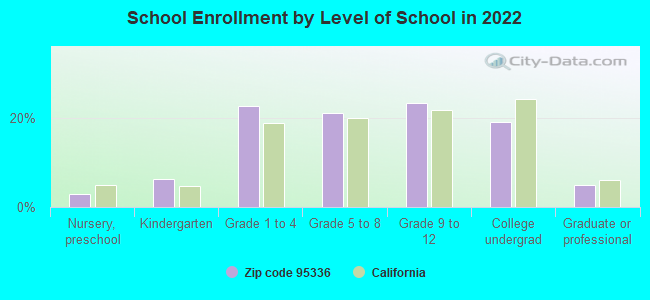
Private vs. public school enrollment:
Students in private schools in grades 1 to 8 (elementary and middle school): 225
Here:
4.5%
California:
10.5%
Students in private schools in grades 9 to 12 (high school): 71
Here:
2.7%
California:
8.5%
Students in private undergraduate colleges: 178
Here:
8.2%
California:
15.9%
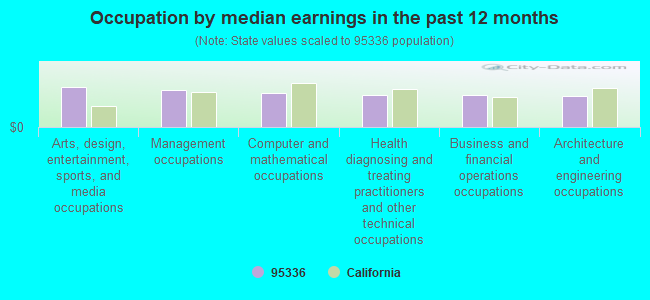
Occupation by median earnings in the past 12 months ($)
92,039Arts, design, entertainment, sports, and media occupations
85,264Management occupations
79,561Computer and mathematical occupations
74,405Health diagnosing and treating practitioners and other technical occupations
74,281Business and financial operations occupations
72,758Architecture and engineering occupations
Companies with federal contracts located in this zip code:
WATTS EQUIPMENT COMPANY INC (9727 MOFFAT BLVD in MANTECA, CA)
$31,200 with Army for Warehouse Trucks and Tractors, Self-Propelled. Signed on 2005-02-16. Completion date: 2005-06-15.
SHAWVER METAL TECH INC (881 MOFFAT BLVD in MANTECA, CA; small business)
$4,112 with Defense Logistics Agency for Hazardous Substance Removal, Cleanup, and Disposal Services and Operational Support. Signed on 2006-01-25. Completion date: 2006-02-13.
Top industries in this zip code by the number of employees in 2005:
Health Care and Social Assistance: General Medical and Surgical Hospitals (250-499 employees: 2 establishments)
2002 - 2018 National Fire Incident Reporting System (NFIRS) incidents
According to the data from the years 2002 - 2018 the average number of fire incidents per year is 155. The highest number of fires - 318 took place in 2007, and the least - 0 in 2003. The data has a rising trend.
When looking into fire subcategories, the most incidents belonged to: Outside Fires (50.4%), and Structure Fires (29.3%).
Fire incident types reported to NFIRS in Zip Code 95336


 Nearest zip codes: 95337, 95231, 95366, 95330, 95215, 95205.


 According to the data from the years 2002 - 2018 the average number of fire incidents per year is 155. The highest number of fires - 318 took place in 2007, and the least - 0 in 2003. The data has a rising trend.
 When looking into fire subcategories, the most incidents belonged to: Outside Fires (50.4%), and Structure Fires (29.3%).