Estimated zip code population in 2022: 29,801 Zip code population in 2010: 17,853 Zip code population in 2000: 10,819
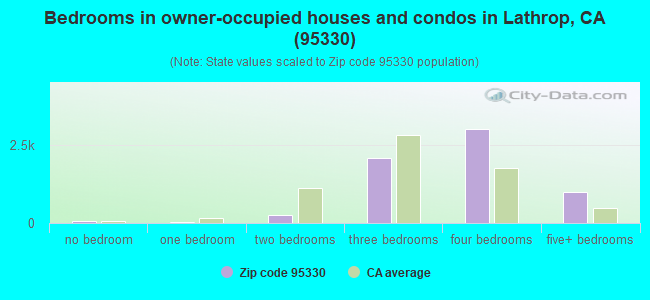
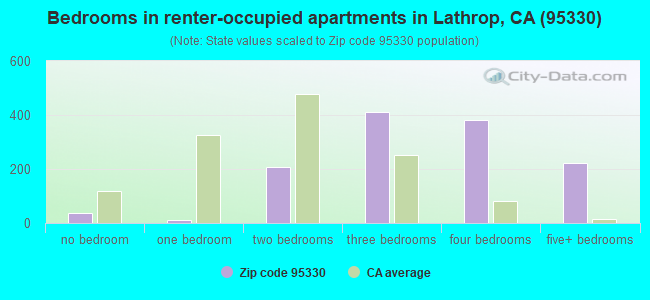
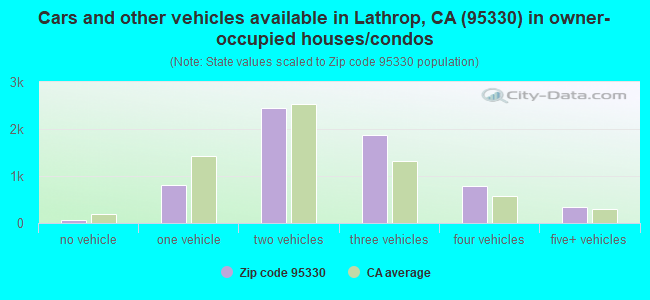
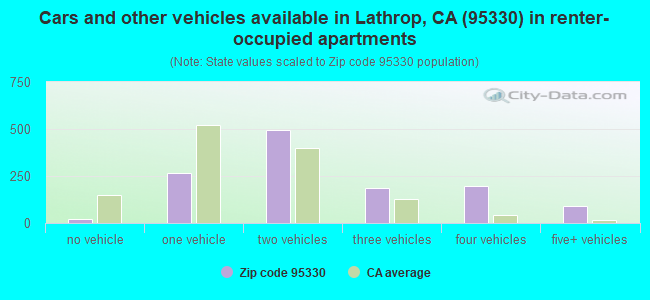
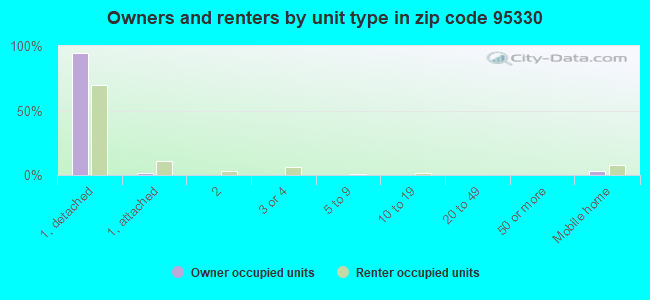
Houses and condos: 8,079 Renter-occupied apartments: 1,260
% of renters here:
17%
State:
44%
March 2022 cost of living index in zip code 95330: 100.7 (near average, U.S. average is 100)
Land area: 21.5 sq. mi. Water area: 0.5 sq. mi.
Population density: 1,385 people per square mile
(low).
OSM Map
General Map
Google Map
MSN Map
OSM Map
General Map
Google Map
MSN Map
OSM Map
General Map
Google Map
MSN Map
OSM Map
General Map
Google Map
MSN Map
Please wait while loading the map...
Real estate property taxes paid for housing units in 2022:
This zip code:
1.0% ($5,828)
California:
0.7% ($4,831)
Median real estate property taxes paid for housing units with mortgages in 2022: $6,238 (1.0%) Median real estate property taxes paid for housing units with no mortgage in 2022: $3,231 (0.6%)
Averages for the 2020 tax year for zip code 95330, filed in 2021:
Average Adjusted Gross Income (AGI) in 2020: $74,120 (Individual Income Tax Returns)
Here:
$74,120
State:
$95,910
Salary/wage: $68,719 (reported on 86.7% of returns)
Here:
$68,719
State:
$77,331
(% of AGI for various income ranges: 1216.3% for AGIs below $25k, 3920.5% for AGIs $25k-50k, 7547.0% for AGIs $50k-75k, 10784.8% for AGIs $75k-100k, 21423.3% for AGIs $100k-200k, 80932.9% for AGIs over 200k)
Taxable interest for individuals: $512 (reported on 33.1% of returns)
This zip code:
$512
California:
$2,294
(% of AGI for various income ranges: 6.4% for AGIs below $25k, 13.4% for AGIs $25k-50k, 10.1% for AGIs $50k-75k, 11.6% for AGIs $75k-100k, 53.0% for AGIs $100k-200k, 392.9% for AGIs over 200k)
Ordinary dividends: $1,217 (reported on 8.5% of returns)
Here:
$1,217
State:
$10,949
(% of AGI for various income ranges: 3.2% for AGIs below $25k, 8.3% for AGIs $25k-50k, 7.5% for AGIs $50k-75k, 13.9% for AGIs $75k-100k, 36.4% for AGIs $100k-200k, 177.1% for AGIs over 200k)
Net capital gain/loss in AGI: +$17,292 (reported on 11.5% of returns)
Here:
+$17,292
State:
+$49,306
(% of AGI for various income ranges: 4.2% for AGIs below $25k, 14.4% for AGIs $25k-50k, 26.7% for AGIs $50k-75k, 90.7% for AGIs $75k-100k, 294.5% for AGIs $100k-200k, 10072.9% for AGIs over 200k)
Profit/loss from business: +$11,499 (reported on 16.7% of returns)
Here:
+$11,499
State:
+$15,671
(% of AGI for various income ranges: 150.5% for AGIs below $25k, 433.5% for AGIs $25k-50k, 301.4% for AGIs $50k-75k, 219.0% for AGIs $75k-100k, 267.3% for AGIs $100k-200k, 1159.5% for AGIs over 200k)
Taxable individual retirement arrangement distribution: $16,700 (reported on 2.9% of returns)
95330:
$16,700
California:
$23,505
(% of AGI for various income ranges: 20.0% for AGIs below $25k, 35.5% for AGIs $25k-50k, 68.1% for AGIs $50k-75k, 51.4% for AGIs $75k-100k, 187.5% for AGIs $100k-200k, 561.9% for AGIs over 200k)
Self-employed (Keogh) retirement plans: $17,550 (reported on 0.1% of returns)
95330:
$17,550
California:
$30,163
(% of AGI for various income ranges: 35.5% for AGIs $75k-100k)
Total itemized deductions: $29,802 (reported on 16.6% of returns)
Here:
$29,802
State:
$39,517
(% of AGI for various income ranges: 53.9% for AGIs below $25k, 194.5% for AGIs $25k-50k, 595.6% for AGIs $50k-75k, 972.7% for AGIs $75k-100k, 2111.8% for AGIs $100k-200k, 6282.9% for AGIs over 200k)
Charity contributions: $5,156 (reported on 12.8% of returns)
Here:
$5,156
State:
$12,598
(% of AGI for various income ranges: 3.6% for AGIs below $25k, 14.5% for AGIs $25k-50k, 56.2% for AGIs $50k-75k, 97.4% for AGIs $75k-100k, 296.4% for AGIs $100k-200k, 1182.9% for AGIs over 200k)
Taxes paid: $9,247 (reported on 16.6% of returns)
95330:
$9,247
State:
$8,807
(% of AGI for various income ranges: 14.0% for AGIs below $25k, 55.8% for AGIs $25k-50k, 197.2% for AGIs $50k-75k, 331.7% for AGIs $75k-100k, 663.2% for AGIs $100k-200k, 1752.9% for AGIs over 200k)
Earned income credit: $2,012 (reported on 13.3% of returns)
Here:
$2,012
State:
$2,074
(% of AGI for various income ranges: 79.5% for AGIs below $25k, 70.5% for AGIs $25k-50k, 1.2% for AGIs $50k-75k)
Percentage of individuals using paid preparers for their 2020 taxes: 93.8%
Here:
94%
State:
92%
(% for various income ranges: 93.4% for AGIs below $25k, 93.7% for AGIs $25k-50k, 93.2% for AGIs $50k-75k, 94.4% for AGIs $75k-100k, 94.3% for AGIs $100k-200k, 95.6% for AGIs over 200k)
Averages for the 2012 tax year for zip code 95330, filed in 2013:
Average Adjusted Gross Income (AGI) in 2012: $48,831 (Individual Income Tax Returns)
Here:
$48,831
State:
$72,726
Salary/wage: $46,201 (reported on 88.5% of returns)
Here:
$46,201
State:
$59,079
(% of AGI for various income ranges: 74.8% for AGIs below $25k, 82.4% for AGIs $25k-50k, 87.5% for AGIs $50k-75k, 87.8% for AGIs $75k-100k, 88.1% for AGIs $100k-200k, 56.4% for AGIs over 200k)
Taxable interest for individuals: $239 (reported on 29.6% of returns)
This zip code:
$239
California:
$2,146
(% of AGI for various income ranges: 0.3% for AGIs below $25k, 0.1% for AGIs $25k-50k, 0.2% for AGIs $50k-75k, 0.3% for AGIs over 200k)
Ordinary dividends: $988 (reported on 5.1% of returns)
Here:
$988
State:
$9,308
(% of AGI for various income ranges: 0.1% for AGIs $75k-100k, 0.2% for AGIs $100k-200k)
Net capital gain/loss in AGI: +$1,658 (reported on 5.0% of returns)
Here:
+$1,658
State:
+$30,460
(% of AGI for various income ranges: 0.8% for AGIs $100k-200k)
Profit/loss from business: +$11,491 (reported on 13.7% of returns)
Here:
+$11,491
State:
+$17,064
(% of AGI for various income ranges: 10.9% for AGIs below $25k, 6.5% for AGIs $25k-50k, 2.4% for AGIs $50k-75k, 0.6% for AGIs $75k-100k, 1.3% for AGIs $100k-200k)
Taxable individual retirement arrangement distribution: $15,384 (reported on 3.9% of returns)
95330:
$15,384
California:
$19,557
(% of AGI for various income ranges: 1.0% for AGIs below $25k, 0.9% for AGIs $25k-50k, 0.8% for AGIs $50k-75k, 1.1% for AGIs $75k-100k, 2.3% for AGIs $100k-200k)
Total itemized deductions: $21,682 (27% of AGI, reported on 36.7% of returns)
Here:
$21,682
State:
$34,004
Here:
27.3% of AGI
State:
22.7% of AGI
(% of AGI for various income ranges: 9.3% for AGIs below $25k, 13.0% for AGIs $25k-50k, 17.5% for AGIs $50k-75k, 19.3% for AGIs $75k-100k, 18.1% for AGIs $100k-200k, 16.4% for AGIs over 200k)
Charity contributions: $2,235 (reported on 28.6% of returns)
Here:
$2,235
State:
$4,659
(% of AGI for various income ranges: 0.3% for AGIs below $25k, 0.9% for AGIs $25k-50k, 1.2% for AGIs $50k-75k, 1.4% for AGIs $75k-100k, 1.8% for AGIs $100k-200k, 1.9% for AGIs over 200k)
Taxes paid: $7,306 (reported on 36.7% of returns)
95330:
$7,306
State:
$14,448
(% of AGI for various income ranges: 2.9% for AGIs below $25k, 3.4% for AGIs $25k-50k, 5.3% for AGIs $50k-75k, 6.2% for AGIs $75k-100k, 7.2% for AGIs $100k-200k, 8.0% for AGIs over 200k)
Earned income credit: $2,231 (reported on 22.3% of returns)
Here:
$2,231
State:
$2,286
(% of AGI for various income ranges: 7.5% for AGIs below $25k, 1.6% for AGIs $25k-50k)
Percentage of individuals using paid preparers for their 2012 taxes: 63.7%
Here:
64%
State:
64%
(% for various income ranges: 59.7% for AGIs below $25k, 64.9% for AGIs $25k-50k, 68.1% for AGIs $50k-75k, 63.5% for AGIs $75k-100k, 65.3% for AGIs $100k-200k, 85.7% for AGIs over 200k)
Averages for the 2004 tax year for zip code 95330, filed in 2005:
Average Adjusted Gross Income (AGI) in 2004: $43,293 (Individual Income Tax Returns)
Here:
$43,293
State:
$58,600
Salary/wage: $40,870 (reported on 91.1% of returns)
Here:
$40,870
State:
$49,455
(% of AGI for various income ranges: 121.5% for AGIs below $10k, 80.5% for AGIs $10k-25k, 88.9% for AGIs $25k-50k, 89.9% for AGIs $50k-75k, 93.5% for AGIs $75k-100k, 69.8% for AGIs over 100k)
Taxable interest for individuals: $481 (reported on 37.3% of returns)
This zip code:
$481
California:
$2,365
(% of AGI for various income ranges: 1.3% for AGIs below $10k, 0.6% for AGIs $10k-25k, 0.5% for AGIs $25k-50k, 0.4% for AGIs $50k-75k, 0.2% for AGIs $75k-100k, 0.4% for AGIs over 100k)
Taxable dividends: $722 (reported on 7.6% of returns)
Here:
$722
State:
$4,746
(% of AGI for various income ranges: 2.0% for AGIs below $10k, 0.2% for AGIs $10k-25k, 0.1% for AGIs $25k-50k, 0.2% for AGIs $50k-75k, 0.0% for AGIs $75k-100k, 0.1% for AGIs over 100k)
Net capital gain/loss: +$9,303 (reported on 6.7% of returns)
Here:
+$9,303
State:
+$23,418
(% of AGI for various income ranges: -1.0% for AGIs below $10k, 0.3% for AGIs $10k-25k, 0.1% for AGIs $25k-50k, 0.3% for AGIs $50k-75k, 0.1% for AGIs $75k-100k, 6.8% for AGIs over 100k)
Profit/loss from business: +$8,669 (reported on 11.0% of returns)
Here:
+$8,669
State:
+$16,826
(% of AGI for various income ranges: 9.0% for AGIs below $10k, 5.3% for AGIs $10k-25k, 3.6% for AGIs $25k-50k, 1.9% for AGIs $50k-75k, 0.8% for AGIs $75k-100k, 0.5% for AGIs over 100k)
IRA payment deduction: $2,254 (reported on 1.2% of returns)
95330:
$2,254
California:
$3,192
Total itemized deductions: $22,428 (33% of AGI, reported on 43.7% of returns)
Here:
$22,428
State:
$28,113
Here:
33.0% of AGI
State:
25.3% of AGI
(% of AGI for various income ranges: 18.6% for AGIs below $10k, 12.9% for AGIs $10k-25k, 21.1% for AGIs $25k-50k, 27.5% for AGIs $50k-75k, 25.5% for AGIs $75k-100k, 19.8% for AGIs over 100k)
Charity contributions deductions: $1,976 (3% of AGI, reported on 37.4% of returns)
Here:
$1,976
State:
$3,923
Here:
2.8% of AGI
State:
3.3% of AGI
(% of AGI for various income ranges: 0.6% for AGIs below $10k, 0.6% for AGIs $10k-25k, 1.1% for AGIs $25k-50k, 2.1% for AGIs $50k-75k, 2.1% for AGIs $75k-100k, 2.1% for AGIs over 100k)
Total tax: $4,539 (reported on 70.7% of returns)
95330:
$4,539
State:
$10,761
(% of AGI for various income ranges: 3.2% for AGIs below $10k, 3.6% for AGIs $10k-25k, 4.9% for AGIs $25k-50k, 6.1% for AGIs $50k-75k, 7.6% for AGIs $75k-100k, 14.2% for AGIs over 100k)
Earned income credit: $1,633 (reported on 16.9% of returns)
Here:
$1,633
State:
$1,763
Percentage of individuals using paid preparers for their 2004 taxes: 67.7%
Here:
68%
State:
66%
(% for various income ranges: 54.4% for AGIs below $10k, 66.1% for AGIs $10k-25k, 71.3% for AGIs $25k-50k, 72.5% for AGIs $50k-75k, 68.8% for AGIs $75k-100k, 74.5% for AGIs over 100k)
Likely homosexual households (counted as self-reported same-sex unmarried-partner households)
Lesbian couples: 0.0% of all households
Gay men: 0.1% of all households
Household received Food Stamps/SNAP in the past 12 months: 1,059 Household did not receive Food Stamps/SNAP in the past 12 months: 6,572
Women who had a birth in the past 12 months: 451 (251 now married, 201 unmarried) Women who did not have a birth in the past 12 months: 6,833 (3,510 now married, 3,290 unmarried)
Housing units in zip code 95330 with a mortgage: 4,891 (476 second mortgage, 2 home equity loan, 386 both second mortgage and home equity loan) Houses without a mortgage: 110
Median monthly owner costs for units with a mortgage: $2,553 Median monthly owner costs for units without a mortgage: $723
Residents with income below the poverty level in 2022:
This zip code:
8.6%
Whole state:
12.2%
Residents with income below 50% of the poverty level in 2022:
This zip code:
2.9%
Whole state:
6.2%
Median number of rooms in houses and condos:
Here:
6.5
State:
6.0
Median number of rooms in apartments:
Here:
6.0
State:
3.9
Notable locations in this zip code not listed on our city pages
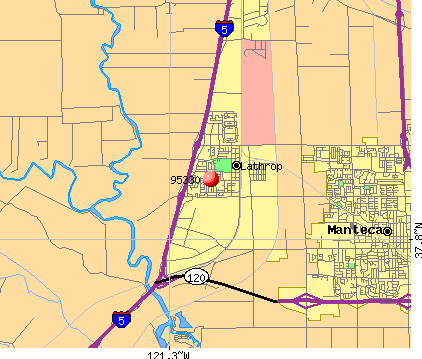
Notable locations in zip code 95330: Mossdale Marina (A), Lathrop - Manteca Fire Protection District Station 34 Lathrop Mossdale (B), Lathrop - Manteca Fire Protection District Station 31 Lathrop J Street (C), Lathrop City Hall (D). Display/hide their locations on the map
Churches in zip code 95330 include: Highlight Church of God and Christ (A), Lathrop Lighthouse of the Cross Church (B). Display/hide their locations on the map
Parks in zip code 95330 include: Dos Reis County Park (1), Green Belt Park (2), Horizon Park (3), Libby-Mingo Park (4), Mossdale County Park (5), Valverde Park (6), Woodfield Park (7). Display/hide their locations on the map
5,025 married couples with children.
1,233 single-parent households (381 men, 852 women).
52.3% of residents of 95330 zip code speak English at home.
24.5% of residents speak Spanish at home (66% very well, 16% well, 14% not well, 4% not at all).
11.3% of residents speak other Indo-European language at home (66% very well, 20% well, 7% not well, 7% not at all).
11.4% of residents speak Asian or Pacific Island language at home (54% very well, 31% well, 13% not well, 1% not at all).
0.7% of residents speak other language at home (77% very well, 5% well, 14% not well, 4% not at all).
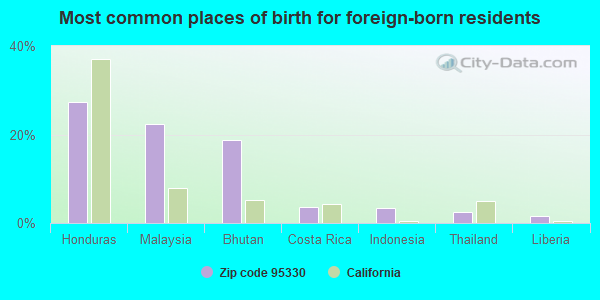
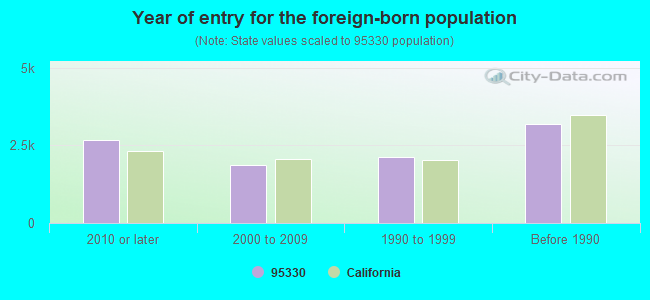
Foreign born population: 9,249 (31.0%) (64.3% of them are naturalized citizens)
This zip code:
31.0%
Whole state:
26.7%
27%Honduras
22%Malaysia
19%Bhutan
4%Costa Rica
3%Indonesia
3%Thailand
2%Liberia
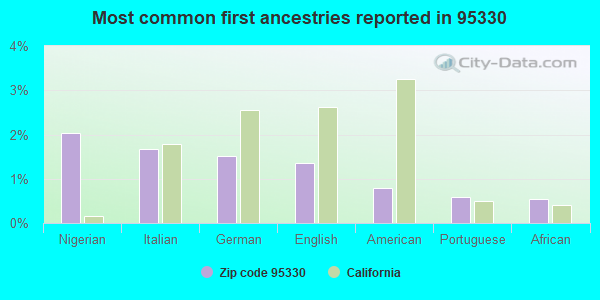
2%Nigerian
2%Italian
2%German
1%English
1%American
1%Portuguese
1%African
Year of entry for the foreign-born population
2,6832010 or later
1,8832000 to 2009
2,1311990 to 1999
3,185Before 1990
Major facilities with environmental interests located in this zip code:
J R SIMPLOT COMPANY (16777 HOWLAND RD. in LATHROP, CA)
AIR MAJOR (AIRS/AFS) STATE MASTER (California - Hazardous Waste Tracking) - HAZARDOU WASTE PROGRAM ENFORCEMENT/COMPLIANCE ACTIVITY (Integrated Compliance Information System) (Integrated Compliance Information System) - ICIS-09-1979-0001, FORMAL ENFORCEMENT ACTION COMPLIANCE ACTIVITY (Tracking inspections of insecticide, fungicide, and rodenticide, and toxic substances) CRITERIA AND HAZARDOUS AIR POLLUTANT INVENTORY (Inventory of air pollution sources) AIR MAJOR ("Best Available" air pollution technologies tracking) HAZARDOUS WASTE BIENNIAL REPORTER (Resource Conservation and Recovery Act (tracking hazardous waste)) Large Quantity Generators, more that 1000 kg of hazardous waste/month (Resource Conservation and Recovery Act (tracking hazardous waste)) TSD (Resource Conservation and Recovery Act (tracking hazardous waste)) - notification TRI REPORTER (Tracking of toxic chemicals releasing facilities) Business SIC classification: PREPARED FEEDS AND FEED INGREDIENTS FOR ANIMALS AND FOWLS, EXCEPT DOGS AND CATS; INDUSTRIAL GASES; NITROGENOUS FERTILIZERS; PHOSPHATIC FERTILIZERS; PESTICIDES AND AGRICULTURAL CHEMICALS Business NAICS classification: NITROGENOUS FERTILIZER MANUFACTURING.; PHOSPHATIC FERTILIZER MANUFACTURING. Organizations: MILLER SPRINGS REMEDIATION MGMNT INC (CONTACT/OPERATOR)
, JR SIMPLOT COMPANY (CONTACT/OWNER)
, OCCIDENTAL CHEMICAL COMPANY (CONTACT/OWNER)
Alternative names: J. R. SIMPLOT CO., J.R. SIMPLOT, OCCIDENTAL CHEM CO, SIMPLOT J R CO
CARPENTER COMPANY (17100 S. HARLAN RD. in LATHROP, CA)
AIR SYNTHETIC MINOR (AIRS/AFS) STATE MASTER (California - Hazardous Waste Tracking) - HAZARDOU WASTE PROGRAM ENFORCEMENT/COMPLIANCE ACTIVITY (Integrated Compliance Information System) CRITERIA AND HAZARDOUS AIR POLLUTANT INVENTORY (Inventory of air pollution sources) AIR MAJOR ("Best Available" air pollution technologies tracking) Small Quantity Generators, between 100 kg and 1000 kg of hazardous waste/month (Resource Conservation and Recovery Act (tracking hazardous waste)) - notification TRI REPORTER (Tracking of toxic chemicals releasing facilities) Business SIC classification: NONWOVEN FABRICS; PLASTICS FOAM PRODUCTS Alternative names: CARPENTER CO., E.R. CARPENTER CO. INC.
MODTECH INC (12030 S HARLAN RD in LATHROP, CA)
STATE MASTER (California - Hazardous Waste Tracking) - HAZARDOU WASTE PROGRAM CRITERIA AND HAZARDOUS AIR POLLUTANT INVENTORY (Inventory of air pollution sources) HAZARDOUS WASTE BIENNIAL REPORTER (Resource Conservation and Recovery Act (tracking hazardous waste)) Large Quantity Generators, more that 1000 kg of hazardous waste/month (Resource Conservation and Recovery Act (tracking hazardous waste)) Business SIC classification: MILLWORK Business NAICS classification: PREFABRICATED WOOD BUILDING MANUFACTURING.
CALIFORNIA NATURAL PRODUCTS (1250 E. LATHROP ROAD in LATHROP, CA)
STATE MASTER (California - Hazardous Waste Tracking) - HAZARDOU WASTE PROGRAM CRITERIA AND HAZARDOUS AIR POLLUTANT INVENTORY (Inventory of air pollution sources) Small Quantity Generators, between 100 kg and 1000 kg of hazardous waste/month (Resource Conservation and Recovery Act (tracking hazardous waste)) - notification TRI REPORTER (Tracking of toxic chemicals releasing facilities) Business SIC classification: FLUID MILK; RICE MILLING Organizations: PAT MITCHELL (CONTACT/OWNER)
JOES TRAVEL PLAZA (15600 S HARLAN RD in LATHROP, CA)
STATE MASTER (California - Hazardous Waste Tracking) - HAZARDOU WASTE PROGRAM CRITERIA AND HAZARDOUS AIR POLLUTANT INVENTORY (Inventory of air pollution sources) Small Quantity Generators, between 100 kg and 1000 kg of hazardous waste/month (Resource Conservation and Recovery Act (tracking hazardous waste)) - notification Business SIC classification: GASOLINE SERVICE STATIONS Organizations: DHOOT BROTHERS PARTNERSHIP (CONTACT/OWNER)
MANTECA USD (2901 E LOUIS AVE in LATHROP, CA)
STATE MASTER (California - Hazardous Waste Tracking) - HAZARDOU WASTE PROGRAM Small Quantity Generators, between 100 kg and 1000 kg of hazardous waste/month (Resource Conservation and Recovery Act (tracking hazardous waste))
JOSEPH WIDMER JR. ELEMENTARY (750 STONEBRIDGE AVENUE in LATHROP, CA)
(National Center for Education Statistics) - STATE ID-6118509 Organizations: MANTECA UNIFIED (SCHOOL DISTRICT)
LATHROP ELEMENTARY (15851 S. FIFTH in LATHROP, CA)
(National Center for Education Statistics) - STATE ID-6042337 Organizations: MANTECA UNIFIED (SCHOOL DISTRICT)
FULLER DSPL SERV (365 E LOUISE AVE in LATHROP, CA)
TRANSPORTER (Resource Conservation and Recovery Act (tracking hazardous waste))
HOME DEPOT HD 5576 (701 D'ARCY PKWY in LATHROP, CA)
Small Quantity Generators, between 100 kg and 1000 kg of hazardous waste/month (Resource Conservation and Recovery Act (tracking hazardous waste)) Organizations: HOME DEPOT USA INC (CONTACT/OPERATOR)
HOME DEPOT USA INC HD 5363 (18300 HARLAN RD in LATHROP, CA)
Small Quantity Generators, between 100 kg and 1000 kg of hazardous waste/month (Resource Conservation and Recovery Act (tracking hazardous waste))
HOME DEPOT USA INC HD FL0050 (17054 S HARLAN RD in LATHROP, CA)
Small Quantity Generators, between 100 kg and 1000 kg of hazardous waste/month (Resource Conservation and Recovery Act (tracking hazardous waste))
J CASTRO TRANSPORTATION (14445 AVON AVE in LATHROP, CA)
TRANSPORTER (Resource Conservation and Recovery Act (tracking hazardous waste)) Organizations: JOHN P CASTRO (CONTACT/OPERATOR)
Housing units lacking complete kitchen facilities: 1.7%
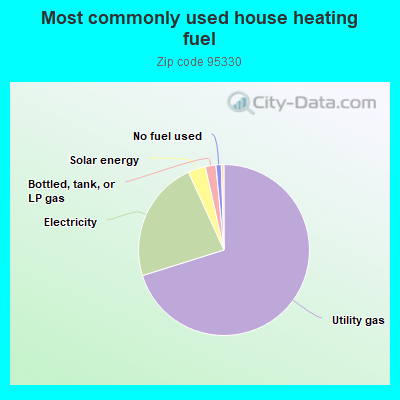
70.1%Utility gas
23.0%Electricity
3.3%Solar energy
2.0%Bottled, tank, or LP gas
1.0%No fuel used
0.5%Wood
Population in 1990: 8,426. Population change in the 1990s: +2,393 (+28.4%).
Place of birth for U.S.-born residents:
This state: 18,227
Northeast: 327
Midwest: 394
South: 781
West: 365
60% of the 95330 zip code residents lived in the same house 5 years ago. Out of people who lived in different houses, 53% lived in this county. Out of people who lived in different counties, 50% lived in California.
90% of the 95330 zip code residents lived in the same house 1 year ago. Out of people who lived in different houses, 32% moved from this county. Out of people who lived in different houses, 65% moved from different county within same state. Out of people who lived in different houses, 2% moved from different state. Out of people who lived in different houses, 2% moved from abroad.
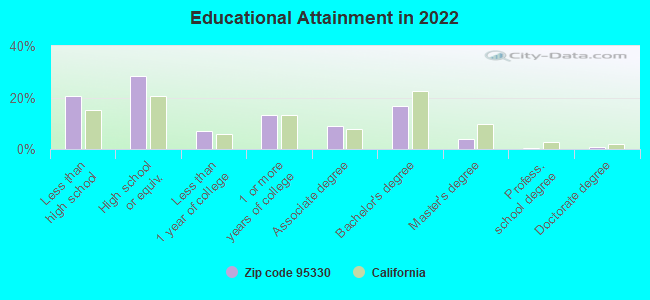
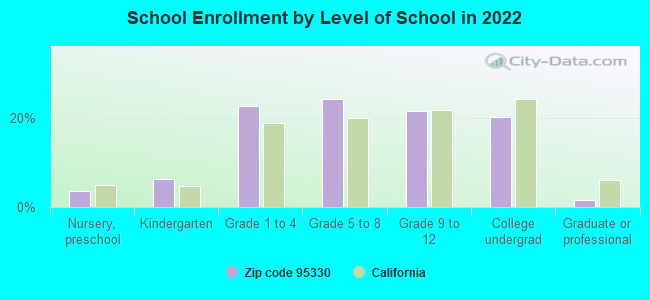
Private vs. public school enrollment:
Students in private schools in grades 1 to 8 (elementary and middle school): 232
Here:
5.7%
California:
10.5%
Students in private schools in grades 9 to 12 (high school): 207
Here:
11.1%
California:
8.5%
Students in private undergraduate colleges: 228
Here:
12.9%
California:
15.9%
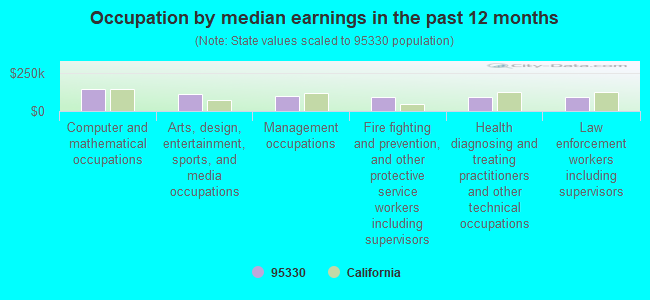
Occupation by median earnings in the past 12 months ($)
144,625Computer and mathematical occupations
109,893Arts, design, entertainment, sports, and media occupations
94,494Management occupations
94,376Fire fighting and prevention, and other protective service workers including supervisors
90,498Health diagnosing and treating practitioners and other technical occupations
90,393Law enforcement workers including supervisors
Top industries in this zip code by the number of employees in 2005:
2002 - 2018 National Fire Incident Reporting System (NFIRS) incidents
Based on the data from the years 2002 - 2018 the average number of fire incidents per year is 65. The highest number of fires - 150 took place in 2018, and the least - 0 in 2003. The data has a rising trend.
When looking into fire subcategories, the most incidents belonged to: Outside Fires (55.2%), and Mobile Property/Vehicle Fires (21.5%).
Fire incident types reported to NFIRS in Zip Code 95330

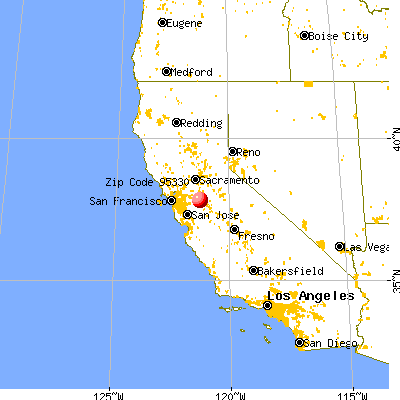


 Nearest zip codes: 95231, 95337, 95336, 95376, 95203, 95206.
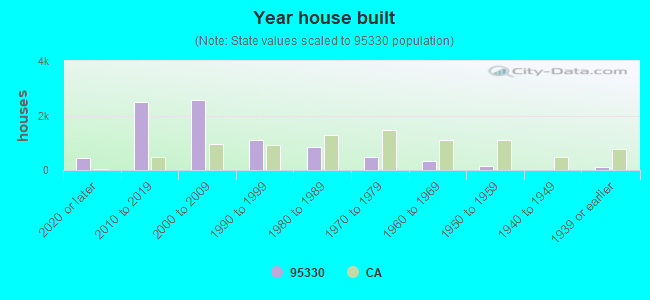


 Based on the data from the years 2002 - 2018 the average number of fire incidents per year is 65. The highest number of fires - 150 took place in 2018, and the least - 0 in 2003. The data has a rising trend.
 When looking into fire subcategories, the most incidents belonged to: Outside Fires (55.2%), and Mobile Property/Vehicle Fires (21.5%).