Estimated zip code population in 2022: 4,057 Zip code population in 2010: 3,155 Zip code population in 2000: 3,154
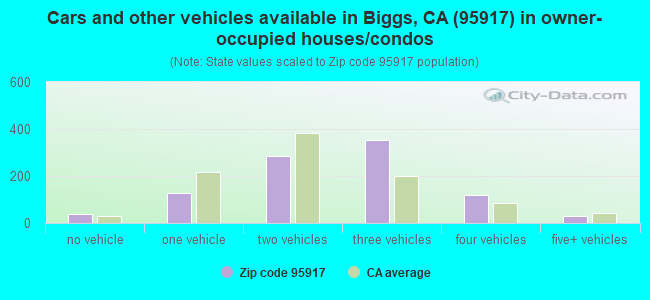
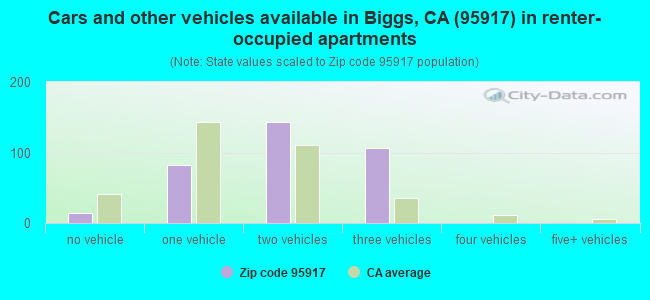
Houses and condos: 1,406 Renter-occupied apartments: 347
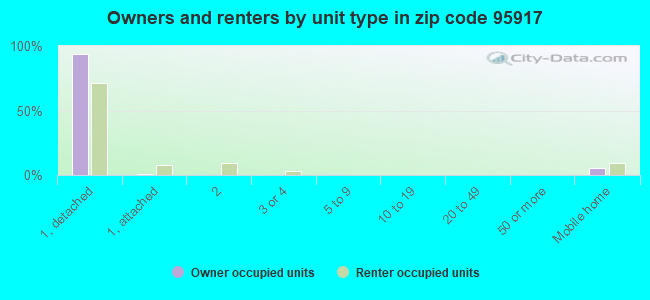
% of renters here:
26%
State:
44%
March 2022 cost of living index in zip code 95917: 95.0 (less than average, U.S. average is 100)
Land area: 68.9 sq. mi. Water area: 0.4 sq. mi.
Population density: 59 people per square mile
(very low).
OSM Map
General Map
Google Map
MSN Map
OSM Map
General Map
Google Map
MSN Map
OSM Map
General Map
Google Map
MSN Map
OSM Map
General Map
Google Map
MSN Map
Please wait while loading the map...
Real estate property taxes paid for housing units in 2022:
This zip code:
0.7% ($2,123)
California:
0.7% ($4,831)
Median real estate property taxes paid for housing units with mortgages in 2022: $2,556 (0.8%) Median real estate property taxes paid for housing units with no mortgage in 2022: $1,841 (0.6%)
Business Search- 14 Million verified businesses
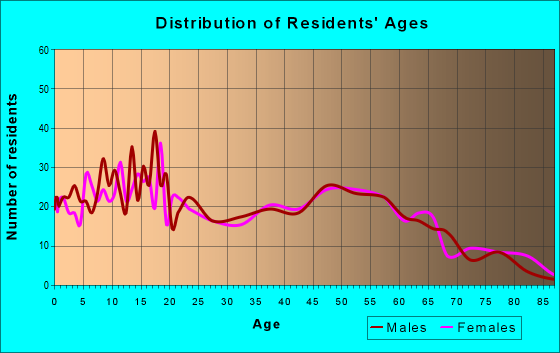
Males: 2,145
(52.9%)
Females: 1,911
(47.1%)
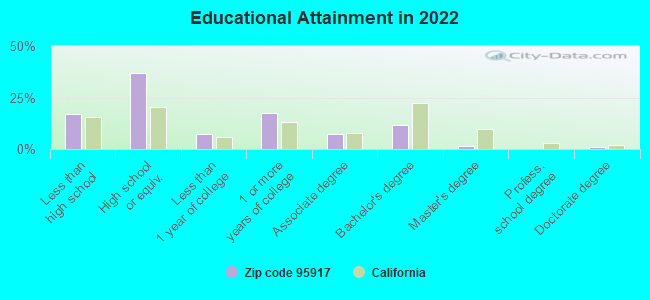
For population 25 years and over in 95917:
High school or higher: 82.0%
Bachelor's degree or higher: 13.8%
Graduate or professional degree: 2.3%
Unemployed: 8.6%
Mean travel time to work (commute): 29.7 minutes
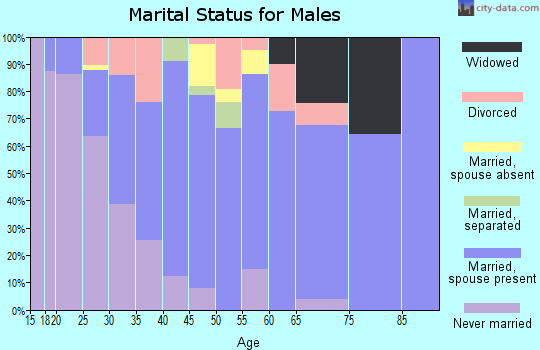
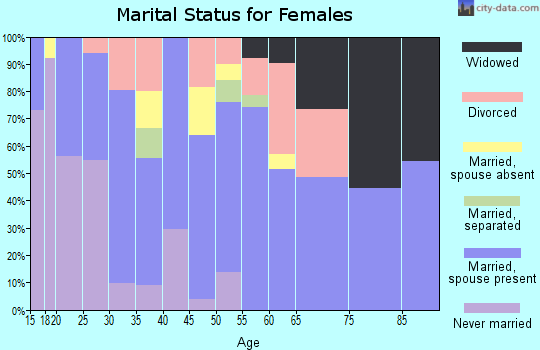
For population 15 years and over in 95917:
Never married: 36.3%
Now married: 47.3%
Separated: 1.7%
Widowed: 3.4%
Divorced: 11.3%
Zip code 95917 compared to state average:
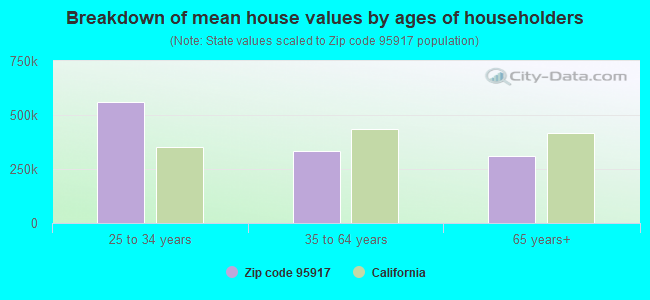
Median house value significantly below state average.
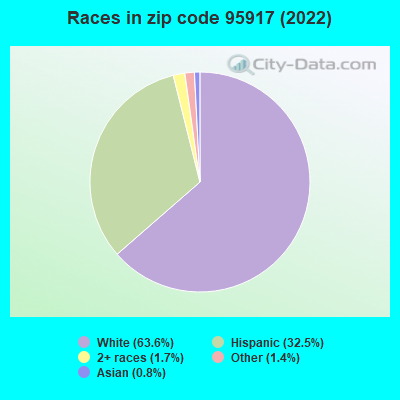
Black race population percentage significantly below state average.
Median age below state average.
Foreign-born population percentage significantly below state average.
Renting percentage below state average.
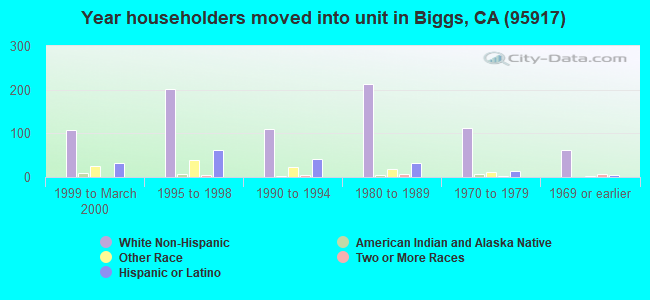
Length of stay since moving in above state average.
Percentage of population with a bachelor's degree or higher significantly below state average.
Averages for the 2020 tax year for zip code 95917, filed in 2021:
Average Adjusted Gross Income (AGI) in 2020: $60,755 (Individual Income Tax Returns)
Here:
$60,755
State:
$95,910
Salary/wage: $47,310 (reported on 83.2% of returns)
Here:
$47,310
State:
$77,331
(% of AGI for various income ranges: 1324.7% for AGIs below $25k, 4023.2% for AGIs $25k-50k, 7232.9% for AGIs $50k-75k, 10028.8% for AGIs $75k-100k, 16089.1% for AGIs $100k-200k)
Taxable interest for individuals: $1,398 (reported on 32.9% of returns)
This zip code:
$1,398
California:
$2,294
(% of AGI for various income ranges: 6.7% for AGIs below $25k, 11.9% for AGIs $25k-50k, 36.4% for AGIs $50k-75k, 22.5% for AGIs $75k-100k, 125.5% for AGIs $100k-200k)
Ordinary dividends: $6,479 (reported on 9.8% of returns)
Here:
$6,479
State:
$10,949
(% of AGI for various income ranges: 25.5% for AGIs $25k-50k, 57.9% for AGIs $50k-75k, 43.8% for AGIs $75k-100k, 160.9% for AGIs $100k-200k)
Net capital gain/loss in AGI: +$12,713 (reported on 10.5% of returns)
Here:
+$12,713
State:
+$49,306
(% of AGI for various income ranges: 12.6% for AGIs $25k-50k, 80.7% for AGIs $50k-75k, 416.4% for AGIs $100k-200k)
Profit/loss from business: +$8,047 (reported on 11.9% of returns)
Here:
+$8,047
State:
+$15,671
(% of AGI for various income ranges: 47.7% for AGIs below $25k, 92.6% for AGIs $25k-50k, 527.5% for AGIs $75k-100k, 493.6% for AGIs $100k-200k)
Taxable individual retirement arrangement distribution: $11,771 (reported on 4.9% of returns)
95917:
$11,771
California:
$23,505
(% of AGI for various income ranges: 68.3% for AGIs below $25k, 277.1% for AGIs $50k-75k, 210.0% for AGIs $100k-200k)
Total itemized deductions: $36,062 (reported on 5.6% of returns)
Here:
$36,062
State:
$39,517
(% of AGI for various income ranges: 806.4% for AGIs $50k-75k, 1596.4% for AGIs $100k-200k)
Charity contributions: $8,783 (reported on 4.2% of returns)
Here:
$8,783
State:
$12,598
(% of AGI for various income ranges: 10.3% for AGIs $25k-50k, 450.0% for AGIs $100k-200k)
Taxes paid: $7,838 (reported on 5.6% of returns)
95917:
$7,838
State:
$8,807
(% of AGI for various income ranges: 160.0% for AGIs $50k-75k, 366.4% for AGIs $100k-200k)
Earned income credit: $2,332 (reported on 17.5% of returns)
Here:
$2,332
State:
$2,074
(% of AGI for various income ranges: 88.0% for AGIs below $25k, 102.9% for AGIs $25k-50k)
Percentage of individuals using paid preparers for their 2020 taxes: 93.0%
Here:
93%
State:
92%
(% for various income ranges: 93.0% for AGIs below $25k, 93.0% for AGIs $25k-50k, 95.2% for AGIs $50k-75k, 92.9% for AGIs $75k-100k, 94.4% for AGIs $100k-200k, 75.0% for AGIs over 200k)
Averages for the 2012 tax year for zip code 95917, filed in 2013:
Average Adjusted Gross Income (AGI) in 2012: $48,584 (Individual Income Tax Returns)
Here:
$48,584
State:
$72,726
Salary/wage: $37,057 (reported on 83.6% of returns)
Here:
$37,057
State:
$59,079
(% of AGI for various income ranges: 73.6% for AGIs below $25k, 78.3% for AGIs $25k-50k, 73.2% for AGIs $50k-75k, 72.0% for AGIs $75k-100k, 84.8% for AGIs $100k-200k)
Taxable interest for individuals: $1,654 (reported on 28.7% of returns)
This zip code:
$1,654
California:
$2,146
(% of AGI for various income ranges: 0.4% for AGIs below $25k, 0.6% for AGIs $25k-50k, 0.2% for AGIs $50k-75k, 0.2% for AGIs $75k-100k, 0.5% for AGIs $100k-200k, 3.7% for AGIs over 200k)
Ordinary dividends: $3,517 (reported on 9.8% of returns)
Here:
$3,517
State:
$9,308
(% of AGI for various income ranges: 0.4% for AGIs below $25k, 0.4% for AGIs $25k-50k, 0.5% for AGIs $50k-75k, 2.5% for AGIs $100k-200k)
Net capital gain/loss in AGI: +$4,357 (reported on 5.7% of returns)
Here:
+$4,357
State:
+$30,460
Profit/loss from business: +$11,794 (reported on 13.1% of returns)
Here:
+$11,794
State:
+$17,064
(% of AGI for various income ranges: 5.5% for AGIs below $25k, 1.4% for AGIs $25k-50k, 6.5% for AGIs $50k-75k, 2.2% for AGIs $75k-100k, 4.2% for AGIs $100k-200k)
Taxable individual retirement arrangement distribution: $12,012 (reported on 6.6% of returns)
95917:
$12,012
California:
$19,557
(% of AGI for various income ranges: 1.8% for AGIs below $25k, 3.0% for AGIs $25k-50k, 5.9% for AGIs $75k-100k)
Total itemized deductions: $21,684 (21% of AGI, reported on 26.2% of returns)
Here:
$21,684
State:
$34,004
Here:
21.4% of AGI
State:
22.7% of AGI
(% of AGI for various income ranges: 5.7% for AGIs below $25k, 6.4% for AGIs $25k-50k, 13.2% for AGIs $50k-75k, 15.1% for AGIs $75k-100k, 15.3% for AGIs $100k-200k, 13.1% for AGIs over 200k)
Charity contributions: $3,292 (reported on 19.7% of returns)
Here:
$3,292
State:
$4,659
(% of AGI for various income ranges: 1.0% for AGIs $25k-50k, 1.6% for AGIs $50k-75k, 1.9% for AGIs $75k-100k, 1.7% for AGIs $100k-200k, 1.4% for AGIs over 200k)
Taxes paid: $7,909 (reported on 26.2% of returns)
95917:
$7,909
State:
$14,448
(% of AGI for various income ranges: 0.8% for AGIs below $25k, 1.3% for AGIs $25k-50k, 3.1% for AGIs $50k-75k, 3.8% for AGIs $75k-100k, 6.1% for AGIs $100k-200k, 9.4% for AGIs over 200k)
Earned income credit: $2,400 (reported on 24.6% of returns)
Here:
$2,400
State:
$2,286
(% of AGI for various income ranges: 7.8% for AGIs below $25k, 1.7% for AGIs $25k-50k)
Percentage of individuals using paid preparers for their 2012 taxes: 67.2%
Here:
67%
State:
64%
(% for various income ranges: 60.0% for AGIs below $25k, 66.7% for AGIs $25k-50k, 76.5% for AGIs $50k-75k, 70.0% for AGIs $75k-100k, 77.8% for AGIs $100k-200k, 100.0% for AGIs over 200k)
Averages for the 2004 tax year for zip code 95917, filed in 2005:
Average Adjusted Gross Income (AGI) in 2004: $35,820 (Individual Income Tax Returns)
Here:
$35,820
State:
$58,600
Salary/wage: $30,727 (reported on 86.7% of returns)
Here:
$30,727
State:
$49,455
(% of AGI for various income ranges: 199.5% for AGIs below $10k, 75.8% for AGIs $10k-25k, 82.2% for AGIs $25k-50k, 82.1% for AGIs $50k-75k, 77.9% for AGIs $75k-100k, 44.0% for AGIs over 100k)
Taxable interest for individuals: $1,581 (reported on 36.0% of returns)
This zip code:
$1,581
California:
$2,365
(% of AGI for various income ranges: 4.4% for AGIs below $10k, 1.7% for AGIs $10k-25k, 0.7% for AGIs $25k-50k, 0.5% for AGIs $50k-75k, 1.9% for AGIs $75k-100k, 3.4% for AGIs over 100k)
Taxable dividends: $2,022 (reported on 14.3% of returns)
Here:
$2,022
State:
$4,746
(% of AGI for various income ranges: 1.1% for AGIs below $10k, 1.4% for AGIs $10k-25k, 0.3% for AGIs $25k-50k, 0.2% for AGIs $50k-75k, 1.1% for AGIs $75k-100k, 1.4% for AGIs over 100k)
Net capital gain/loss: +$11,451 (reported on 11.4% of returns)
Here:
+$11,451
State:
+$23,418
(% of AGI for various income ranges: 6.3% for AGIs below $10k, 0.2% for AGIs $10k-25k, 1.9% for AGIs $25k-50k, 0.6% for AGIs $50k-75k, 0.5% for AGIs $75k-100k, 14.1% for AGIs over 100k)
Profit/loss from business: +$4,645 (reported on 14.7% of returns)
Here:
+$4,645
State:
+$16,826
(% of AGI for various income ranges: 10.8% for AGIs below $10k, 3.7% for AGIs $10k-25k, 1.0% for AGIs $25k-50k, 2.5% for AGIs $50k-75k, 2.6% for AGIs $75k-100k, 0.0% for AGIs over 100k)
IRA payment deduction: $3,000 (reported on 1.7% of returns)
95917:
$3,000
California:
$3,192
Self-employed pension: $12,364 (reported on 0.9% of returns)
Here:
$12,364
California:
$17,688
Total itemized deductions: $18,346 (28% of AGI, reported on 29.5% of returns)
Here:
$18,346
State:
$28,113
Here:
27.9% of AGI
State:
25.3% of AGI
(% of AGI for various income ranges: 21.0% for AGIs below $10k, 8.6% for AGIs $10k-25k, 14.2% for AGIs $25k-50k, 17.3% for AGIs $50k-75k, 18.2% for AGIs $75k-100k, 15.7% for AGIs over 100k)
Charity contributions deductions: $2,379 (3% of AGI, reported on 23.5% of returns)
Here:
$2,379
State:
$3,923
Here:
3.4% of AGI
State:
3.3% of AGI
(% of AGI for various income ranges: 0.8% for AGIs $10k-25k, 1.5% for AGIs $25k-50k, 1.7% for AGIs $50k-75k, 2.2% for AGIs $75k-100k, 1.6% for AGIs over 100k)
Total tax: $4,536 (reported on 67.2% of returns)
95917:
$4,536
State:
$10,761
(% of AGI for various income ranges: 6.5% for AGIs below $10k, 3.4% for AGIs $10k-25k, 5.2% for AGIs $25k-50k, 7.4% for AGIs $50k-75k, 10.2% for AGIs $75k-100k, 16.4% for AGIs over 100k)
Earned income credit: $1,791 (reported on 21.2% of returns)
Here:
$1,791
State:
$1,763
Percentage of individuals using paid preparers for their 2004 taxes: 69.0%
Here:
69%
State:
66%
(% for various income ranges: 59.9% for AGIs below $10k, 65.9% for AGIs $10k-25k, 74.6% for AGIs $25k-50k, 67.3% for AGIs $50k-75k, 77.4% for AGIs $75k-100k, 89.7% for AGIs over 100k)
Household received Food Stamps/SNAP in the past 12 months: 250 Household did not receive Food Stamps/SNAP in the past 12 months: 1,077
Women who had a birth in the past 12 months: 52 (35 now married, 17 unmarried) Women who did not have a birth in the past 12 months: 789 (335 now married, 452 unmarried)
Housing units in zip code 95917 with a mortgage: 529 (43 second mortgage, 35 both second mortgage and home equity loan) Median monthly owner costs for units with a mortgage: $1,804 Median monthly owner costs for units without a mortgage: $697
Residents with income below the poverty level in 2022:
This zip code:
8.2%
Whole state:
12.2%
Residents with income below 50% of the poverty level in 2022:
This zip code:
4.6%
Whole state:
6.2%
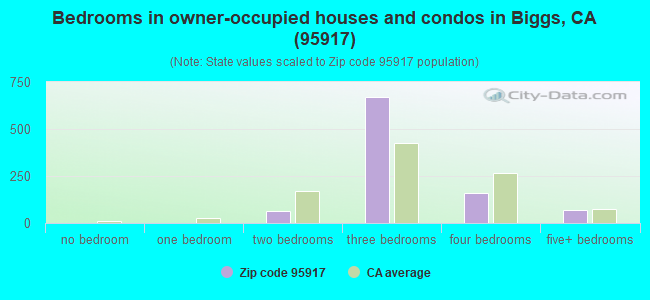
Median number of rooms in houses and condos:
Here:
5.9
State:
6.0
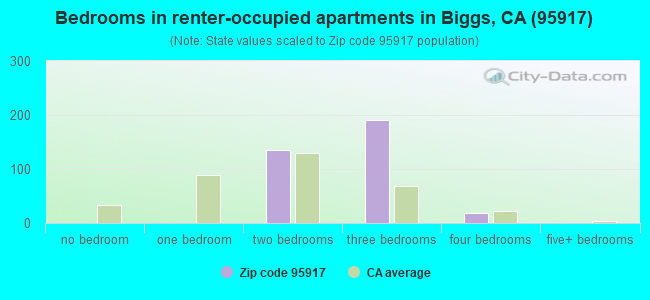
Median number of rooms in apartments:
Here:
4.5
State:
3.9
Notable locations in this zip code not listed on our city pages
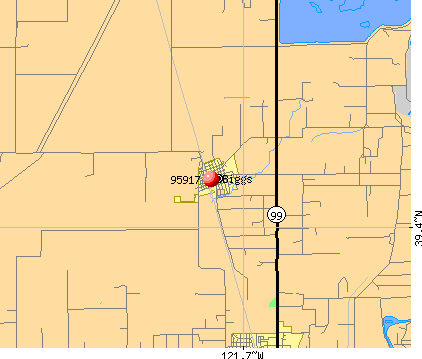
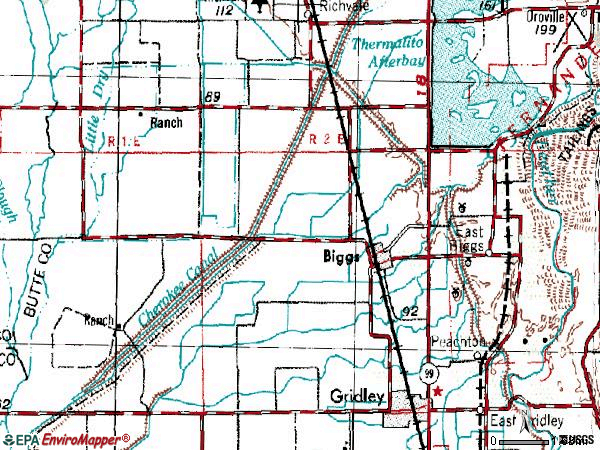
Notable locations in zip code 95917: USDA Rice Experimental Station (A), Schohr Ranch (B), Onstott Ranch (C), Biggs City Hall (D), Biggs Branch Butte County Library (E), Butte County Fire Department Station 73 (F). Display/hide their locations on the map
Churches in zip code 95917 include: Biggs Assembly of God Church (A), Biggs United Methodist Church (B), First Baptist Church (C). Display/hide their locations on the map
Size of family households: 413 2-persons, 159 3-persons, 176 4-persons, 156 5-persons, 116 6-persons
Size of nonfamily households: 167 1-person, 68 2-persons, 45 3-persons
577 married couples with children.
328 single-parent households (165 men, 163 women).
72.3% of residents of 95917 zip code speak English at home.
24.6% of residents speak Spanish at home (53% very well, 23% well, 16% not well, 8% not at all).
2.2% of residents speak other Indo-European language at home (51% very well, 11% well, 26% not well, 11% not at all).
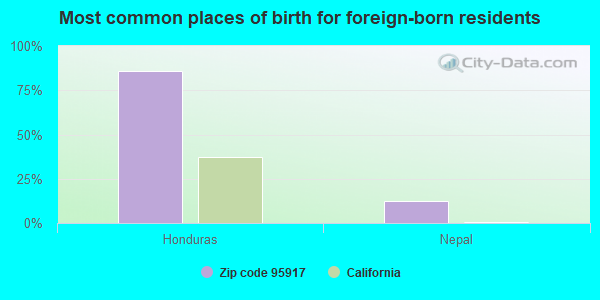
Foreign born population: 441 (10.9%) (58.8% of them are naturalized citizens)
This zip code:
10.9%
Whole state:
26.7%
86%Honduras
12%Nepal
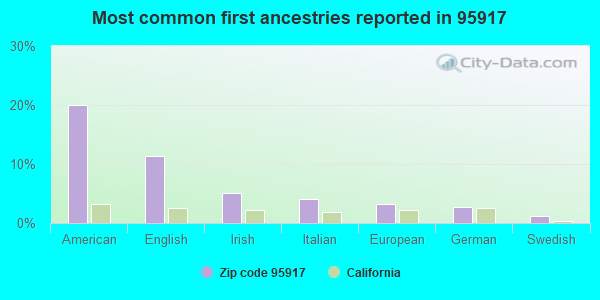
20%American
11%English
5%Irish
4%Italian
3%European
3%German
1%Swedish
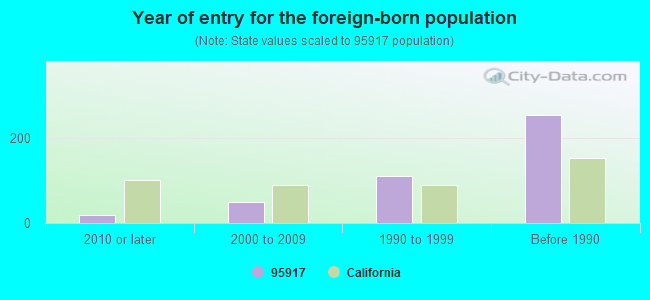
Year of entry for the foreign-born population
192010 or later
492000 to 2009
1101990 to 1999
253Before 1990
Facilities with environmental interests located in this zip code:
CHUCK JONES FLYING SERVICE (216 W HAMILTON RD P O BOX 497 in BIGGS, CA)
STATE MASTER (California - Hazardous Waste Tracking) - HAZARDOU WASTE PROGRAM Small Quantity Generators, between 100 kg and 1000 kg of hazardous waste/month (Resource Conservation and Recovery Act (tracking hazardous waste)) - notification Business NAICS classification: SOIL PREPARATION, PLANTING, AND CULTIVATING. Organizations: CHUCK & JOYCE JONES (CONTACT/OWNER)
AFTON ROAD BRIDGE AT CHEROKEE CANAL (0 AFTON ROAD in BIGGS, CA)
(Resource Conservation and Recovery Act (tracking hazardous waste)) Organizations: BUTTE COUNTY (CONTACT/OPERATOR)
CBM WAREHOUSES, INC. #2 (2991 BIGGS W GRIDLEY in BIGGS, CA)
CRITERIA AND HAZARDOUS AIR POLLUTANT INVENTORY (Inventory of air pollution sources)
GRIDLEY WAREHOUSES (3137 EIGHTH STREET in BIGGS, CA)
CRITERIA AND HAZARDOUS AIR POLLUTANT INVENTORY (Inventory of air pollution sources)
LEMMA RICE (2883 WEST BIGGS-GRIDLEY ROAD in BIGGS, CA)
CRITERIA AND HAZARDOUS AIR POLLUTANT INVENTORY (Inventory of air pollution sources) Business SIC classification: GASOLINE SERVICE STATIONS; REGULATION AND ADMINISTRATION OF COMMUNICATIONS, ELECTRIC, GAS, AND OTHER UTILITIES Alternative names: THORNTONS CHEVRON #6870
Housing units lacking complete kitchen facilities: 0.4%
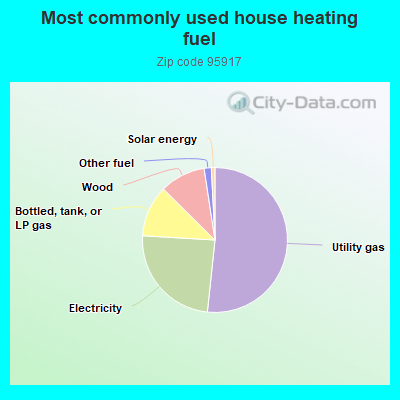
51.8%Utility gas
24.3%Electricity
11.5%Bottled, tank, or LP gas
10.2%Wood
1.6%Other fuel
0.8%Solar energy
Population in 1990: 2,784. Population change in the 1990s: +370 (+13.3%).
Place of birth for U.S.-born residents:
This state: 3,240
Northeast: 69
Midwest: 108
South: 46
West: 146
62% of the 95917 zip code residents lived in the same house 5 years ago. Out of people who lived in different houses, 66% lived in this county. Out of people who lived in different counties, 50% lived in California.
89% of the 95917 zip code residents lived in the same house 1 year ago. Out of people who lived in different houses, 74% moved from this county. Out of people who lived in different houses, 22% moved from different county within same state.
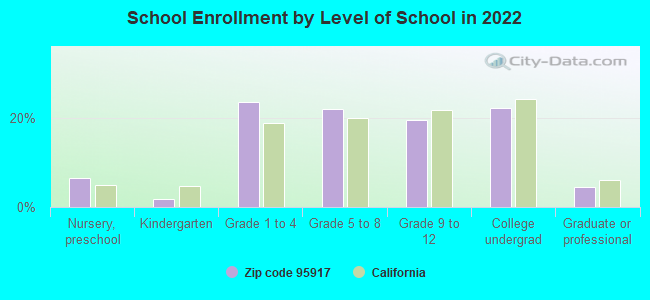
Private vs. public school enrollment:
Students in private schools in grades 1 to 8 (elementary and middle school): 81
Here:
15.1%
California:
10.5%
Students in private schools in grades 9 to 12 (high school): 53
Here:
23.3%
California:
8.5%
Students in private undergraduate colleges:
Here:
0.0%
California:
15.9%
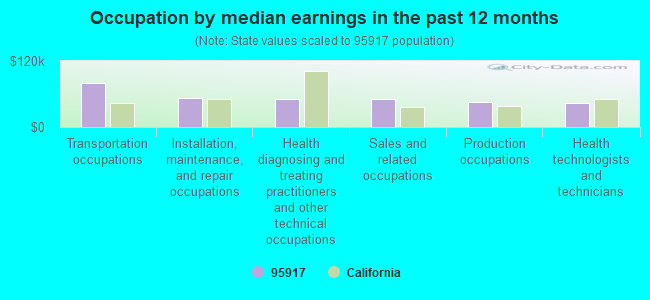
Occupation by median earnings in the past 12 months ($)
79,781Transportation occupations
52,021Installation, maintenance, and repair occupations
50,481Health diagnosing and treating practitioners and other technical occupations
50,279Sales and related occupations
46,098Production occupations
43,777Health technologists and technicians
Top industries in this zip code by the number of employees in 2005:
Finance and Insurance: Credit Unions (10-19 employees: 1 establishment)
Construction: Site Preparation Contractors (5-9: 1, 1-4: 1)
Wholesale Trade: Transportation Equipment and Supplies (except Motor Vehicle) Merchant Wholesalers (5-9: 1)
Construction: Plumbing, Heating, and Air-Conditioning Contractors (1-4: 2)
Construction: All Other Specialty Trade Contractors (1-4: 2)
Construction: Roofing Contractors (1-4: 1)
People in group quarters in 2000:
5 people in other workers' dormitories
Fatal accident statistics in 2013:
Fatal accident count: 1
Vehicles involved in fatal accidents: 2
Fatal accidents caused by drunken drivers: 0
Fatalities: 1
Persons involved in fatal accidents: 2
Pedestrians involved in fatal accidents: 0
Fatal accident statistics in 2011:
Fatal accident count: 2
Vehicles involved in fatal accidents: 2
Fatal accidents caused by drunken drivers: 0
Fatalities: 2
Persons involved in fatal accidents: 3
Pedestrians involved in fatal accidents: 1
Home Mortgage Disclosure Act Aggregated Statistics For Year 2009 (Based on 2 partial tracts)
A) FHA, FSA/RHS & VA Home Purchase Loans
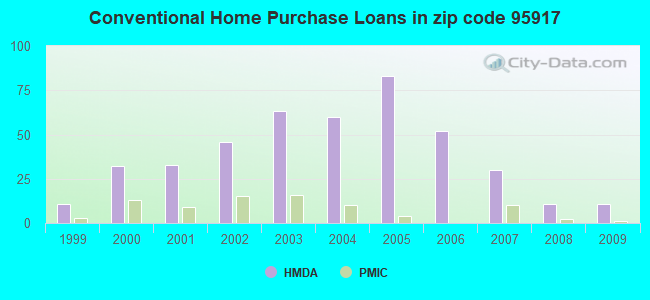
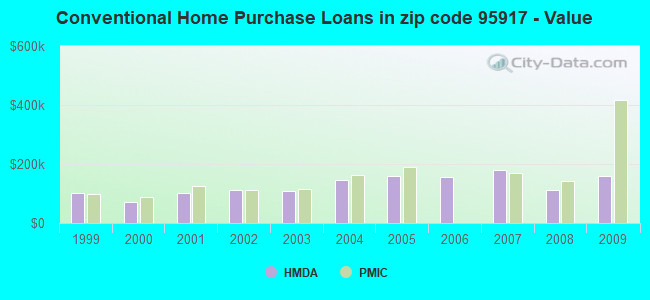
B) Conventional Home Purchase Loans
C) Refinancings
D) Home Improvement Loans
F) Non-occupant Loans on < 5 Family Dwellings (A B C & D)
G) Loans On Manufactured Home Dwelling (A B C & D)
Number
Average Value
Number
Average Value
Number
Average Value
Number
Average Value
Number
Average Value
Number
Average Value
LOANS ORIGINATED
16
$151,274
11
$158,555
37
$164,589
0
$0
2
$142,375
2
$146,690
APPLICATIONS APPROVED, NOT ACCEPTED
1
$70,110
0
$0
3
$175,813
1
$12,940
1
$314,950
0
$0
APPLICATIONS DENIED
3
$108,580
1
$86,290
22
$179,685
1
$15,100
0
$0
1
$86,290
APPLICATIONS WITHDRAWN
2
$121,880
0
$0
11
$137,865
2
$42,065
0
$0
0
$0
FILES CLOSED FOR INCOMPLETENESS
0
$0
0
$0
2
$277,740
0
$0
0
$0
0
$0
Aggregated Statistics For Year 2008 (Based on 2 partial tracts)
A) FHA, FSA/RHS & VA Home Purchase Loans
B) Conventional Home Purchase Loans
C) Refinancings
D) Home Improvement Loans
F) Non-occupant Loans on < 5 Family Dwellings (A B C & D)
G) Loans On Manufactured Home Dwelling (A B C & D)
Number
Average Value
Number
Average Value
Number
Average Value
Number
Average Value
Number
Average Value
Number
Average Value
LOANS ORIGINATED
10
$160,496
11
$111,880
35
$164,132
8
$122,960
9
$107,980
1
$170,420
APPLICATIONS APPROVED, NOT ACCEPTED
0
$0
1
$256,710
6
$182,463
4
$24,538
1
$215,720
0
$0
APPLICATIONS DENIED
3
$117,567
6
$117,208
56
$201,140
15
$54,289
12
$177,070
3
$127,633
APPLICATIONS WITHDRAWN
0
$0
8
$136,442
14
$156,089
2
$84,130
4
$163,948
1
$48,540
FILES CLOSED FOR INCOMPLETENESS
0
$0
1
$135,900
6
$186,778
0
$0
3
$116,490
0
$0
Aggregated Statistics For Year 2007 (Based on 2 partial tracts)
A) FHA, FSA/RHS & VA Home Purchase Loans
B) Conventional Home Purchase Loans
C) Refinancings
D) Home Improvement Loans
F) Non-occupant Loans on < 5 Family Dwellings (A B C & D)
G) Loans On Manufactured Home Dwelling (A B C & D)
Number
Average Value
Number
Average Value
Number
Average Value
Number
Average Value
Number
Average Value
Number
Average Value
LOANS ORIGINATED
1
$177,970
30
$181,313
53
$174,957
18
$118,586
11
$155,515
3
$74,423
APPLICATIONS APPROVED, NOT ACCEPTED
0
$0
6
$169,700
15
$192,494
3
$183,363
0
$0
2
$111,635
APPLICATIONS DENIED
1
$330,050
8
$140,758
77
$211,224
18
$85,629
4
$113,252
3
$147,767
APPLICATIONS WITHDRAWN
0
$0
14
$117,182
31
$215,650
6
$157,295
6
$91,860
4
$61,480
FILES CLOSED FOR INCOMPLETENESS
0
$0
2
$168,260
4
$230,012
1
$167,180
0
$0
0
$0
Aggregated Statistics For Year 2006 (Based on 2 partial tracts)
A) FHA, FSA/RHS & VA Home Purchase Loans
B) Conventional Home Purchase Loans
C) Refinancings
D) Home Improvement Loans
F) Non-occupant Loans on < 5 Family Dwellings (A B C & D)
G) Loans On Manufactured Home Dwelling (A B C & D)
Number
Average Value
Number
Average Value
Number
Average Value
Number
Average Value
Number
Average Value
Number
Average Value
LOANS ORIGINATED
1
$442,230
52
$155,878
115
$177,622
35
$118,739
9
$171,977
3
$197,023
APPLICATIONS APPROVED, NOT ACCEPTED
0
$0
3
$341,917
18
$193,968
2
$113,255
0
$0
2
$271,805
APPLICATIONS DENIED
0
$0
22
$138,110
84
$206,115
17
$115,029
4
$248,888
1
$140,220
APPLICATIONS WITHDRAWN
0
$0
9
$183,482
57
$182,756
3
$92,760
2
$375,355
0
$0
FILES CLOSED FOR INCOMPLETENESS
0
$0
2
$134,825
12
$173,115
0
$0
2
$168,260
1
$48,540
Aggregated Statistics For Year 2005 (Based on 2 partial tracts)
B) Conventional Home Purchase Loans
C) Refinancings
D) Home Improvement Loans
F) Non-occupant Loans on < 5 Family Dwellings (A B C & D)
G) Loans On Manufactured Home Dwelling (A B C & D)
Number
Average Value
Number
Average Value
Number
Average Value
Number
Average Value
Number
Average Value
LOANS ORIGINATED
83
$157,840
167
$161,402
30
$134,430
15
$145,683
3
$179,407
APPLICATIONS APPROVED, NOT ACCEPTED
24
$140,398
29
$191,098
6
$176,890
5
$154,240
4
$100,310
APPLICATIONS DENIED
28
$168,801
73
$173,891
27
$81,414
6
$197,923
6
$102,647
APPLICATIONS WITHDRAWN
27
$181,564
77
$156,803
9
$102,228
6
$108,578
2
$127,815
FILES CLOSED FOR INCOMPLETENESS
2
$222,190
13
$146,772
0
$0
1
$172,580
0
$0
Aggregated Statistics For Year 2004 (Based on 2 partial tracts)
A) FHA, FSA/RHS & VA Home Purchase Loans
B) Conventional Home Purchase Loans
C) Refinancings
D) Home Improvement Loans
F) Non-occupant Loans on < 5 Family Dwellings (A B C & D)
G) Loans On Manufactured Home Dwelling (A B C & D)
Number
Average Value
Number
Average Value
Number
Average Value
Number
Average Value
Number
Average Value
Number
Average Value
LOANS ORIGINATED
3
$170,780
60
$147,193
168
$130,941
24
$79,052
23
$128,353
6
$151,903
APPLICATIONS APPROVED, NOT ACCEPTED
0
$0
12
$115,680
32
$145,442
8
$68,491
5
$114,978
1
$170,420
APPLICATIONS DENIED
1
$199,540
18
$192,829
88
$132,839
18
$44,103
8
$137,791
4
$135,902
APPLICATIONS WITHDRAWN
0
$0
9
$135,783
67
$130,527
6
$99,590
3
$130,510
2
$151,005
FILES CLOSED FOR INCOMPLETENESS
0
$0
1
$232,980
12
$112,264
0
$0
0
$0
0
$0
Aggregated Statistics For Year 2003 (Based on 2 partial tracts)
A) FHA, FSA/RHS & VA Home Purchase Loans
B) Conventional Home Purchase Loans
C) Refinancings
D) Home Improvement Loans
F) Non-occupant Loans on < 5 Family Dwellings (A B C & D)
Number
Average Value
Number
Average Value
Number
Average Value
Number
Average Value
Number
Average Value
LOANS ORIGINATED
6
$135,365
63
$108,887
241
$112,591
8
$38,021
28
$93,029
APPLICATIONS APPROVED, NOT ACCEPTED
0
$0
12
$120,803
22
$119,480
1
$32,360
2
$163,410
APPLICATIONS DENIED
0
$0
13
$103,214
81
$111,136
10
$26,102
6
$99,770
APPLICATIONS WITHDRAWN
0
$0
4
$174,195
46
$116,418
0
$0
1
$81,970
FILES CLOSED FOR INCOMPLETENESS
0
$0
2
$153,700
9
$107,500
2
$88,985
1
$75,500
Aggregated Statistics For Year 2002 (Based on 2 partial tracts)
A) FHA, FSA/RHS & VA Home Purchase Loans
B) Conventional Home Purchase Loans
C) Refinancings
D) Home Improvement Loans
F) Non-occupant Loans on < 5 Family Dwellings (A B C & D)
Number
Average Value
Number
Average Value
Number
Average Value
Number
Average Value
Number
Average Value
LOANS ORIGINATED
5
$112,174
46
$110,768
94
$105,083
4
$56,088
9
$90,482
APPLICATIONS APPROVED, NOT ACCEPTED
2
$138,600
3
$141,657
15
$110,377
4
$25,348
0
$0
APPLICATIONS DENIED
0
$0
2
$88,985
67
$97,412
6
$24,808
3
$81,973
APPLICATIONS WITHDRAWN
1
$162,870
3
$95,277
26
$109,519
2
$37,750
2
$42,065
FILES CLOSED FOR INCOMPLETENESS
0
$0
1
$86,290
6
$95,815
0
$0
0
$0
Aggregated Statistics For Year 2001 (Based on 2 partial tracts)
A) FHA, FSA/RHS & VA Home Purchase Loans
B) Conventional Home Purchase Loans
C) Refinancings
D) Home Improvement Loans
F) Non-occupant Loans on < 5 Family Dwellings (A B C & D)
Number
Average Value
Number
Average Value
Number
Average Value
Number
Average Value
Number
Average Value
LOANS ORIGINATED
4
$93,300
33
$100,441
81
$94,917
9
$13,662
10
$70,648
APPLICATIONS APPROVED, NOT ACCEPTED
1
$61,480
3
$93,837
15
$115,985
0
$0
1
$29,120
APPLICATIONS DENIED
1
$77,660
11
$74,424
29
$80,560
5
$42,712
3
$31,280
APPLICATIONS WITHDRAWN
1
$96,000
6
$157,475
27
$108,739
0
$0
1
$77,660
FILES CLOSED FOR INCOMPLETENESS
0
$0
1
$166,100
3
$97,433
0
$0
0
$0
Aggregated Statistics For Year 2000 (Based on 2 partial tracts)
A) FHA, FSA/RHS & VA Home Purchase Loans
B) Conventional Home Purchase Loans
C) Refinancings
D) Home Improvement Loans
F) Non-occupant Loans on < 5 Family Dwellings (A B C & D)
Number
Average Value
Number
Average Value
Number
Average Value
Number
Average Value
Number
Average Value
LOANS ORIGINATED
15
$91,321
32
$70,244
27
$79,776
9
$18,816
6
$65,435
APPLICATIONS APPROVED, NOT ACCEPTED
1
$139,140
5
$79,170
6
$89,523
4
$16,180
0
$0
APPLICATIONS DENIED
2
$56,625
18
$75,922
29
$74,200
15
$15,963
1
$69,030
APPLICATIONS WITHDRAWN
0
$0
2
$46,920
24
$80,895
2
$24,270
0
$0
FILES CLOSED FOR INCOMPLETENESS
0
$0
0
$0
5
$109,154
1
$20,490
0
$0
Aggregated Statistics For Year 1999 (Based on 1 partial tract)
A) FHA, FSA/RHS & VA Home Purchase Loans
B) Conventional Home Purchase Loans
C) Refinancings
D) Home Improvement Loans
F) Non-occupant Loans on < 5 Family Dwellings (A B C & D)
Detailed PMIC statistics for the following Tracts:0036.00
2002 - 2018 National Fire Incident Reporting System (NFIRS) incidents
Based on the data from the years 2002 - 2018 the average number of fire incidents per year is 18. The highest number of reported fire incidents - 31 took place in 2007, and the least - 0 in 2004. The data has an increasing trend.
When looking into fire subcategories, the most reports belonged to: Outside Fires (57.7%), and Structure Fires (18.4%).
Fire incident types reported to NFIRS in Zip Code 95917
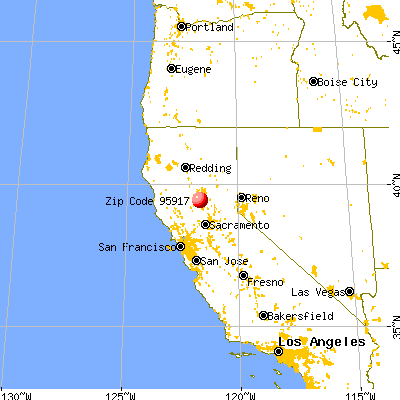


 Nearest zip codes: 95948, 95974, 95953, 95920, 95938, 95968.
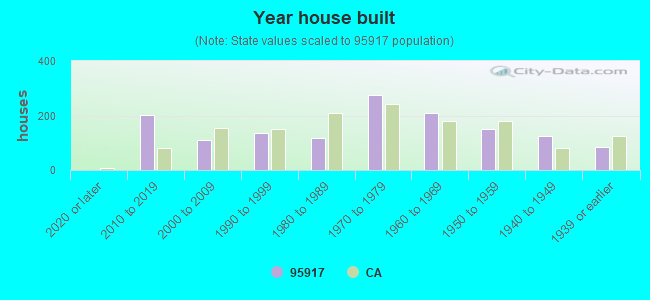


 Based on the data from the years 2002 - 2018 the average number of fire incidents per year is 18. The highest number of reported fire incidents - 31 took place in 2007, and the least - 0 in 2004. The data has an increasing trend.
 When looking into fire subcategories, the most reports belonged to: Outside Fires (57.7%), and Structure Fires (18.4%).