Estimated zip code population in 2022: 11,108
Zip code population in 2010: 10,718
Zip code population in 2000: 8,686
Houses and condos: 3,701
Renter-occupied apartments: 1,293
% of renters here:
37%State:
44%
March 2022 cost of living index in zip code 95953: 91.9
(less than average, U.S. average is 100)
Land area: 113.8
sq. mi.
Water area: 0.3
sq. mi.
Population density: 98 people per square mile (very low).
OSM Map
General Map
Google Map
MSN Map
OSM Map
General Map
Google Map
MSN Map
OSM Map
General Map
Google Map
MSN Map
OSM Map
General Map
Google Map
MSN Map
Please wait while loading the map...
Real estate property taxes paid for housing units in 2022:
This zip code:
0.7% ($2,316)California:
0.7% ($4,831)
Median real estate property taxes paid for housing units with mortgages in 2022: $2,513 (0.7%)
Median real estate property taxes paid for housing units with no mortgage in 2022: $1,940 (0.5%)
Profiles of local businesses
Business Search - 14 Million verified businesses
Males: 5,635 Females: 5,472
For population 25 years and over in 95953:
High school or higher: 71.8%Bachelor's degree or higher: 15.1%Graduate or professional degree: 3.5%Unemployed: 5.7%Mean travel time to work (commute): 27.0 minutes
For population 15 years and over in 95953:
Never married: 34.3%Now married: 49.9%Separated: 1.6%Widowed: 6.2%Divorced: 8.1%
Zip code 95953 compared to state average:
Median house value below state average. Black race population percentage significantly below state average. Length of stay since moving in above state average. Percentage of population with a bachelor's degree or higher significantly below state average. 4,876 43.9% Hispanic or Latino 4,147 37.3% White 1,361 12.3% Asian 297 2.7% Two or more races 160 1.4% Native Hawaiian and Other 142 1.3% Black 102 0.9% American Indian 19 0.2% Some other race
Data:
Median household income ($)
Median household income (% change since 2000)
Household income diversity
Ratio of average income to average house value (%)
Ratio of average income to average rent
Median household income ($) - White
Median household income ($) - Black or African American
Median household income ($) - Asian
Median household income ($) - Hispanic or Latino
Median household income ($) - American Indian and Alaska Native
Median household income ($) - Multirace
Median household income ($) - Other Race
Median household income for houses/condos with a mortgage ($)
Median household income for apartments without a mortgage ($)
Races - White alone (%)
Races - White alone (% change since 2000)
Races - Black alone (%)
Races - Black alone (% change since 2000)
Races - American Indian alone (%)
Races - American Indian alone (% change since 2000)
Races - Asian alone (%)
Races - Asian alone (% change since 2000)
Races - Hispanic (%)
Races - Hispanic (% change since 2000)
Races - Native Hawaiian and Other Pacific Islander alone (%)
Races - Native Hawaiian and Other Pacific Islander alone (% change since 2000)
Races - Two or more races (%)
Races - Two or more races (% change since 2000)
Races - Other race alone (%)
Races - Other race alone (% change since 2000)
Racial diversity
Unemployment (%)
Unemployment (% change since 2000)
Unemployment (%) - White
Unemployment (%) - Black or African American
Unemployment (%) - Asian
Unemployment (%) - Hispanic or Latino
Unemployment (%) - American Indian and Alaska Native
Unemployment (%) - Multirace
Unemployment (%) - Other Race
Population density (people per square mile)
Population - Males (%)
Population - Females (%)
Population - Males (%) - White
Population - Males (%) - Black or African American
Population - Males (%) - Asian
Population - Males (%) - Hispanic or Latino
Population - Males (%) - American Indian and Alaska Native
Population - Males (%) - Multirace
Population - Males (%) - Other Race
Population - Females (%) - White
Population - Females (%) - Black or African American
Population - Females (%) - Asian
Population - Females (%) - Hispanic or Latino
Population - Females (%) - American Indian and Alaska Native
Population - Females (%) - Multirace
Population - Females (%) - Other Race
Coronavirus confirmed cases (Apr 27, 2024)
Deaths caused by coronavirus (Apr 27, 2024)
Coronavirus confirmed cases (per 100k population) (Apr 27, 2024)
Deaths caused by coronavirus (per 100k population) (Apr 27, 2024)
Daily increase in number of cases (Apr 27, 2024)
Weekly increase in number of cases (Apr 27, 2024)
Cases doubled (in days) (Apr 27, 2024)
Hospitalized patients (Apr 18, 2022)
Negative test results (Apr 18, 2022)
Total test results (Apr 18, 2022)
COVID Vaccine doses distributed (per 100k population) (Sep 19, 2023)
COVID Vaccine doses administered (per 100k population) (Sep 19, 2023)
COVID Vaccine doses distributed (Sep 19, 2023)
COVID Vaccine doses administered (Sep 19, 2023)
Likely homosexual households (%)
Likely homosexual households (% change since 2000)
Likely homosexual households - Lesbian couples (%)
Likely homosexual households - Lesbian couples (% change since 2000)
Likely homosexual households - Gay men (%)
Likely homosexual households - Gay men (% change since 2000)
Cost of living index
Median gross rent ($)
Median contract rent ($)
Median monthly housing costs ($)
Median house or condo value ($)
Median house or condo value ($ change since 2000)
Mean house or condo value by units in structure - 1, detached ($)
Mean house or condo value by units in structure - 1, attached ($)
Mean house or condo value by units in structure - 2 ($)
Mean house or condo value by units in structure by units in structure - 3 or 4 ($)
Mean house or condo value by units in structure - 5 or more ($)
Mean house or condo value by units in structure - Boat, RV, van, etc. ($)
Mean house or condo value by units in structure - Mobile home ($)
Median house or condo value ($) - White
Median house or condo value ($) - Black or African American
Median house or condo value ($) - Asian
Median house or condo value ($) - Hispanic or Latino
Median house or condo value ($) - American Indian and Alaska Native
Median house or condo value ($) - Multirace
Median house or condo value ($) - Other Race
Median resident age
Resident age diversity
Median resident age - Males
Median resident age - Females
Median resident age - White
Median resident age - Black or African American
Median resident age - Asian
Median resident age - Hispanic or Latino
Median resident age - American Indian and Alaska Native
Median resident age - Multirace
Median resident age - Other Race
Median resident age - Males - White
Median resident age - Males - Black or African American
Median resident age - Males - Asian
Median resident age - Males - Hispanic or Latino
Median resident age - Males - American Indian and Alaska Native
Median resident age - Males - Multirace
Median resident age - Males - Other Race
Median resident age - Females - White
Median resident age - Females - Black or African American
Median resident age - Females - Asian
Median resident age - Females - Hispanic or Latino
Median resident age - Females - American Indian and Alaska Native
Median resident age - Females - Multirace
Median resident age - Females - Other Race
Commute - mean travel time to work (minutes)
Travel time to work - Less than 5 minutes (%)
Travel time to work - Less than 5 minutes (% change since 2000)
Travel time to work - 5 to 9 minutes (%)
Travel time to work - 5 to 9 minutes (% change since 2000)
Travel time to work - 10 to 19 minutes (%)
Travel time to work - 10 to 19 minutes (% change since 2000)
Travel time to work - 20 to 29 minutes (%)
Travel time to work - 20 to 29 minutes (% change since 2000)
Travel time to work - 30 to 39 minutes (%)
Travel time to work - 30 to 39 minutes (% change since 2000)
Travel time to work - 40 to 59 minutes (%)
Travel time to work - 40 to 59 minutes (% change since 2000)
Travel time to work - 60 to 89 minutes (%)
Travel time to work - 60 to 89 minutes (% change since 2000)
Travel time to work - 90 or more minutes (%)
Travel time to work - 90 or more minutes (% change since 2000)
Marital status - Never married (%)
Marital status - Now married (%)
Marital status - Separated (%)
Marital status - Widowed (%)
Marital status - Divorced (%)
Median family income ($)
Median family income (% change since 2000)
Median non-family income ($)
Median non-family income (% change since 2000)
Median per capita income ($)
Median per capita income (% change since 2000)
Median family income ($) - White
Median family income ($) - Black or African American
Median family income ($) - Asian
Median family income ($) - Hispanic or Latino
Median family income ($) - American Indian and Alaska Native
Median family income ($) - Multirace
Median family income ($) - Other Race
Median year house/condo built
Median year apartment built
Year house built - Built 2005 or later (%)
Year house built - Built 2000 to 2004 (%)
Year house built - Built 1990 to 1999 (%)
Year house built - Built 1980 to 1989 (%)
Year house built - Built 1970 to 1979 (%)
Year house built - Built 1960 to 1969 (%)
Year house built - Built 1950 to 1959 (%)
Year house built - Built 1940 to 1949 (%)
Year house built - Built 1939 or earlier (%)
Average household size
Household density (households per square mile)
Average household size - White
Average household size - Black or African American
Average household size - Asian
Average household size - Hispanic or Latino
Average household size - American Indian and Alaska Native
Average household size - Multirace
Average household size - Other Race
Occupied housing units (%)
Vacant housing units (%)
Owner occupied housing units (%)
Renter occupied housing units (%)
Vacancy status - For rent (%)
Vacancy status - For sale only (%)
Vacancy status - Rented or sold, not occupied (%)
Vacancy status - For seasonal, recreational, or occasional use (%)
Vacancy status - For migrant workers (%)
Vacancy status - Other vacant (%)
Residents with income below the poverty level (%)
Residents with income below 50% of the poverty level (%)
Children below poverty level (%)
Poor families by family type - Married-couple family (%)
Poor families by family type - Male, no wife present (%)
Poor families by family type - Female, no husband present (%)
Poverty status for native-born residents (%)
Poverty status for foreign-born residents (%)
Poverty among high school graduates not in families (%)
Poverty among people who did not graduate high school not in families (%)
Residents with income below the poverty level (%) - White
Residents with income below the poverty level (%) - Black or African American
Residents with income below the poverty level (%) - Asian
Residents with income below the poverty level (%) - Hispanic or Latino
Residents with income below the poverty level (%) - American Indian and Alaska Native
Residents with income below the poverty level (%) - Multirace
Residents with income below the poverty level (%) - Other Race
Air pollution - Air Quality Index (AQI)
Air pollution - CO
Air pollution - NO2
Air pollution - SO2
Air pollution - Ozone
Air pollution - PM10
Air pollution - PM25
Air pollution - Pb
Crime - Murders per 100,000 population
Crime - Rapes per 100,000 population
Crime - Robberies per 100,000 population
Crime - Assaults per 100,000 population
Crime - Burglaries per 100,000 population
Crime - Thefts per 100,000 population
Crime - Auto thefts per 100,000 population
Crime - Arson per 100,000 population
Crime - City-data.com crime index
Crime - Violent crime index
Crime - Property crime index
Crime - Murders per 100,000 population (5 year average)
Crime - Rapes per 100,000 population (5 year average)
Crime - Robberies per 100,000 population (5 year average)
Crime - Assaults per 100,000 population (5 year average)
Crime - Burglaries per 100,000 population (5 year average)
Crime - Thefts per 100,000 population (5 year average)
Crime - Auto thefts per 100,000 population (5 year average)
Crime - Arson per 100,000 population (5 year average)
Crime - City-data.com crime index (5 year average)
Crime - Violent crime index (5 year average)
Crime - Property crime index (5 year average)
1996 Presidential Elections Results (%) - Democratic Party (Clinton)
1996 Presidential Elections Results (%) - Republican Party (Dole)
1996 Presidential Elections Results (%) - Other
2000 Presidential Elections Results (%) - Democratic Party (Gore)
2000 Presidential Elections Results (%) - Republican Party (Bush)
2000 Presidential Elections Results (%) - Other
2004 Presidential Elections Results (%) - Democratic Party (Kerry)
2004 Presidential Elections Results (%) - Republican Party (Bush)
2004 Presidential Elections Results (%) - Other
2008 Presidential Elections Results (%) - Democratic Party (Obama)
2008 Presidential Elections Results (%) - Republican Party (McCain)
2008 Presidential Elections Results (%) - Other
2012 Presidential Elections Results (%) - Democratic Party (Obama)
2012 Presidential Elections Results (%) - Republican Party (Romney)
2012 Presidential Elections Results (%) - Other
2016 Presidential Elections Results (%) - Democratic Party (Clinton)
2016 Presidential Elections Results (%) - Republican Party (Trump)
2016 Presidential Elections Results (%) - Other
2020 Presidential Elections Results (%) - Democratic Party (Biden)
2020 Presidential Elections Results (%) - Republican Party (Trump)
2020 Presidential Elections Results (%) - Other
Ancestries Reported - Arab (%)
Ancestries Reported - Czech (%)
Ancestries Reported - Danish (%)
Ancestries Reported - Dutch (%)
Ancestries Reported - English (%)
Ancestries Reported - French (%)
Ancestries Reported - French Canadian (%)
Ancestries Reported - German (%)
Ancestries Reported - Greek (%)
Ancestries Reported - Hungarian (%)
Ancestries Reported - Irish (%)
Ancestries Reported - Italian (%)
Ancestries Reported - Lithuanian (%)
Ancestries Reported - Norwegian (%)
Ancestries Reported - Polish (%)
Ancestries Reported - Portuguese (%)
Ancestries Reported - Russian (%)
Ancestries Reported - Scotch-Irish (%)
Ancestries Reported - Scottish (%)
Ancestries Reported - Slovak (%)
Ancestries Reported - Subsaharan African (%)
Ancestries Reported - Swedish (%)
Ancestries Reported - Swiss (%)
Ancestries Reported - Ukrainian (%)
Ancestries Reported - United States (%)
Ancestries Reported - Welsh (%)
Ancestries Reported - West Indian (%)
Ancestries Reported - Other (%)
Educational Attainment - No schooling completed (%)
Educational Attainment - Less than high school (%)
Educational Attainment - High school or equivalent (%)
Educational Attainment - Less than 1 year of college (%)
Educational Attainment - 1 or more years of college (%)
Educational Attainment - Associate degree (%)
Educational Attainment - Bachelor's degree (%)
Educational Attainment - Master's degree (%)
Educational Attainment - Professional school degree (%)
Educational Attainment - Doctorate degree (%)
School Enrollment - Nursery, preschool (%)
School Enrollment - Kindergarten (%)
School Enrollment - Grade 1 to 4 (%)
School Enrollment - Grade 5 to 8 (%)
School Enrollment - Grade 9 to 12 (%)
School Enrollment - College undergrad (%)
School Enrollment - Graduate or professional (%)
School Enrollment - Not enrolled in school (%)
School enrollment - Public schools (%)
School enrollment - Private schools (%)
School enrollment - Not enrolled (%)
Median number of rooms in houses and condos
Median number of rooms in apartments
Housing units lacking complete plumbing facilities (%)
Housing units lacking complete kitchen facilities (%)
Density of houses
Urban houses (%)
Rural houses (%)
Households with people 60 years and over (%)
Households with people 65 years and over (%)
Households with people 75 years and over (%)
Households with one or more nonrelatives (%)
Households with no nonrelatives (%)
Population in households (%)
Family households (%)
Nonfamily households (%)
Population in families (%)
Family households with own children (%)
Median number of bedrooms in owner occupied houses
Mean number of bedrooms in owner occupied houses
Median number of bedrooms in renter occupied houses
Mean number of bedrooms in renter occupied houses
Median number of vehichles in owner occupied houses
Mean number of vehichles in owner occupied houses
Median number of vehichles in renter occupied houses
Mean number of vehichles in renter occupied houses
Mortgage status - with mortgage (%)
Mortgage status - with second mortgage (%)
Mortgage status - with home equity loan (%)
Mortgage status - with both second mortgage and home equity loan (%)
Mortgage status - without a mortgage (%)
Average family size
Average family size - White
Average family size - Black or African American
Average family size - Asian
Average family size - Hispanic or Latino
Average family size - American Indian and Alaska Native
Average family size - Multirace
Average family size - Other Race
Geographical mobility - Same house 1 year ago (%)
Geographical mobility - Moved within same county (%)
Geographical mobility - Moved from different county within same state (%)
Geographical mobility - Moved from different state (%)
Geographical mobility - Moved from abroad (%)
Place of birth - Born in state of residence (%)
Place of birth - Born in other state (%)
Place of birth - Native, outside of US (%)
Place of birth - Foreign born (%)
Housing units in structures - 1, detached (%)
Housing units in structures - 1, attached (%)
Housing units in structures - 2 (%)
Housing units in structures - 3 or 4 (%)
Housing units in structures - 5 to 9 (%)
Housing units in structures - 10 to 19 (%)
Housing units in structures - 20 to 49 (%)
Housing units in structures - 50 or more (%)
Housing units in structures - Mobile home (%)
Housing units in structures - Boat, RV, van, etc. (%)
House/condo owner moved in on average (years ago)
Renter moved in on average (years ago)
Year householder moved into unit - Moved in 1999 to March 2000 (%)
Year householder moved into unit - Moved in 1995 to 1998 (%)
Year householder moved into unit - Moved in 1990 to 1994 (%)
Year householder moved into unit - Moved in 1980 to 1989 (%)
Year householder moved into unit - Moved in 1970 to 1979 (%)
Year householder moved into unit - Moved in 1969 or earlier (%)
Means of transportation to work - Drove car alone (%)
Means of transportation to work - Carpooled (%)
Means of transportation to work - Public transportation (%)
Means of transportation to work - Bus or trolley bus (%)
Means of transportation to work - Streetcar or trolley car (%)
Means of transportation to work - Subway or elevated (%)
Means of transportation to work - Railroad (%)
Means of transportation to work - Ferryboat (%)
Means of transportation to work - Taxicab (%)
Means of transportation to work - Motorcycle (%)
Means of transportation to work - Bicycle (%)
Means of transportation to work - Walked (%)
Means of transportation to work - Other means (%)
Working at home (%)
Industry diversity
Most Common Industries - Agriculture, forestry, fishing and hunting, and mining (%)
Most Common Industries - Agriculture, forestry, fishing and hunting (%)
Most Common Industries - Mining, quarrying, and oil and gas extraction (%)
Most Common Industries - Construction (%)
Most Common Industries - Manufacturing (%)
Most Common Industries - Wholesale trade (%)
Most Common Industries - Retail trade (%)
Most Common Industries - Transportation and warehousing, and utilities (%)
Most Common Industries - Transportation and warehousing (%)
Most Common Industries - Utilities (%)
Most Common Industries - Information (%)
Most Common Industries - Finance and insurance, and real estate and rental and leasing (%)
Most Common Industries - Finance and insurance (%)
Most Common Industries - Real estate and rental and leasing (%)
Most Common Industries - Professional, scientific, and management, and administrative and waste management services (%)
Most Common Industries - Professional, scientific, and technical services (%)
Most Common Industries - Management of companies and enterprises (%)
Most Common Industries - Administrative and support and waste management services (%)
Most Common Industries - Educational services, and health care and social assistance (%)
Most Common Industries - Educational services (%)
Most Common Industries - Health care and social assistance (%)
Most Common Industries - Arts, entertainment, and recreation, and accommodation and food services (%)
Most Common Industries - Arts, entertainment, and recreation (%)
Most Common Industries - Accommodation and food services (%)
Most Common Industries - Other services, except public administration (%)
Most Common Industries - Public administration (%)
Occupation diversity
Most Common Occupations - Management, business, science, and arts occupations (%)
Most Common Occupations - Management, business, and financial occupations (%)
Most Common Occupations - Management occupations (%)
Most Common Occupations - Business and financial operations occupations (%)
Most Common Occupations - Computer, engineering, and science occupations (%)
Most Common Occupations - Computer and mathematical occupations (%)
Most Common Occupations - Architecture and engineering occupations (%)
Most Common Occupations - Life, physical, and social science occupations (%)
Most Common Occupations - Education, legal, community service, arts, and media occupations (%)
Most Common Occupations - Community and social service occupations (%)
Most Common Occupations - Legal occupations (%)
Most Common Occupations - Education, training, and library occupations (%)
Most Common Occupations - Arts, design, entertainment, sports, and media occupations (%)
Most Common Occupations - Healthcare practitioners and technical occupations (%)
Most Common Occupations - Health diagnosing and treating practitioners and other technical occupations (%)
Most Common Occupations - Health technologists and technicians (%)
Most Common Occupations - Service occupations (%)
Most Common Occupations - Healthcare support occupations (%)
Most Common Occupations - Protective service occupations (%)
Most Common Occupations - Fire fighting and prevention, and other protective service workers including supervisors (%)
Most Common Occupations - Law enforcement workers including supervisors (%)
Most Common Occupations - Food preparation and serving related occupations (%)
Most Common Occupations - Building and grounds cleaning and maintenance occupations (%)
Most Common Occupations - Personal care and service occupations (%)
Most Common Occupations - Sales and office occupations (%)
Most Common Occupations - Sales and related occupations (%)
Most Common Occupations - Office and administrative support occupations (%)
Most Common Occupations - Natural resources, construction, and maintenance occupations (%)
Most Common Occupations - Farming, fishing, and forestry occupations (%)
Most Common Occupations - Construction and extraction occupations (%)
Most Common Occupations - Installation, maintenance, and repair occupations (%)
Most Common Occupations - Production, transportation, and material moving occupations (%)
Most Common Occupations - Production occupations (%)
Most Common Occupations - Transportation occupations (%)
Most Common Occupations - Material moving occupations (%)
People in Group quarters - Institutionalized population (%)
People in Group quarters - Correctional institutions (%)
People in Group quarters - Federal prisons and detention centers (%)
People in Group quarters - Halfway houses (%)
People in Group quarters - Local jails and other confinement facilities (including police lockups) (%)
People in Group quarters - Military disciplinary barracks (%)
People in Group quarters - State prisons (%)
People in Group quarters - Other types of correctional institutions (%)
People in Group quarters - Nursing homes (%)
People in Group quarters - Hospitals/wards, hospices, and schools for the handicapped (%)
People in Group quarters - Hospitals/wards and hospices for chronically ill (%)
People in Group quarters - Hospices or homes for chronically ill (%)
People in Group quarters - Military hospitals or wards for chronically ill (%)
People in Group quarters - Other hospitals or wards for chronically ill (%)
People in Group quarters - Hospitals or wards for drug/alcohol abuse (%)
People in Group quarters - Mental (Psychiatric) hospitals or wards (%)
People in Group quarters - Schools, hospitals, or wards for the mentally retarded (%)
People in Group quarters - Schools, hospitals, or wards for the physically handicapped (%)
People in Group quarters - Institutions for the deaf (%)
People in Group quarters - Institutions for the blind (%)
People in Group quarters - Orthopedic wards and institutions for the physically handicapped (%)
People in Group quarters - Wards in general hospitals for patients who have no usual home elsewhere (%)
People in Group quarters - Wards in military hospitals for patients who have no usual home elsewhere (%)
People in Group quarters - Juvenile institutions (%)
People in Group quarters - Long-term care (%)
People in Group quarters - Homes for abused, dependent, and neglected children (%)
People in Group quarters - Residential treatment centers for emotionally disturbed children (%)
People in Group quarters - Training schools for juvenile delinquents (%)
People in Group quarters - Short-term care, detention or diagnostic centers for delinquent children (%)
People in Group quarters - Type of juvenile institution unknown (%)
People in Group quarters - Noninstitutionalized population (%)
People in Group quarters - College dormitories (includes college quarters off campus) (%)
People in Group quarters - Military quarters (%)
People in Group quarters - On base (%)
People in Group quarters - Barracks, unaccompanied personnel housing (UPH), (Enlisted/Officer), ;and similar group living quarters for military personnel (%)
People in Group quarters - Transient quarters for temporary residents (%)
People in Group quarters - Military ships (%)
People in Group quarters - Group homes (%)
People in Group quarters - Homes or halfway houses for drug/alcohol abuse (%)
People in Group quarters - Homes for the mentally ill (%)
People in Group quarters - Homes for the mentally retarded (%)
People in Group quarters - Homes for the physically handicapped (%)
People in Group quarters - Other group homes (%)
People in Group quarters - Religious group quarters (%)
People in Group quarters - Dormitories (%)
People in Group quarters - Agriculture workers' dormitories on farms (%)
People in Group quarters - Job Corps and vocational training facilities (%)
People in Group quarters - Other workers' dormitories (%)
People in Group quarters - Crews of maritime vessels (%)
People in Group quarters - Other nonhousehold living situations (%)
People in Group quarters - Other noninstitutional group quarters (%)
Residents speaking English at home (%)
Residents speaking English at home - Born in the United States (%)
Residents speaking English at home - Native, born elsewhere (%)
Residents speaking English at home - Foreign born (%)
Residents speaking Spanish at home (%)
Residents speaking Spanish at home - Born in the United States (%)
Residents speaking Spanish at home - Native, born elsewhere (%)
Residents speaking Spanish at home - Foreign born (%)
Residents speaking other language at home (%)
Residents speaking other language at home - Born in the United States (%)
Residents speaking other language at home - Native, born elsewhere (%)
Residents speaking other language at home - Foreign born (%)
Class of Workers - Employee of private company (%)
Class of Workers - Self-employed in own incorporated business (%)
Class of Workers - Private not-for-profit wage and salary workers (%)
Class of Workers - Local government workers (%)
Class of Workers - State government workers (%)
Class of Workers - Federal government workers (%)
Class of Workers - Self-employed workers in own not incorporated business and Unpaid family workers (%)
House heating fuel used in houses and condos - Utility gas (%)
House heating fuel used in houses and condos - Bottled, tank, or LP gas (%)
House heating fuel used in houses and condos - Electricity (%)
House heating fuel used in houses and condos - Fuel oil, kerosene, etc. (%)
House heating fuel used in houses and condos - Coal or coke (%)
House heating fuel used in houses and condos - Wood (%)
House heating fuel used in houses and condos - Solar energy (%)
House heating fuel used in houses and condos - Other fuel (%)
House heating fuel used in houses and condos - No fuel used (%)
House heating fuel used in apartments - Utility gas (%)
House heating fuel used in apartments - Bottled, tank, or LP gas (%)
House heating fuel used in apartments - Electricity (%)
House heating fuel used in apartments - Fuel oil, kerosene, etc. (%)
House heating fuel used in apartments - Coal or coke (%)
House heating fuel used in apartments - Wood (%)
House heating fuel used in apartments - Solar energy (%)
House heating fuel used in apartments - Other fuel (%)
House heating fuel used in apartments - No fuel used (%)
Armed forces status - In Armed Forces (%)
Armed forces status - Civilian (%)
Armed forces status - Civilian - Veteran (%)
Armed forces status - Civilian - Nonveteran (%)
Fatal accidents locations in years 2005-2021
Fatal accidents locations in 2005
Fatal accidents locations in 2006
Fatal accidents locations in 2007
Fatal accidents locations in 2008
Fatal accidents locations in 2009
Fatal accidents locations in 2010
Fatal accidents locations in 2011
Fatal accidents locations in 2012
Fatal accidents locations in 2013
Fatal accidents locations in 2014
Fatal accidents locations in 2015
Fatal accidents locations in 2016
Fatal accidents locations in 2017
Fatal accidents locations in 2018
Fatal accidents locations in 2019
Fatal accidents locations in 2020
Fatal accidents locations in 2021
Alcohol use - People drinking some alcohol every month (%)
Alcohol use - People not drinking at all (%)
Alcohol use - Average days/month drinking alcohol
Alcohol use - Average drinks/week
Alcohol use - Average days/year people drink much
Audiometry - Average condition of hearing (%)
Audiometry - People that can hear a whisper from across a quiet room (%)
Audiometry - People that can hear normal voice from across a quiet room (%)
Audiometry - Ears ringing, roaring, buzzing (%)
Audiometry - Had a job exposure to loud noise (%)
Audiometry - Had off-work exposure to loud noise (%)
Blood Pressure & Cholesterol - Has high blood pressure (%)
Blood Pressure & Cholesterol - Checking blood pressure at home (%)
Blood Pressure & Cholesterol - Frequently checking blood cholesterol (%)
Blood Pressure & Cholesterol - Has high cholesterol level (%)
Consumer Behavior - Money monthly spent on food at supermarket/grocery store
Consumer Behavior - Money monthly spent on food at other stores
Consumer Behavior - Money monthly spent on eating out
Consumer Behavior - Money monthly spent on carryout/delivered foods
Consumer Behavior - Income spent on food at supermarket/grocery store (%)
Consumer Behavior - Income spent on food at other stores (%)
Consumer Behavior - Income spent on eating out (%)
Consumer Behavior - Income spent on carryout/delivered foods (%)
Current Health Status - General health condition (%)
Current Health Status - Blood donors (%)
Current Health Status - Has blood ever tested for HIV virus (%)
Current Health Status - Left-handed people (%)
Dermatology - People using sunscreen (%)
Diabetes - Diabetics (%)
Diabetes - Had a blood test for high blood sugar (%)
Diabetes - People taking insulin (%)
Diet Behavior & Nutrition - Diet health (%)
Diet Behavior & Nutrition - Milk product consumption (# of products/month)
Diet Behavior & Nutrition - Meals not home prepared (#/week)
Diet Behavior & Nutrition - Meals from fast food or pizza place (#/week)
Diet Behavior & Nutrition - Ready-to-eat foods (#/month)
Diet Behavior & Nutrition - Frozen meals/pizza (#/month)
Drug Use - People that ever used marijuana or hashish (%)
Drug Use - Ever used hard drugs (%)
Drug Use - Ever used any form of cocaine (%)
Drug Use - Ever used heroin (%)
Drug Use - Ever used methamphetamine (%)
Health Insurance - People covered by health insurance (%)
Kidney Conditions-Urology - Avg. # of times urinating at night
Medical Conditions - People with asthma (%)
Medical Conditions - People with anemia (%)
Medical Conditions - People with psoriasis (%)
Medical Conditions - People with overweight (%)
Medical Conditions - Elderly people having difficulties in thinking or remembering (%)
Medical Conditions - People who ever received blood transfusion (%)
Medical Conditions - People having trouble seeing even with glass/contacts (%)
Medical Conditions - People with arthritis (%)
Medical Conditions - People with gout (%)
Medical Conditions - People with congestive heart failure (%)
Medical Conditions - People with coronary heart disease (%)
Medical Conditions - People with angina pectoris (%)
Medical Conditions - People who ever had heart attack (%)
Medical Conditions - People who ever had stroke (%)
Medical Conditions - People with emphysema (%)
Medical Conditions - People with thyroid problem (%)
Medical Conditions - People with chronic bronchitis (%)
Medical Conditions - People with any liver condition (%)
Medical Conditions - People who ever had cancer or malignancy (%)
Mental Health - People who have little interest in doing things (%)
Mental Health - People feeling down, depressed, or hopeless (%)
Mental Health - People who have trouble sleeping or sleeping too much (%)
Mental Health - People feeling tired or having little energy (%)
Mental Health - People with poor appetite or overeating (%)
Mental Health - People feeling bad about themself (%)
Mental Health - People who have trouble concentrating on things (%)
Mental Health - People moving or speaking slowly or too fast (%)
Mental Health - People having thoughts they would be better off dead (%)
Oral Health - Average years since last visit a dentist
Oral Health - People embarrassed because of mouth (%)
Oral Health - People with gum disease (%)
Oral Health - General health of teeth and gums (%)
Oral Health - Average days a week using dental floss/device
Oral Health - Average days a week using mouthwash for dental problem
Oral Health - Average number of teeth
Pesticide Use - Households using pesticides to control insects (%)
Pesticide Use - Households using pesticides to kill weeds (%)
Physical Activity - People doing vigorous-intensity work activities (%)
Physical Activity - People doing moderate-intensity work activities (%)
Physical Activity - People walking or bicycling (%)
Physical Activity - People doing vigorous-intensity recreational activities (%)
Physical Activity - People doing moderate-intensity recreational activities (%)
Physical Activity - Average hours a day doing sedentary activities
Physical Activity - Average hours a day watching TV or videos
Physical Activity - Average hours a day using computer
Physical Functioning - People having limitations keeping them from working (%)
Physical Functioning - People limited in amount of work they can do (%)
Physical Functioning - People that need special equipment to walk (%)
Physical Functioning - People experiencing confusion/memory problems (%)
Physical Functioning - People requiring special healthcare equipment (%)
Prescription Medications - Average number of prescription medicines taking
Preventive Aspirin Use - Adults 40+ taking low-dose aspirin (%)
Reproductive Health - Vaginal deliveries (%)
Reproductive Health - Cesarean deliveries (%)
Reproductive Health - Deliveries resulted in a live birth (%)
Reproductive Health - Pregnancies resulted in a delivery (%)
Reproductive Health - Women breastfeeding newborns (%)
Reproductive Health - Women that had a hysterectomy (%)
Reproductive Health - Women that had both ovaries removed (%)
Reproductive Health - Women that have ever taken birth control pills (%)
Reproductive Health - Women taking birth control pills (%)
Reproductive Health - Women that have ever used Depo-Provera or injectables (%)
Reproductive Health - Women that have ever used female hormones (%)
Sexual Behavior - People 18+ that ever had sex (vaginal, anal, or oral) (%)
Sexual Behavior - Males 18+ that ever had vaginal sex with a woman (%)
Sexual Behavior - Males 18+ that ever performed oral sex on a woman (%)
Sexual Behavior - Males 18+ that ever had anal sex with a woman (%)
Sexual Behavior - Males 18+ that ever had any sex with a man (%)
Sexual Behavior - Females 18+ that ever had vaginal sex with a man (%)
Sexual Behavior - Females 18+ that ever performed oral sex on a man (%)
Sexual Behavior - Females 18+ that ever had anal sex with a man (%)
Sexual Behavior - Females 18+ that ever had any kind of sex with a woman (%)
Sexual Behavior - Average age people first had sex
Sexual Behavior - Average number of female sex partners in lifetime (males 18+)
Sexual Behavior - Average number of female vaginal sex partners in lifetime (males 18+)
Sexual Behavior - Average age people first performed oral sex on a woman (18+)
Sexual Behavior - Average number of woman performed oral sex on in lifetime (18+)
Sexual Behavior - Average number of male sex partners in lifetime (males 18+)
Sexual Behavior - Average number of male anal sex partners in lifetime (males 18+)
Sexual Behavior - Average age people first performed oral sex on a man (18+)
Sexual Behavior - Average number of male oral sex partners in lifetime (18+)
Sexual Behavior - People using protection when performing oral sex (%)
Sexual Behavior - Average number of times people have vaginal or anal sex a year
Sexual Behavior - People having sex without condom (%)
Sexual Behavior - Average number of male sex partners in lifetime (females 18+)
Sexual Behavior - Average number of male vaginal sex partners in lifetime (females 18+)
Sexual Behavior - Average number of female sex partners in lifetime (females 18+)
Sexual Behavior - Circumcised males 18+ (%)
Sleep Disorders - Average hours sleeping at night
Sleep Disorders - People that has trouble sleeping (%)
Smoking-Cigarette Use - People smoking cigarettes (%)
Taste & Smell - People 40+ having problems with smell (%)
Taste & Smell - People 40+ having problems with taste (%)
Taste & Smell - People 40+ that ever had wisdom teeth removed (%)
Taste & Smell - People 40+ that ever had tonsils teeth removed (%)
Taste & Smell - People 40+ that ever had a loss of consciousness because of a head injury (%)
Taste & Smell - People 40+ that ever had a broken nose or other serious injury to face or skull (%)
Taste & Smell - People 40+ that ever had two or more sinus infections (%)
Weight - Average height (inches)
Weight - Average weight (pounds)
Weight - Average BMI
Weight - People that are obese (%)
Weight - People that ever were obese (%)
Weight - People trying to lose weight (%)
Urban population: 8,275
Rural population: 2,832
Estimated median house/condo value in 2022: $349,535
95953:
$349,535California:
$715,900
Median resident age: This zip code:
36.2 yearsCalifornia median age:
37.9 years
Average household size: This zip code:
3.2 peopleCalifornia:
2.8 people
Averages for the 2020 tax year for zip code 95953, filed in 2021:
Average Adjusted Gross Income (AGI) in 2020: $52,172 (Individual Income Tax Returns) Here:
$52,172State:
$95,910
Salary/wage: $45,051 (reported on 85.1% of returns )Here:
$45,051State:
$77,331
(% of AGI for various income ranges: 1530.6% for AGIs below $25k , 4584.3% for AGIs $25k-50k , 8472.7% for AGIs $50k-75k , 11109.6% for AGIs $75k-100k , 20632.4% for AGIs $100k-200k , 88990.0% for AGIs over 200k ) Taxable interest for individuals: $1,204 (reported on 27.3% of returns )This zip code:
$1,204California:
$2,294
(% of AGI for various income ranges: 5.1% for AGIs below $25k , 16.8% for AGIs $25k-50k , 27.3% for AGIs $50k-75k , 66.2% for AGIs $75k-100k , 231.9% for AGIs $100k-200k , 3015.0% for AGIs over 200k ) Ordinary dividends: $7,719 (reported on 8.7% of returns )(% of AGI for various income ranges: 13.7% for AGIs below $25k , 23.3% for AGIs $25k-50k , 62.2% for AGIs $50k-75k , 53.5% for AGIs $75k-100k , 365.2% for AGIs $100k-200k , 8545.0% for AGIs over 200k ) Net capital gain/loss in AGI: +$17,304 (reported on 9.5% of returns )Here:
+$17,304State:
+$49,306
(% of AGI for various income ranges: 4.2% for AGIs below $25k , 25.9% for AGIs $25k-50k , 66.2% for AGIs $50k-75k , 82.7% for AGIs $75k-100k , 514.3% for AGIs $100k-200k , 30440.0% for AGIs over 200k ) Profit/loss from business: +$17,379 (reported on 12.6% of returns )Here:
+$17,379State:
+$15,671
(% of AGI for various income ranges: 92.5% for AGIs below $25k , 256.7% for AGIs $25k-50k , 444.9% for AGIs $50k-75k , 336.5% for AGIs $75k-100k , 2126.2% for AGIs $100k-200k ) Taxable individual retirement arrangement distribution: $17,436 (reported on 2.9% of returns )95953:
$17,436California:
$23,505
(% of AGI for various income ranges: 15.7% for AGIs below $25k , 36.5% for AGIs $25k-50k , 128.2% for AGIs $50k-75k , 156.9% for AGIs $75k-100k , 461.0% for AGIs $100k-200k ) Total itemized deductions: $37,621 (reported on 5.8% of returns )Here:
$37,621State:
$39,517
(% of AGI for various income ranges: 129.6% for AGIs $25k-50k , 288.4% for AGIs $50k-75k , 523.5% for AGIs $75k-100k , 1251.0% for AGIs $100k-200k , 20280.0% for AGIs over 200k ) Charity contributions: $5,943 (reported on 4.3% of returns )(% of AGI for various income ranges: 17.9% for AGIs $25k-50k , 25.3% for AGIs $50k-75k , 68.5% for AGIs $75k-100k , 198.1% for AGIs $100k-200k , 1875.0% for AGIs over 200k ) Taxes paid: $7,704 (reported on 5.8% of returns )(% of AGI for various income ranges: 26.8% for AGIs $25k-50k , 80.9% for AGIs $50k-75k , 153.1% for AGIs $75k-100k , 369.5% for AGIs $100k-200k , 1860.0% for AGIs over 200k ) Earned income credit: $2,259 (reported on 20.5% of returns )(% of AGI for various income ranges: 122.7% for AGIs below $25k , 111.4% for AGIs $25k-50k , 4.7% for AGIs $50k-75k ) Percentage of individuals using paid preparers for their 2020 taxes: 93.8%(% for various income ranges: 93.1% for AGIs below $25k , 93.9% for AGIs $25k-50k , 94.9% for AGIs $50k-75k , 93.2% for AGIs $75k-100k , 95.5% for AGIs $100k-200k , 90.0% for AGIs over 200k )
Averages for the 2012 tax year for zip code 95953, filed in 2013:
Average Adjusted Gross Income (AGI) in 2012: $43,116 (Individual Income Tax Returns) Here:
$43,116State:
$72,726
Salary/wage: $34,269 (reported on 86.5% of returns )Here:
$34,269State:
$59,079
(% of AGI for various income ranges: 73.7% for AGIs below $25k , 78.8% for AGIs $25k-50k , 78.2% for AGIs $50k-75k , 78.8% for AGIs $75k-100k , 67.0% for AGIs $100k-200k , 27.9% for AGIs over 200k ) Taxable interest for individuals: $1,067 (reported on 29.4% of returns )This zip code:
$1,067California:
$2,146
(% of AGI for various income ranges: 0.5% for AGIs below $25k , 0.3% for AGIs $25k-50k , 0.7% for AGIs $50k-75k , 0.5% for AGIs $75k-100k , 1.5% for AGIs $100k-200k , 1.0% for AGIs over 200k ) Ordinary dividends: $4,532 (reported on 9.2% of returns )(% of AGI for various income ranges: 0.6% for AGIs below $25k , 0.6% for AGIs $25k-50k , 0.5% for AGIs $50k-75k , 0.4% for AGIs $75k-100k , 1.1% for AGIs $100k-200k , 3.0% for AGIs over 200k ) Net capital gain/loss in AGI: +$12,359 (reported on 7.8% of returns )Here:
+$12,359State:
+$30,460
(% of AGI for various income ranges: 0.3% for AGIs $25k-50k , 0.3% for AGIs $50k-75k , 2.9% for AGIs $100k-200k , 11.6% for AGIs over 200k ) Profit/loss from business: +$10,473 (reported on 13.2% of returns )Here:
+$10,473State:
+$17,064
(% of AGI for various income ranges: 7.3% for AGIs below $25k , 4.0% for AGIs $25k-50k , 3.0% for AGIs $50k-75k , 2.7% for AGIs $75k-100k , 2.0% for AGIs $100k-200k ) Taxable individual retirement arrangement distribution: $10,437 (reported on 5.1% of returns )95953:
$10,437California:
$19,557
(% of AGI for various income ranges: 1.4% for AGIs below $25k , 1.0% for AGIs $25k-50k , 1.3% for AGIs $50k-75k , 1.0% for AGIs $75k-100k , 2.7% for AGIs $100k-200k ) Total itemized deductions: $22,153 (25% of AGI, reported on 25.1% of returns )Here:
$22,153State:
$34,004
Here:
24.8% of AGIState:
22.7% of AGI
(% of AGI for various income ranges: 5.5% for AGIs below $25k , 9.8% for AGIs $25k-50k , 15.4% for AGIs $50k-75k , 17.9% for AGIs $75k-100k , 17.0% for AGIs $100k-200k , 12.6% for AGIs over 200k ) Charity contributions: $2,919 (reported on 19.7% of returns )(% of AGI for various income ranges: 0.3% for AGIs below $25k , 1.1% for AGIs $25k-50k , 1.4% for AGIs $50k-75k , 1.8% for AGIs $75k-100k , 2.0% for AGIs $100k-200k , 1.3% for AGIs over 200k ) Taxes paid: $6,875 (reported on 25.1% of returns )95953:
$6,875State:
$14,448
(% of AGI for various income ranges: 1.0% for AGIs below $25k , 2.0% for AGIs $25k-50k , 3.9% for AGIs $50k-75k , 5.2% for AGIs $75k-100k , 6.3% for AGIs $100k-200k , 6.6% for AGIs over 200k ) Earned income credit: $2,415 (reported on 29.4% of returns )(% of AGI for various income ranges: 8.1% for AGIs below $25k , 2.2% for AGIs $25k-50k ) Percentage of individuals using paid preparers for their 2012 taxes: 72.0%(% for various income ranges: 69.0% for AGIs below $25k , 72.2% for AGIs $25k-50k , 74.5% for AGIs $50k-75k , 76.0% for AGIs $75k-100k , 78.9% for AGIs $100k-200k , 100.0% for AGIs over 200k )
Averages for the 2004 tax year for zip code 95953, filed in 2005:
Average Adjusted Gross Income (AGI) in 2004: $31,068 (Individual Income Tax Returns) Here:
$31,068State:
$58,600
Salary/wage: $27,689 (reported on 86.9% of returns )Here:
$27,689State:
$49,455
(% of AGI for various income ranges: 78.4% for AGIs $10k-25k , 82.8% for AGIs $25k-50k , 81.6% for AGIs $50k-75k , 73.2% for AGIs $75k-100k , 38.9% for AGIs over 100k ) Taxable interest for individuals: $1,470 (reported on 32.6% of returns )This zip code:
$1,470California:
$2,365
(% of AGI for various income ranges: 1.0% for AGIs $10k-25k , 0.8% for AGIs $25k-50k , 1.1% for AGIs $50k-75k , 1.9% for AGIs $75k-100k , 2.2% for AGIs over 100k ) Taxable dividends: $4,044 (reported on 11.8% of returns )(% of AGI for various income ranges: 0.6% for AGIs $10k-25k , 0.4% for AGIs $25k-50k , 0.9% for AGIs $50k-75k , 0.8% for AGIs $75k-100k , 3.5% for AGIs over 100k ) Net capital gain/loss: +$14,338 (reported on 10.9% of returns )Here:
+$14,338State:
+$23,418
(% of AGI for various income ranges: 0.6% for AGIs $10k-25k , 0.3% for AGIs $25k-50k , 1.5% for AGIs $50k-75k , 1.9% for AGIs $75k-100k , 15.8% for AGIs over 100k ) Profit/loss from business: +$12,389 (reported on 12.8% of returns )Here:
+$12,389State:
+$16,826
(% of AGI for various income ranges: 4.8% for AGIs $10k-25k , 4.2% for AGIs $25k-50k , 2.6% for AGIs $50k-75k , 4.7% for AGIs $75k-100k , 7.2% for AGIs over 100k ) IRA payment deduction: $2,582 (reported on 1.7% of returns )95953:
$2,582California:
$3,192
Self-employed pension: $17,632 (reported on 0.6% of returns )Here:
$17,632California:
$17,688
Total itemized deductions: $17,975 (24% of AGI, reported on 22.0% of returns )Here:
$17,975State:
$28,113
Here:
24.3% of AGIState:
25.3% of AGI
(% of AGI for various income ranges: 6.8% for AGIs $10k-25k , 10.6% for AGIs $25k-50k , 15.6% for AGIs $50k-75k , 17.1% for AGIs $75k-100k , 12.0% for AGIs over 100k ) Charity contributions deductions: $2,583 (3% of AGI, reported on 18.7% of returns )Here:
3.3% of AGIState:
3.3% of AGI
(% of AGI for various income ranges: 0.6% for AGIs $10k-25k , 1.3% for AGIs $25k-50k , 1.8% for AGIs $50k-75k , 2.7% for AGIs $75k-100k , 1.4% for AGIs over 100k ) Total tax: $4,697 (reported on 60.3% of returns )95953:
$4,697State:
$10,761
(% of AGI for various income ranges: 3.2% for AGIs $10k-25k , 4.9% for AGIs $25k-50k , 7.2% for AGIs $50k-75k , 10.4% for AGIs $75k-100k , 18.1% for AGIs over 100k ) Earned income credit: $1,789 (reported on 26.5% of returns )Percentage of individuals using paid preparers for their 2004 taxes: 70.4%(% for various income ranges: 67.4% for AGIs below $10k , 69.0% for AGIs $10k-25k , 69.9% for AGIs $25k-50k , 75.7% for AGIs $50k-75k , 71.0% for AGIs $75k-100k , 90.0% for AGIs over 100k )
Estimated median household income in 2022: This zip code:
$68,685California:
$91,551
Nearest zip codes: 95948 ,
95982 ,
95917 ,
95993 ,
95932 ,
95957 .
Percentage of family households: This zip code:
53.1%California:
46.8%
Percentage of households with unmarried partners: This zip code:
6.6%California:
48.1%
No gay or lesbian households reported
Household received Food Stamps/SNAP in the past 12 months: 933Household did not receive Food Stamps/SNAP in the past 12 months: 2,637
Women who had a birth in the past 12 months: 199 (120 now married , 79 unmarried) Women who did not have a birth in the past 12 months: 2,081 (882 now married , 1,196 unmarried)
Housing units in zip code 95953 with a mortgage: 1,402 (121
second mortgage , 20
home equity loan , 34
both second mortgage and home equity loan )
Houses without a mortgage: 12
Median monthly owner costs for units with a mortgage: $1,733
Median monthly owner costs for units without a mortgage: $587
Residents with income below the poverty level in 2022:
This zip code:
16.4%Whole state:
12.2%
Residents with income below 50% of the poverty level in 2022:
This zip code:
7.1%Whole state:
6.2%
Median number of rooms in houses and condos: Median number of rooms in apartments: Notable locations in this zip code not listed on our city pages
Click to draw/clear zip code borders Notable locations in zip code 95953: (A) , Sunset Pumping Station (B) , Field and Tule Club (C) , Leo Chesney Correctional Center (D) , Winchester Gun Club (E) , Sutter Butte Outing Club (F) , Barber Branch Sutter County Free Library (G) , Live Oak Fire Department (H) . Display/hide their locations on the map
Church in zip code 95953: (A) . Display/hide its location on the map
Cemeteries: (1) , Pugh Cemetery (2) , North Butte Cemetery (3) . Display/hide their locations on the map
Swamps: (A) . Display/hide its location on the map
Streams, rivers, and creeks: (A) , Morrison Slough (B) . Display/hide their locations on the map
Parks in zip code 95953 include: (1) , Live Oak Memorial Park (2) . Display/hide their locations on the map
Year house built (houses)
8 2020 or later465 2010 to 2019807 2000 to 2009309 1990 to 1999335 1980 to 1989503 1970 to 1979371 1960 to 1969329 1950 to 1959390 1940 to 1949220 1939 or earlier
Zip code 95953 household income distribution in 2022 171 Less than $10,000268 $10,000 to $14,999108 $15,000 to $19,999198 $20,000 to $24,99965 $25,000 to $29,99956 $30,000 to $34,999108 $35,000 to $39,999222 $40,000 to $44,999102 $45,000 to $49,999225 $50,000 to $59,999378 $60,000 to $74,999330 $75,000 to $99,999489 $100,000 to $124,999198 $125,000 to $149,999277 $150,000 to $199,999271 $200,000 or moreEstimate of home value of owner-occupied houses/condos in 2022 in zip code 95953 23 Less than $10,0002 $30,000 to $34,99911 $40,000 to $49,99924 $50,000 to $59,9999 $70,000 to $79,9998 $80,000 to $89,99949 $100,000 to $124,99911 $125,000 to $149,999132 $150,000 to $174,99923 $175,000 to $199,999248 $200,000 to $249,999178 $250,000 to $299,999524 $300,000 to $399,999184 $400,000 to $499,999232 $500,000 to $749,99956 $750,000 to $999,99971 $1,000,000 to $1,499,99942 $2,000,000 or moreRent paid by renters in 2022 in zip code 95953 126 Less than $10049 $150 to $199139 $200 to $24916 $250 to $29943 $300 to $34917 $400 to $44944 $450 to $49955 $500 to $54938 $550 to $59984 $600 to $64922 $650 to $69931 $700 to $74949 $750 to $79923 $800 to $89930 $900 to $999190 $1,000 to $1,249177 $1,250 to $1,49954 $1,500 to $1,99987 No cash rent
Median gross rent in 2022: $825.
Median price asked for vacant for-sale houses and condos in 2022: $2,418,099.
Estimated median house (or condo) value in 2022 for: White Non-Hispanic householders: $352,256American Indian or Alaska Native householders: $204,899Asian householders: $374,806Some other race householders: $323,096Two or more races householders: $362,754Hispanic or Latino householders: $331,260Estimated median house or condo value in 2022: $349,535
95953:
$349,535California:
$715,900
Lower value quartile - upper value quartile: $256,178 - $463,547
Housing units in structures:
One, detached: 2,938One, attached: 113Two: 1403 or 4: 2045 to 9: 6420 to 49: 2150 or more: 34Mobile homes: 177Unemployment : 5.7%
Means of transportation to work in zip code 95953 72.2% 3,420 Drove a car alone13.0% 615 Carpooled3.5% 168 Walked2.0% 96 Other means8.2% 389 Worked at homeTravel time to work (commute) in zip code 95953 162 Less than 5 minutes346 5 to 9 minutes512 10 to 14 minutes851 15 to 19 minutes488 20 to 24 minutes327 25 to 29 minutes666 30 to 34 minutes33 35 to 39 minutes75 40 to 44 minutes288 45 to 59 minutes339 60 to 89 minutes156 90 or more minutes
Neighborhoods in zip code 95953: Percentage of zip code residents living and working in this county: 53.9%
Household type by relationship:
Households: 11,108
Male householders: 1,626 (342 living alone ), Female householders: 1,842 (290 living alone )1,691 spouses (1,691 opposite-sex spouses ), 181 unmarried partners , (169 opposite-sex unmarried partners ), 3,713 children (3,482 natural , 84 adopted , 146 stepchildren ), 346 grandchildren , 313 brothers or sisters , 338 parents , 28 foster children , 606 other relatives , 233 non-relatives In group quarters: 169 (-1 institutionalized population )
Size of family households: 860 2-persons , 519 3-persons , 633 4-persons , 256 5-persons , 239 6-persons , 192 7-or-more-persons
Size of nonfamily households: 630 1-person , 100 2-persons , 12 3-persons
1,279 married couples with children. single-parent households (390 men , 755 women ).
59.0% of residents of 95953 zip code speak English at home. of residents speak Spanish at home (52% very well, 12% well, 21% not well, 14% not at all ).of residents speak other Indo-European language at home (43% very well, 40% well, 13% not well, 4% not at all ).of residents speak Asian or Pacific Island language at home (79% very well, 21% well ).of residents speak other language at home (100% very well ).
Foreign born population: 2,822 (25.4%)
(51.1%
of them are naturalized citizens )
This zip code:
25.4%Whole state:
26.7%
60% Honduras 26% Bhutan 6% Nepal 2% Malaysia 1% El Salvador 1% Denmark 1% Singapore 6% German 4% English 4% American 3% Irish 3% Italian 1% European 1% Norwegian
Year of entry for the foreign-born population
561 2010 or later 969 2000 to 2009 631 1990 to 1999 837 Before 1990
Facilities with environmental interests located in this zip code:
ENCINAL ELEMENTARY (6484 LARKIN ROAD in LIVE OAK, CA)
(National Center for Education Statistics) - STATE ID-6053268 Organizations: LIVE OAK UNIFIED (SCHOOL DISTRICT)
LIVE OAK ALTERNATIVE (2207 PENNINGTON ROAD in LIVE OAK, CA)
(National Center for Education Statistics) - STATE ID-5130067 Organizations: LIVE OAK UNIFIED (SCHOOL DISTRICT)
LIVE OAK HIGH (2351 PENINGTON ROAD in LIVE OAK, CA)
(National Center for Education Statistics) - STATE ID-5135256 Organizations: LIVE OAK UNIFIED (SCHOOL DISTRICT)
LIVE OAK MIDDLE (2082 PENNINGTON ROAD in LIVE OAK, CA)
(National Center for Education Statistics) - STATE ID-6053276 Organizations: LIVE OAK UNIFIED (SCHOOL DISTRICT)
LUTHER ELEMENTARY (10123 CONNECTICUT AVE. in LIVE OAK, CA)
(National Center for Education Statistics) - STATE ID-6053284 Organizations: LIVE OAK UNIFIED (SCHOOL DISTRICT)
NUESTRO ELEMENTARY (3934 BROADWAY ROAD in LIVE OAK, CA)
(National Center for Education Statistics) - STATE ID-6053318
LIVE OAK GARAGE (9979 HWY 99 in LIVE OAK, CA)
Small Quantity Generators, between 100 kg and 1000 kg of hazardous waste/month (Resource Conservation and Recovery Act (tracking hazardous waste)) - notification Organizations: HARLAND BURCHFIELD (CONTACT/OWNER)
AGRICULTURAL ADVISORS, INC. (3995 E. BUTTE RD. in LIVE OAK, CA)
ENFORCEMENT/COMPLIANCE ACTIVITY (Integrated Compliance Information System)
Housing units lacking complete plumbing facilities: 0.6%
Housing units lacking complete kitchen facilities: 0.7%
59.5% Utility gas 27.8% Electricity 3.1% No fuel used 3.0% Solar energy 3.0% Wood 2.1% Bottled, tank, or LP gas 1.1% Other fuel 0.6% Fuel oil, kerosene, etc.
Population in 1990: 6,800. Population change in the 1990s: +1,886 (+27.7%).
Place of birth for U.S.-born residents:
This state: 7,241Northeast: 166Midwest: 336South: 223West: 152
61% of the 95953 zip code residents lived in the same house 5 years ago.
Out of people who lived in different houses, 54% lived in this county.
Out of people who lived in different counties, 50% lived in California.
90% of the 95953 zip code residents lived in the same house 1 year ago.
Out of people who lived in different houses, 55% moved from this county.
Out of people who lived in different houses, 39% moved from different county within same state.
Out of people who lived in different houses, 5% moved from different state.
Private vs. public school enrollment:
Students in private schools in grades 1 to 8 (elementary and middle school): 9
Here:
0.8%California:
10.5%
Students in private schools in grades 9 to 12 (high school): 40
Students in private undergraduate colleges: 94
Here:
19.5%California:
15.9%
Occupation by median earnings in the past 12 months ($)
191,476 Health diagnosing and treating practitioners and other technical occupations 115,845 Legal occupations 100,442 Computer and mathematical occupations 84,890 Law enforcement workers including supervisors 61,239 Management occupations 57,783 Construction and extraction occupations
Companies with federal contracts located in this zip code:
EARTHTONE TECHNOLOGIES (2510 ALLEN ST in LIVE OAK, CA; small business) in 2 contracts in 2005
$5,399 with Air Force for ADP Components. Signed on 2005-08-23. Completion date: 2005-08-31.
, same as above. Signed on 2005-09-18. Completion date: 2005-09-18.
Top industries in this zip code by the number of employees in 2005:
Health Care and Social Assistance: Nursing Care Facilities (100-249 employees: 1 establishment)Other Services (except Public Administration): Religious Organizations (20-49: 1, 1-4: 3)Accommodation and Food Services: Limited-Service Restaurants (10-19: 1, 5-9: 2, 1-4: 3)Health Care and Social Assistance: Child Day Care Services (10-19: 2, 1-4: 2)Administrative and Support and Waste Management and Remediation Services: Facilities Support Services (20-49: 1)Accommodation and Food Services: Full-Service Restaurants (10-19: 2)Arts, Entertainment, and Recreation: All Other Amusement and Recreation Industries (5-9: 3, 1-4: 1)
People in group quarters in 2010:
304 people in state prisons
94 people in nursing facilities/skilled-nursing facilities
17 people in workers' group living quarters and job corps centers
14 people in residential treatment centers for adults
8 people in group homes intended for adults
4 people in other noninstitutional facilities
People in group quarters in 2000:
198 people in federal prisons and detention centers
87 people in nursing homes
11 people in other nonhousehold living situations
8 people in other noninstitutional group quarters
5 people in agriculture workers' dormitories on farms
4 people in other types of correctional institutions
2 people in other group homes
Fatal accident statistics in 2014:
Fatal accident count: 2Vehicles involved in fatal accidents: 3Fatal accidents caused by drunken drivers: 0Fatalities: 2Persons involved in fatal accidents: 3Pedestrians involved in fatal accidents: 1
Fatal accident statistics in 2010:
Fatal accident count: 1Vehicles involved in fatal accidents: 2Fatal accidents caused by drunken drivers: 0Fatalities: 1Persons involved in fatal accidents: 4Pedestrians involved in fatal accidents: 0
Home Mortgage Disclosure Act Aggregated Statistics For Year 2009(Based on 2 full and 4 partial tracts) A) FHA, FSA/RHS & VA B) Conventional C) Refinancings D) Home Improvement Loans F) Non-occupant Loans on G) Loans On Manufactured Number Average Value Number Average Value Number Average Value Number Average Value Number Average Value Number Average Value
LOANS ORIGINATED 157 $154,330 96 $128,090 217 $194,732 13 $130,090 45 $86,325 4 $273,065 APPLICATIONS APPROVED, NOT ACCEPTED 12 $176,512 8 $131,259 20 $180,090 2 $216,340 1 $84,730 1 $66,730 APPLICATIONS DENIED 27 $154,370 43 $123,271 112 $187,964 6 $97,113 16 $92,751 3 $185,477 APPLICATIONS WITHDRAWN 16 $184,941 16 $93,773 71 $179,742 6 $136,072 21 $137,038 1 $20,990 FILES CLOSED FOR INCOMPLETENESS 2 $123,070 4 $120,668 10 $204,990 2 $33,655 0 $0 0 $0
Aggregated Statistics For Year 2008(Based on 2 full and 4 partial tracts) A) FHA, FSA/RHS & VA B) Conventional C) Refinancings D) Home Improvement Loans E) Loans on Dwellings For 5+ Families F) Non-occupant Loans on G) Loans On Manufactured Number Average Value Number Average Value Number Average Value Number Average Value Number Average Value Number Average Value Number Average Value
LOANS ORIGINATED 84 $178,703 158 $154,984 190 $189,652 21 $93,285 3 $810,383 49 $123,388 7 $89,146 APPLICATIONS APPROVED, NOT ACCEPTED 7 $203,236 25 $155,917 50 $190,161 6 $59,533 0 $0 14 $139,741 2 $79,105 APPLICATIONS DENIED 20 $186,174 47 $134,253 285 $184,806 51 $104,068 0 $0 21 $122,945 11 $108,422 APPLICATIONS WITHDRAWN 14 $158,173 51 $135,485 80 $208,561 10 $99,555 0 $0 20 $123,275 2 $92,190 FILES CLOSED FOR INCOMPLETENESS 0 $0 3 $186,257 24 $223,521 4 $218,742 0 $0 4 $179,320 0 $0
Aggregated Statistics For Year 2007(Based on 2 full and 4 partial tracts) A) FHA, FSA/RHS & VA B) Conventional C) Refinancings D) Home Improvement Loans F) Non-occupant Loans on G) Loans On Manufactured Number Average Value Number Average Value Number Average Value Number Average Value Number Average Value Number Average Value
LOANS ORIGINATED 23 $247,248 323 $194,513 442 $192,881 90 $76,553 64 $179,081 13 $76,112 APPLICATIONS APPROVED, NOT ACCEPTED 0 $0 76 $175,162 158 $206,491 14 $45,142 22 $111,105 6 $57,235 APPLICATIONS DENIED 10 $264,109 98 $232,219 451 $237,847 69 $139,903 38 $215,418 5 $193,670 APPLICATIONS WITHDRAWN 8 $225,471 79 $166,843 192 $196,705 15 $101,707 32 $146,303 1 $181,080 FILES CLOSED FOR INCOMPLETENESS 0 $0 11 $196,284 60 $296,102 2 $101,185 5 $248,504 0 $0
Aggregated Statistics For Year 2006(Based on 2 full and 4 partial tracts) A) FHA, FSA/RHS & VA B) Conventional C) Refinancings D) Home Improvement Loans E) Loans on Dwellings For 5+ Families F) Non-occupant Loans on G) Loans On Manufactured Number Average Value Number Average Value Number Average Value Number Average Value Number Average Value Number Average Value Number Average Value
LOANS ORIGINATED 8 $235,808 771 $194,077 760 $185,582 137 $104,134 0 $0 116 $185,747 14 $112,548 APPLICATIONS APPROVED, NOT ACCEPTED 0 $0 164 $191,500 202 $174,398 35 $98,055 0 $0 35 $181,004 4 $86,302 APPLICATIONS DENIED 0 $0 296 $193,810 508 $199,449 93 $94,068 2 $259,605 48 $181,972 14 $85,036 APPLICATIONS WITHDRAWN 1 $374,900 287 $187,679 396 $195,888 33 $130,128 0 $0 29 $188,303 1 $65,980 FILES CLOSED FOR INCOMPLETENESS 0 $0 22 $159,683 67 $244,658 7 $122,603 0 $0 7 $278,783 1 $59,980
Aggregated Statistics For Year 2005(Based on 2 full and 4 partial tracts) A) FHA, FSA/RHS & VA B) Conventional C) Refinancings D) Home Improvement Loans F) Non-occupant Loans on G) Loans On Manufactured Number Average Value Number Average Value Number Average Value Number Average Value Number Average Value Number Average Value
LOANS ORIGINATED 13 $290,521 933 $192,178 897 $182,729 172 $126,442 131 $171,445 17 $162,220 APPLICATIONS APPROVED, NOT ACCEPTED 0 $0 189 $195,612 166 $166,618 16 $89,609 25 $160,072 10 $140,248 APPLICATIONS DENIED 0 $0 291 $220,261 387 $183,051 100 $83,981 66 $184,776 19 $74,296 APPLICATIONS WITHDRAWN 1 $213,690 301 $215,682 361 $185,636 47 $162,163 25 $156,458 3 $142,243 FILES CLOSED FOR INCOMPLETENESS 0 $0 28 $218,643 111 $192,600 7 $140,189 4 $201,435 1 $44,990
Aggregated Statistics For Year 2004(Based on 2 full and 4 partial tracts) A) FHA, FSA/RHS & VA B) Conventional C) Refinancings D) Home Improvement Loans E) Loans on Dwellings For 5+ Families F) Non-occupant Loans on G) Loans On Manufactured Number Average Value Number Average Value Number Average Value Number Average Value Number Average Value Number Average Value Number Average Value
LOANS ORIGINATED 24 $174,826 462 $161,116 809 $143,016 137 $90,258 2 $778,815 107 $137,146 7 $88,091 APPLICATIONS APPROVED, NOT ACCEPTED 1 $183,480 96 $204,039 165 $138,661 18 $51,868 0 $0 10 $138,861 7 $77,210 APPLICATIONS DENIED 4 $168,608 135 $176,535 325 $128,546 55 $55,911 0 $0 45 $130,009 14 $126,706 APPLICATIONS WITHDRAWN 6 $139,818 162 $196,003 261 $149,876 37 $86,986 0 $0 15 $108,061 2 $546,130 FILES CLOSED FOR INCOMPLETENESS 1 $247,040 55 $218,049 94 $167,517 0 $0 0 $0 4 $175,082 0 $0
Aggregated Statistics For Year 2003(Based on 2 full and 4 partial tracts) A) FHA, FSA/RHS & VA B) Conventional C) Refinancings D) Home Improvement Loans E) Loans on Dwellings For 5+ Families F) Non-occupant Loans on Number Average Value Number Average Value Number Average Value Number Average Value Number Average Value Number Average Value
LOANS ORIGINATED 35 $145,696 329 $142,849 1,053 $126,188 50 $47,411 1 $2,249,400 71 $102,712 APPLICATIONS APPROVED, NOT ACCEPTED 2 $147,110 43 $165,388 209 $118,795 19 $26,232 0 $0 13 $137,093 APPLICATIONS DENIED 0 $0 83 $119,821 398 $114,252 55 $33,889 0 $0 21 $80,023 APPLICATIONS WITHDRAWN 0 $0 51 $166,212 288 $122,432 5 $48,748 0 $0 10 $87,095 FILES CLOSED FOR INCOMPLETENESS 0 $0 5 $138,802 44 $105,584 2 $43,265 0 $0 3 $97,277
Aggregated Statistics For Year 2002(Based on 2 full and 2 partial tracts) A) FHA, FSA/RHS & VA B) Conventional C) Refinancings D) Home Improvement Loans F) Non-occupant Loans on Number Average Value Number Average Value Number Average Value Number Average Value Number Average Value
LOANS ORIGINATED 50 $108,899 145 $118,123 528 $105,947 16 $41,787 51 $73,386 APPLICATIONS APPROVED, NOT ACCEPTED 4 $105,285 17 $149,462 78 $89,960 17 $35,479 5 $71,912 APPLICATIONS DENIED 3 $109,863 27 $80,467 207 $98,019 22 $25,992 13 $54,636 APPLICATIONS WITHDRAWN 2 $124,035 14 $94,950 111 $116,902 3 $25,113 0 $0 FILES CLOSED FOR INCOMPLETENESS 0 $0 2 $396,140 36 $95,144 0 $0 2 $40,385
Aggregated Statistics For Year 2001(Based on 2 full and 2 partial tracts) A) FHA, FSA/RHS & VA B) Conventional C) Refinancings D) Home Improvement Loans F) Non-occupant Loans on Number Average Value Number Average Value Number Average Value Number Average Value Number Average Value
LOANS ORIGINATED 79 $99,254 125 $140,303 303 $107,174 44 $24,515 39 $67,903 APPLICATIONS APPROVED, NOT ACCEPTED 6 $88,028 4 $60,260 45 $82,292 7 $43,421 1 $134,310 APPLICATIONS DENIED 0 $0 19 $134,300 183 $73,400 25 $20,603 4 $160,162 APPLICATIONS WITHDRAWN 8 $88,272 11 $103,613 85 $118,910 11 $33,947 2 $95,190 FILES CLOSED FOR INCOMPLETENESS 0 $0 4 $104,802 33 $85,640 0 $0 0 $0
Aggregated Statistics For Year 2000(Based on 2 full and 2 partial tracts) A) FHA, FSA/RHS & VA B) Conventional C) Refinancings D) Home Improvement Loans F) Non-occupant Loans on Number Average Value Number Average Value Number Average Value Number Average Value Number Average Value
LOANS ORIGINATED 59 $84,502 142 $98,798 125 $74,357 40 $27,298 29 $82,890 APPLICATIONS APPROVED, NOT ACCEPTED 4 $87,015 25 $60,758 57 $92,511 26 $28,114 2 $39,420 APPLICATIONS DENIED 12 $89,752 44 $63,077 124 $86,096 40 $37,582 11 $45,086 APPLICATIONS WITHDRAWN 9 $87,663 17 $103,965 64 $74,182 4 $5,288 9 $59,911 FILES CLOSED FOR INCOMPLETENESS 0 $0 2 $340,575 36 $69,659 2 $9,615 1 $81,550
Aggregated Statistics For Year 1999(Based on 1 full and 2 partial tracts) A) FHA, FSA/RHS & VA B) Conventional C) Refinancings D) Home Improvement Loans E) Loans on Dwellings For 5+ Families F) Non-occupant Loans on Number Average Value Number Average Value Number Average Value Number Average Value Number Average Value Number Average Value
LOANS ORIGINATED 21 $92,521 67 $97,470 139 $87,737 26 $29,427 2 $72,950 19 $69,291 APPLICATIONS APPROVED, NOT ACCEPTED 1 $65,410 6 $108,928 30 $82,566 15 $17,951 0 $0 1 $123,700 APPLICATIONS DENIED 3 $123,847 13 $105,970 103 $93,042 15 $23,493 0 $0 5 $64,282 APPLICATIONS WITHDRAWN 2 $84,660 9 $145,134 57 $87,048 4 $16,258 0 $0 6 $78,858 FILES CLOSED FOR INCOMPLETENESS 1 $102,700 4 $142,690 20 $94,174 1 $24,000 0 $0 1 $102,700
Detailed HMDA statistics for the following Tracts:
0506.03
,
0507.00 ,
0508.00
Private Mortgage Insurance Companies Aggregated Statistics For Year 2009(Based on 2 full and 4 partial tracts) A) Conventional B) Refinancings Number Average Value Number Average Value
LOANS ORIGINATED 10 $187,288 4 $200,548 APPLICATIONS APPROVED, NOT ACCEPTED 4 $172,108 3 $349,657 APPLICATIONS DENIED 3 $130,873 1 $249,430 APPLICATIONS WITHDRAWN 0 $0 0 $0 FILES CLOSED FOR INCOMPLETENESS 0 $0 0 $0
Aggregated Statistics For Year 2007(Based on 2 full and 4 partial tracts) A) Conventional B) Refinancings C) Non-occupant Loans on Number Average Value Number Average Value Number Average Value
LOANS ORIGINATED 62 $253,871 41 $234,380 4 $173,550 APPLICATIONS APPROVED, NOT ACCEPTED 12 $295,982 5 $241,784 0 $0 APPLICATIONS DENIED 0 $0 6 $295,583 0 $0 APPLICATIONS WITHDRAWN 2 $247,675 0 $0 0 $0 FILES CLOSED FOR INCOMPLETENESS 0 $0 0 $0 0 $0
Aggregated Statistics For Year 2006(Based on 2 full and 4 partial tracts) A) Conventional B) Refinancings C) Non-occupant Loans on Number Average Value Number Average Value Number Average Value
LOANS ORIGINATED 28 $313,730 22 $259,640 2 $332,680 APPLICATIONS APPROVED, NOT ACCEPTED 9 $343,139 8 $245,464 0 $0 APPLICATIONS DENIED 1 $333,380 0 $0 0 $0 APPLICATIONS WITHDRAWN 1 $333,380 0 $0 0 $0 FILES CLOSED FOR INCOMPLETENESS 0 $0 0 $0 0 $0
Aggregated Statistics For Year 2005(Based on 2 full and 4 partial tracts) A) Conventional B) Refinancings C) Non-occupant Loans on Number Average Value Number Average Value Number Average Value
LOANS ORIGINATED 26 $237,070 23 $214,756 6 $151,277 APPLICATIONS APPROVED, NOT ACCEPTED 3 $282,390 6 $194,097 0 $0 APPLICATIONS DENIED 0 $0 0 $0 0 $0 APPLICATIONS WITHDRAWN 0 $0 2 $185,570 0 $0 FILES CLOSED FOR INCOMPLETENESS 0 $0 0 $0 0 $0
Aggregated Statistics For Year 2004(Based on 2 full and 4 partial tracts) A) Conventional B) Refinancings C) Non-occupant Loans on Number Average Value Number Average Value Number Average Value
LOANS ORIGINATED 46 $180,145 33 $160,766 11 $127,815 APPLICATIONS APPROVED, NOT ACCEPTED 16 $153,364 7 $151,581 7 $116,177 APPLICATIONS DENIED 0 $0 0 $0 0 $0 APPLICATIONS WITHDRAWN 3 $382,863 3 $262,693 0 $0 FILES CLOSED FOR INCOMPLETENESS 0 $0 0 $0 0 $0
Aggregated Statistics For Year 2003(Based on 2 full and 4 partial tracts) A) Conventional B) Refinancings C) Non-occupant Loans on Number Average Value Number Average Value Number Average Value
LOANS ORIGINATED 97 $157,994 54 $154,323 18 $120,521 APPLICATIONS APPROVED, NOT ACCEPTED 16 $240,461 12 $129,684 3 $117,370 APPLICATIONS DENIED 5 $140,464 1 $194,270 3 $157,827 APPLICATIONS WITHDRAWN 2 $384,600 0 $0 0 $0 FILES CLOSED FOR INCOMPLETENESS 0 $0 0 $0 0 $0
Aggregated Statistics For Year 2002(Based on 2 full and 2 partial tracts) A) Conventional B) Refinancings C) Non-occupant Loans on Number Average Value Number Average Value Number Average Value
LOANS ORIGINATED 47 $118,754 45 $140,205 3 $50,340 APPLICATIONS APPROVED, NOT ACCEPTED 7 $125,670 7 $123,696 2 $60,575 APPLICATIONS DENIED 2 $104,805 2 $129,805 0 $0 APPLICATIONS WITHDRAWN 4 $187,075 2 $85,575 0 $0 FILES CLOSED FOR INCOMPLETENESS 2 $97,110 0 $0 0 $0
Aggregated Statistics For Year 2001(Based on 2 full and 2 partial tracts) A) Conventional B) Refinancings C) Non-occupant Loans on Number Average Value Number Average Value Number Average Value
LOANS ORIGINATED 64 $137,226 35 $113,707 2 $89,340 APPLICATIONS APPROVED, NOT ACCEPTED 10 $93,020 6 $130,007 0 $0 APPLICATIONS DENIED 0 $0 1 $167,890 0 $0 APPLICATIONS WITHDRAWN 0 $0 2 $80,765 0 $0 FILES CLOSED FOR INCOMPLETENESS 1 $149,900 0 $0 0 $0
Aggregated Statistics For Year 2000(Based on 2 full and 2 partial tracts) A) Conventional B) Refinancings C) Non-occupant Loans on Number Average Value Number Average Value Number Average Value
LOANS ORIGINATED 66 $108,212 13 $104,408 9 $60,492 APPLICATIONS APPROVED, NOT ACCEPTED 8 $60,815 0 $0 4 $39,422 APPLICATIONS DENIED 2 $41,345 2 $134,610 0 $0 APPLICATIONS WITHDRAWN 0 $0 2 $90,380 0 $0 FILES CLOSED FOR INCOMPLETENESS 1 $289,010 0 $0 0 $0
Aggregated Statistics For Year 1999(Based on 1 full and 2 partial tracts) A) Conventional B) Refinancings C) Non-occupant Loans on Number Average Value Number Average Value Number Average Value
LOANS ORIGINATED 26 $107,704 15 $121,848 2 $70,365 APPLICATIONS APPROVED, NOT ACCEPTED 1 $61,360 3 $120,647 1 $47,550 APPLICATIONS DENIED 1 $111,060 2 $133,125 0 $0 APPLICATIONS WITHDRAWN 0 $0 1 $94,140 0 $0 FILES CLOSED FOR INCOMPLETENESS 0 $0 0 $0 0 $0
Detailed PMIC statistics for the following Tracts:
0506.03
,
0507.00 ,
0508.00
2003 - 2018 National Fire Incident Reporting System (NFIRS) incidents See full 2006 National Fire Incident Reporting System statistics for zip code 95953, California
Most common first names in zip code 95953 among deceased individuals Name Count Lived (average)
John 37 77.4 years James 35 69.3 years Robert 32 73.4 years William 31 79.3 years George 28 76.7 years Mary 26 79.9 years Charles 25 71.9 years Joseph 15 73.5 years Frank 15 80.4 years Richard 14 74.1 years
Most common last names in zip code 95953 among deceased individuals Last name Count Lived (average)
Smith 28 76.0 years Johnson 18 71.2 years Williams 16 72.5 years Jones 14 73.6 years Wilson 13 73.2 years Singh 12 75.5 years Clark 10 81.1 years Khan 10 69.8 years Davis 9 76.1 years Moore 8 80.9 years
Businesses in zip code 95953
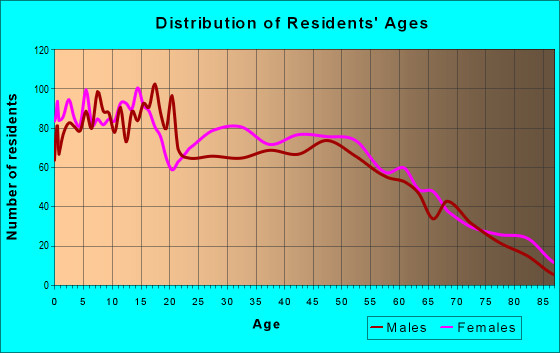


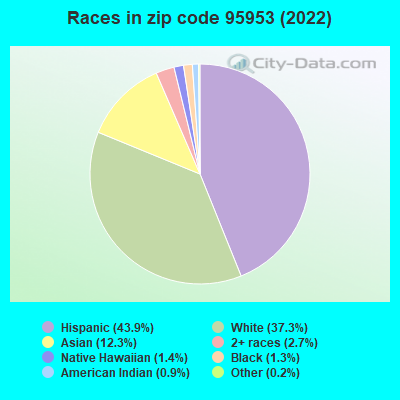


 Nearest zip codes: 95948, 95982, 95917, 95993, 95932, 95957.
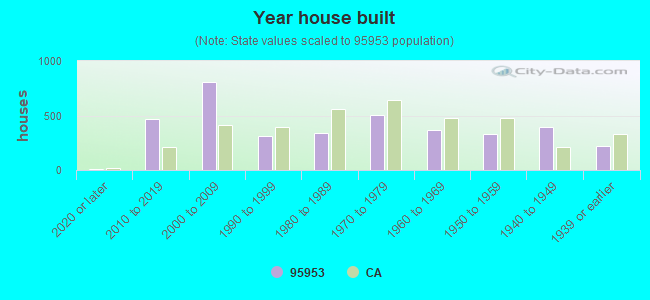
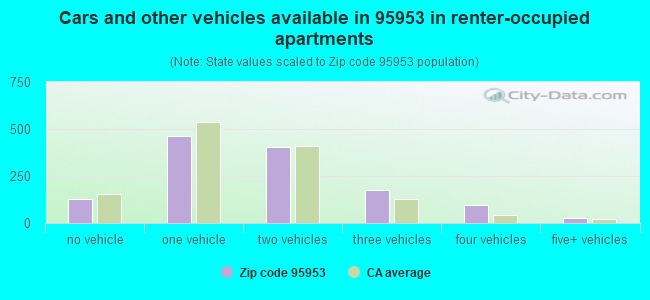


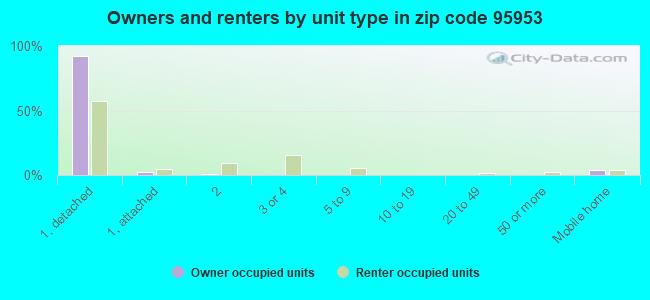
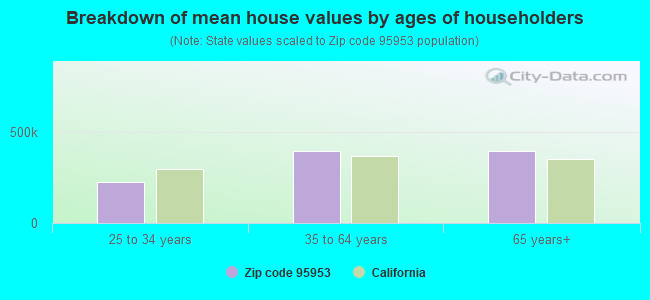


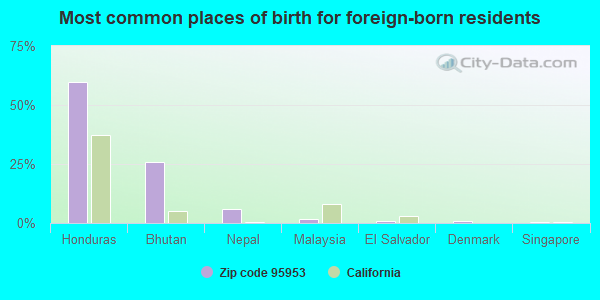
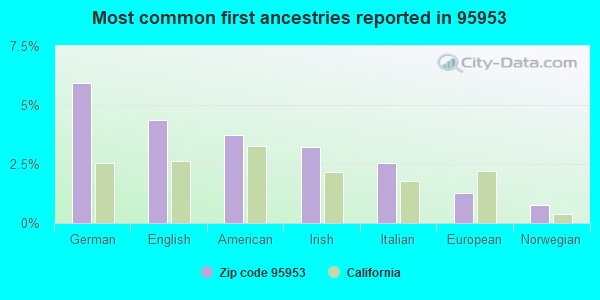
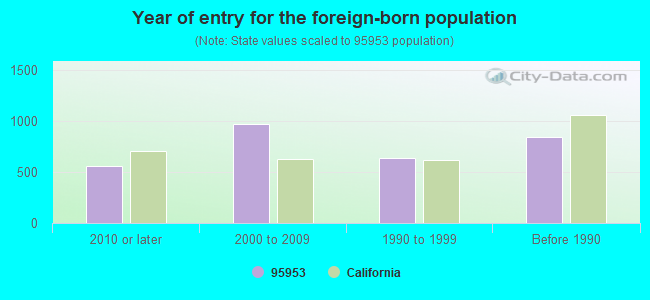
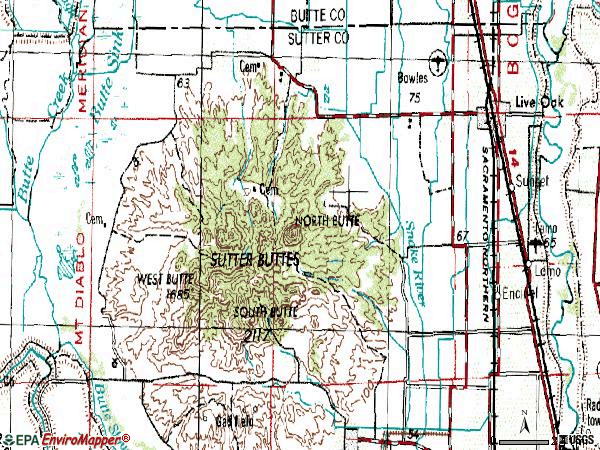

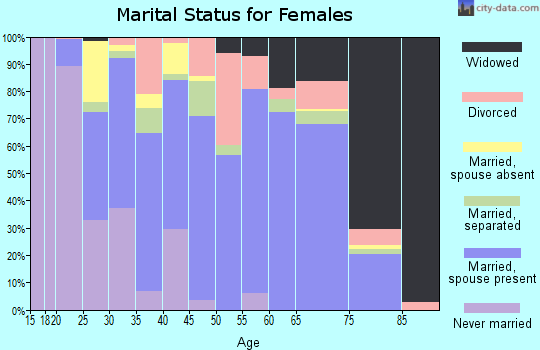
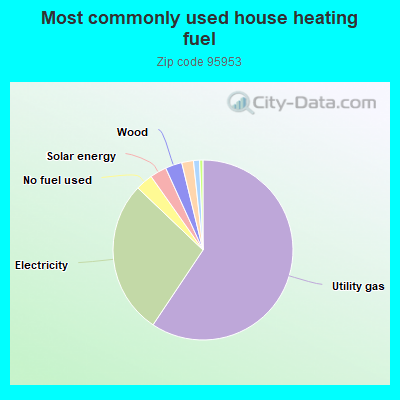
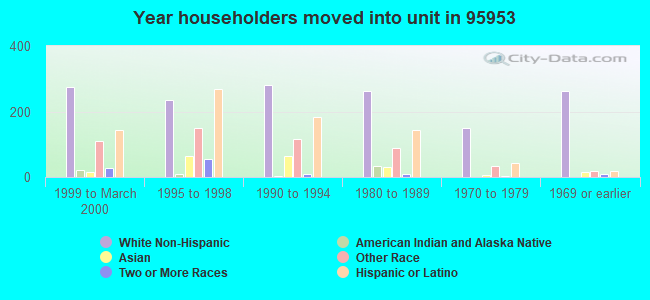
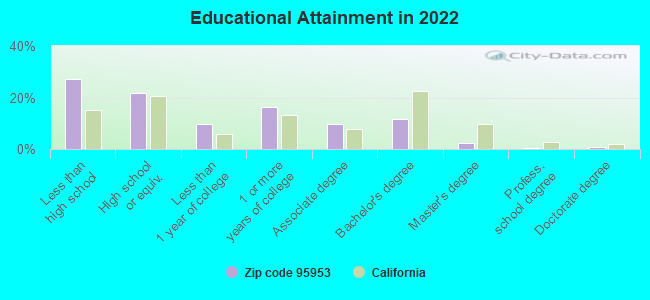

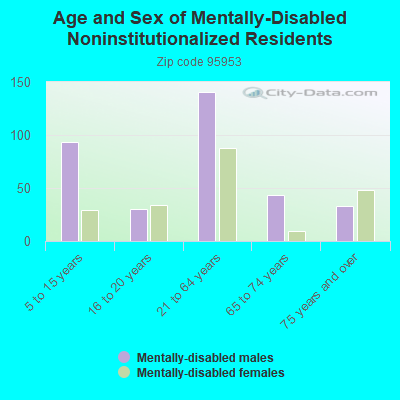
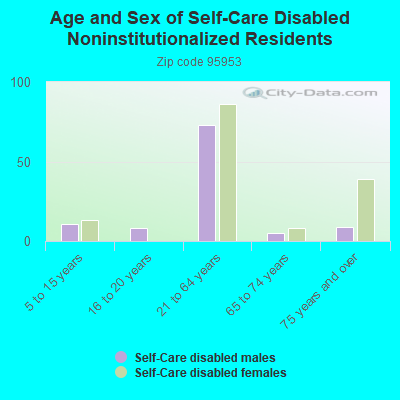
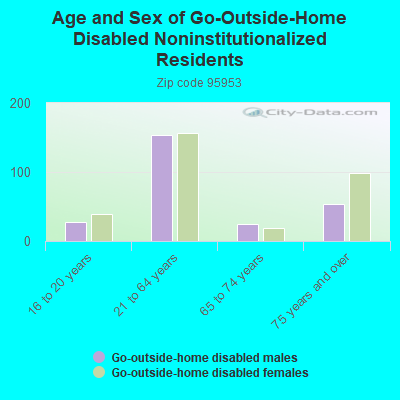
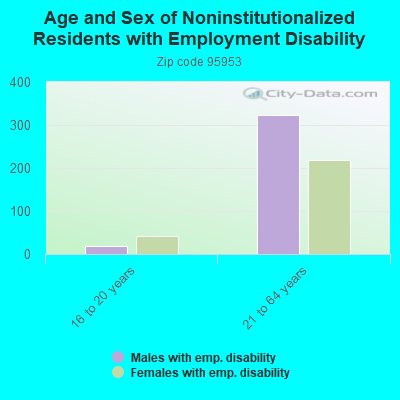
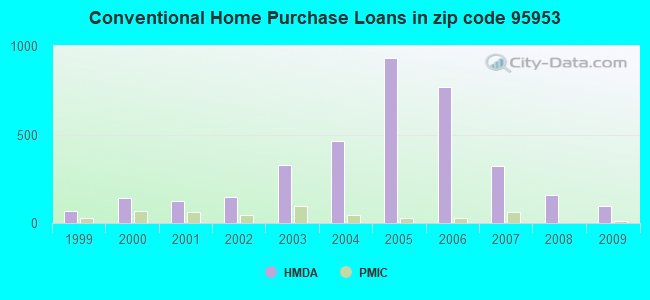
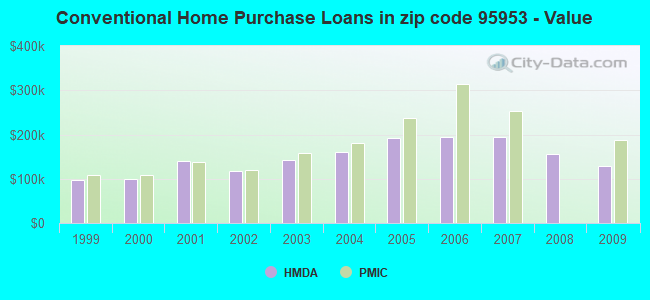
 Based on the data from the years 2003 - 2018 the average number of fires per year is 49. The highest number of fires - 117 took place in 2005, and the least - 0 in 2004. The data has an increasing trend.
 When looking into fire subcategories, the most reports belonged to: Outside Fires (66.2%), and Structure Fires (20.2%).