Estimated zip code population in 2022: 3,058 Zip code population in 2010: 3,221 Zip code population in 2000: 3,176
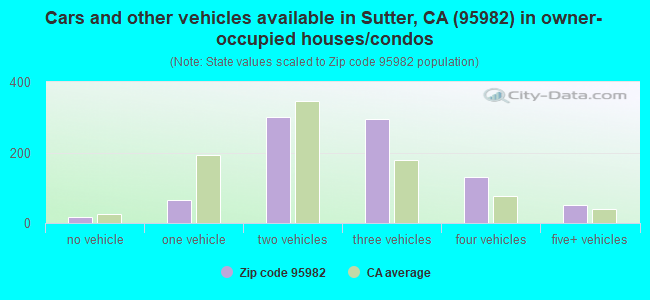
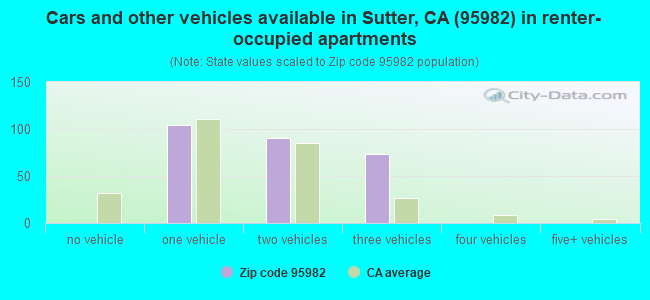
Houses and condos: 1,179 Renter-occupied apartments: 266
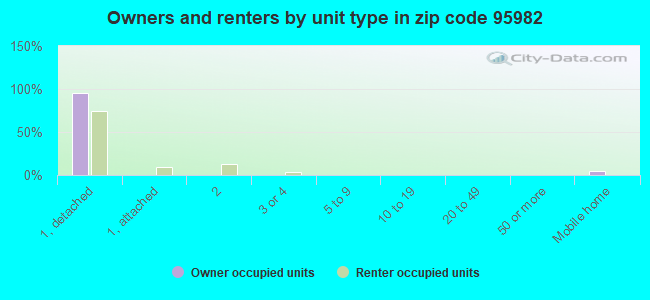
% of renters here:
24%
State:
44%
March 2022 cost of living index in zip code 95982: 94.5 (less than average, U.S. average is 100)
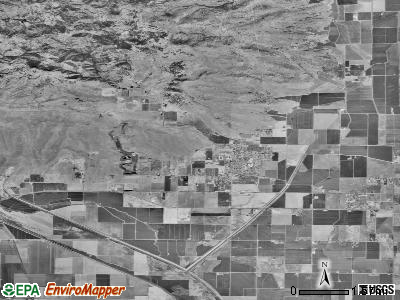
Land area: 44.4 sq. mi. Water area: 0.1 sq. mi.
Population density: 69 people per square mile
(very low).
OSM Map
General Map
Google Map
MSN Map
OSM Map
General Map
Google Map
MSN Map
OSM Map
General Map
Google Map
MSN Map
OSM Map
General Map
Google Map
MSN Map
Please wait while loading the map...
Real estate property taxes paid for housing units in 2022:
This zip code:
0.6% ($2,378)
California:
0.7% ($4,831)
Median real estate property taxes paid for housing units with mortgages in 2022: $2,477 (0.7%) Median real estate property taxes paid for housing units with no mortgage in 2022: $2,111 (0.5%)
Averages for the 2020 tax year for zip code 95982, filed in 2021:
Average Adjusted Gross Income (AGI) in 2020: $81,035 (Individual Income Tax Returns)
Here:
$81,035
State:
$95,910
Salary/wage: $64,601 (reported on 81.7% of returns)
Here:
$64,601
State:
$77,331
(% of AGI for various income ranges: 1250.4% for AGIs below $25k, 3578.1% for AGIs $25k-50k, 6736.5% for AGIs $50k-75k, 10209.2% for AGIs $75k-100k, 19988.8% for AGIs $100k-200k, 63185.0% for AGIs over 200k)
Taxable interest for individuals: $628 (reported on 41.8% of returns)
This zip code:
$628
California:
$2,294
(% of AGI for various income ranges: 17.2% for AGIs below $25k, 20.4% for AGIs $25k-50k, 29.4% for AGIs $50k-75k, 23.3% for AGIs $75k-100k, 84.4% for AGIs $100k-200k, 465.0% for AGIs over 200k)
Ordinary dividends: $3,479 (reported on 15.7% of returns)
Here:
$3,479
State:
$10,949
(% of AGI for various income ranges: 16.4% for AGIs below $25k, 37.7% for AGIs $25k-50k, 32.4% for AGIs $50k-75k, 40.8% for AGIs $75k-100k, 184.4% for AGIs $100k-200k, 1485.0% for AGIs over 200k)
Net capital gain/loss in AGI: +$12,478 (reported on 15.0% of returns)
Here:
+$12,478
State:
+$49,306
(% of AGI for various income ranges: 26.0% for AGIs below $25k, 18.5% for AGIs $25k-50k, 3.5% for AGIs $50k-75k, 190.8% for AGIs $75k-100k, 323.8% for AGIs $100k-200k, 10020.0% for AGIs over 200k)
Profit/loss from business: +$8,513 (reported on 15.0% of returns)
Here:
+$8,513
State:
+$15,671
(% of AGI for various income ranges: 140.0% for AGIs below $25k, 95.0% for AGIs $25k-50k, 371.8% for AGIs $50k-75k, 12.5% for AGIs $75k-100k, 446.3% for AGIs $100k-200k)
Taxable individual retirement arrangement distribution: $9,933 (reported on 5.9% of returns)
95982:
$9,933
California:
$23,505
(% of AGI for various income ranges: 93.2% for AGIs below $25k, 154.7% for AGIs $50k-75k, 248.7% for AGIs $100k-200k)
Total itemized deductions: $29,983 (reported on 11.8% of returns)
Here:
$29,983
State:
$39,517
(% of AGI for various income ranges: 504.7% for AGIs $50k-75k, 474.2% for AGIs $75k-100k, 1380.0% for AGIs $100k-200k, 8810.0% for AGIs over 200k)
Charity contributions: $5,257 (reported on 9.2% of returns)
Here:
$5,257
State:
$12,598
(% of AGI for various income ranges: 59.4% for AGIs $50k-75k, 205.0% for AGIs $100k-200k, 1535.0% for AGIs over 200k)
Taxes paid: $7,967 (reported on 11.8% of returns)
95982:
$7,967
State:
$8,807
(% of AGI for various income ranges: 105.9% for AGIs $50k-75k, 165.8% for AGIs $75k-100k, 443.1% for AGIs $100k-200k, 1730.0% for AGIs over 200k)
Earned income credit: $2,058 (reported on 12.4% of returns)
Here:
$2,058
State:
$2,074
(% of AGI for various income ranges: 92.0% for AGIs below $25k, 61.9% for AGIs $25k-50k)
Percentage of individuals using paid preparers for their 2020 taxes: 95.4%
Here:
95%
State:
92%
(% for various income ranges: 95.0% for AGIs below $25k, 94.1% for AGIs $25k-50k, 95.8% for AGIs $50k-75k, 100.0% for AGIs $75k-100k, 96.7% for AGIs $100k-200k, 87.5% for AGIs over 200k)
Averages for the 2012 tax year for zip code 95982, filed in 2013:
Average Adjusted Gross Income (AGI) in 2012: $53,292 (Individual Income Tax Returns)
Here:
$53,292
State:
$72,726
Salary/wage: $46,856 (reported on 83.2% of returns)
Here:
$46,856
State:
$59,079
(% of AGI for various income ranges: 73.0% for AGIs below $25k, 77.8% for AGIs $25k-50k, 78.4% for AGIs $50k-75k, 82.7% for AGIs $75k-100k, 77.5% for AGIs $100k-200k, 42.2% for AGIs over 200k)
Taxable interest for individuals: $959 (reported on 40.6% of returns)
This zip code:
$959
California:
$2,146
(% of AGI for various income ranges: 0.7% for AGIs below $25k, 0.6% for AGIs $25k-50k, 0.6% for AGIs $50k-75k, 0.3% for AGIs $75k-100k, 0.4% for AGIs $100k-200k, 2.2% for AGIs over 200k)
Ordinary dividends: $2,638 (reported on 14.7% of returns)
Here:
$2,638
State:
$9,308
(% of AGI for various income ranges: 1.5% for AGIs below $25k, 0.4% for AGIs $25k-50k, 0.7% for AGIs $50k-75k, 0.3% for AGIs $75k-100k, 0.4% for AGIs $100k-200k, 1.8% for AGIs over 200k)
Net capital gain/loss in AGI: +$2,927 (reported on 10.5% of returns)
Here:
+$2,927
State:
+$30,460
(% of AGI for various income ranges: 2.2% for AGIs $100k-200k)
Profit/loss from business: +$8,458 (reported on 16.8% of returns)
Here:
+$8,458
State:
+$17,064
(% of AGI for various income ranges: 4.0% for AGIs below $25k, 3.6% for AGIs $25k-50k, 0.4% for AGIs $50k-75k, 2.8% for AGIs $75k-100k, 4.4% for AGIs $100k-200k)
Taxable individual retirement arrangement distribution: $15,700 (reported on 6.3% of returns)
95982:
$15,700
California:
$19,557
(% of AGI for various income ranges: 4.7% for AGIs below $25k, 3.1% for AGIs $50k-75k, 3.2% for AGIs $100k-200k)
Total itemized deductions: $23,917 (26% of AGI, reported on 36.4% of returns)
Here:
$23,917
State:
$34,004
Here:
25.5% of AGI
State:
22.7% of AGI
(% of AGI for various income ranges: 13.9% for AGIs below $25k, 12.1% for AGIs $25k-50k, 14.7% for AGIs $50k-75k, 16.1% for AGIs $75k-100k, 19.7% for AGIs $100k-200k, 18.6% for AGIs over 200k)
Charity contributions: $2,932 (reported on 28.7% of returns)
Here:
$2,932
State:
$4,659
(% of AGI for various income ranges: 0.7% for AGIs below $25k, 0.9% for AGIs $25k-50k, 1.3% for AGIs $50k-75k, 1.5% for AGIs $75k-100k, 2.2% for AGIs $100k-200k, 2.1% for AGIs over 200k)
Taxes paid: $8,551 (reported on 35.7% of returns)
95982:
$8,551
State:
$14,448
(% of AGI for various income ranges: 1.6% for AGIs below $25k, 2.5% for AGIs $25k-50k, 4.2% for AGIs $50k-75k, 5.0% for AGIs $75k-100k, 7.3% for AGIs $100k-200k, 11.7% for AGIs over 200k)
Earned income credit: $2,138 (reported on 16.8% of returns)
Here:
$2,138
State:
$2,286
(% of AGI for various income ranges: 5.5% for AGIs below $25k, 1.1% for AGIs $25k-50k)
Percentage of individuals using paid preparers for their 2012 taxes: 62.2%
Here:
62%
State:
64%
(% for various income ranges: 53.7% for AGIs below $25k, 64.7% for AGIs $25k-50k, 60.9% for AGIs $50k-75k, 76.9% for AGIs $75k-100k, 75.0% for AGIs $100k-200k, 66.7% for AGIs over 200k)
Averages for the 2004 tax year for zip code 95982, filed in 2005:
Average Adjusted Gross Income (AGI) in 2004: $45,042 (Individual Income Tax Returns)
Here:
$45,042
State:
$58,600
Salary/wage: $40,379 (reported on 83.4% of returns)
Here:
$40,379
State:
$49,455
(% of AGI for various income ranges: 122.4% for AGIs below $10k, 68.7% for AGIs $10k-25k, 80.1% for AGIs $25k-50k, 80.7% for AGIs $50k-75k, 87.4% for AGIs $75k-100k, 59.4% for AGIs over 100k)
Taxable interest for individuals: $1,439 (reported on 44.6% of returns)
This zip code:
$1,439
California:
$2,365
(% of AGI for various income ranges: 7.0% for AGIs below $10k, 1.2% for AGIs $10k-25k, 1.4% for AGIs $25k-50k, 1.4% for AGIs $50k-75k, 0.2% for AGIs $75k-100k, 2.0% for AGIs over 100k)
Taxable dividends: $2,017 (reported on 17.1% of returns)
Here:
$2,017
State:
$4,746
(% of AGI for various income ranges: 2.2% for AGIs below $10k, 0.8% for AGIs $10k-25k, 0.8% for AGIs $25k-50k, 0.4% for AGIs $50k-75k, 0.3% for AGIs $75k-100k, 1.1% for AGIs over 100k)
Net capital gain/loss: +$11,524 (reported on 13.6% of returns)
Here:
+$11,524
State:
+$23,418
(% of AGI for various income ranges: -2.9% for AGIs below $10k, 0.1% for AGIs $10k-25k, 0.5% for AGIs $25k-50k, 1.5% for AGIs $50k-75k, 0.1% for AGIs $75k-100k, 10.1% for AGIs over 100k)
Profit/loss from business: +$13,600 (reported on 17.4% of returns)
Here:
+$13,600
State:
+$16,826
(% of AGI for various income ranges: 6.8% for AGIs below $10k, 10.5% for AGIs $10k-25k, 5.1% for AGIs $25k-50k, 4.3% for AGIs $50k-75k, 1.9% for AGIs $75k-100k, 6.3% for AGIs over 100k)
IRA payment deduction: $2,795 (reported on 2.8% of returns)
95982:
$2,795
California:
$3,192
Total itemized deductions: $19,718 (26% of AGI, reported on 40.4% of returns)
Here:
$19,718
State:
$28,113
Here:
25.9% of AGI
State:
25.3% of AGI
(% of AGI for various income ranges: 13.1% for AGIs $10k-25k, 17.4% for AGIs $25k-50k, 17.4% for AGIs $50k-75k, 23.5% for AGIs $75k-100k, 17.2% for AGIs over 100k)
Charity contributions deductions: $2,877 (4% of AGI, reported on 34.8% of returns)
Here:
$2,877
State:
$3,923
Here:
3.6% of AGI
State:
3.3% of AGI
(% of AGI for various income ranges: 1.5% for AGIs $10k-25k, 1.8% for AGIs $25k-50k, 1.8% for AGIs $50k-75k, 3.1% for AGIs $75k-100k, 2.7% for AGIs over 100k)
Total tax: $5,951 (reported on 75.5% of returns)
95982:
$5,951
State:
$10,761
(% of AGI for various income ranges: 3.8% for AGIs below $10k, 4.5% for AGIs $10k-25k, 6.0% for AGIs $25k-50k, 7.9% for AGIs $50k-75k, 8.3% for AGIs $75k-100k, 17.1% for AGIs over 100k)
Earned income credit: $1,720 (reported on 16.8% of returns)
Here:
$1,720
State:
$1,763
Percentage of individuals using paid preparers for their 2004 taxes: 64.7%
Here:
65%
State:
66%
(% for various income ranges: 59.4% for AGIs below $10k, 61.1% for AGIs $10k-25k, 60.1% for AGIs $25k-50k, 70.6% for AGIs $50k-75k, 69.6% for AGIs $75k-100k, 85.5% for AGIs over 100k)
Household received Food Stamps/SNAP in the past 12 months: 62 Household did not receive Food Stamps/SNAP in the past 12 months: 1,051
Women who had a birth in the past 12 months: 19 (6 now married, 13 unmarried) Women who did not have a birth in the past 12 months: 758 (347 now married, 409 unmarried)
Housing units in zip code 95982 with a mortgage: 593 (32 second mortgage, 34 both second mortgage and home equity loan) Median monthly owner costs for units with a mortgage: $1,754 Median monthly owner costs for units without a mortgage: $604
Residents with income below the poverty level in 2022:
This zip code:
4.8%
Whole state:
12.2%
Residents with income below 50% of the poverty level in 2022:
This zip code:
2.4%
Whole state:
6.2%
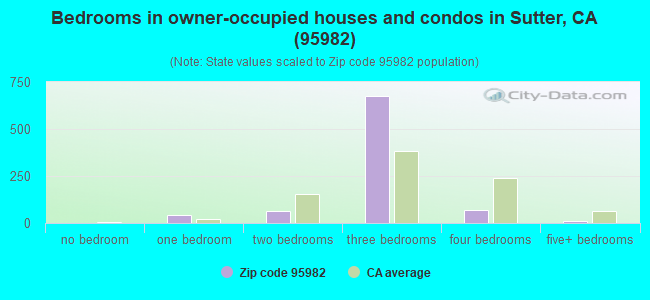
Median number of rooms in houses and condos:
Here:
5.5
State:
6.0
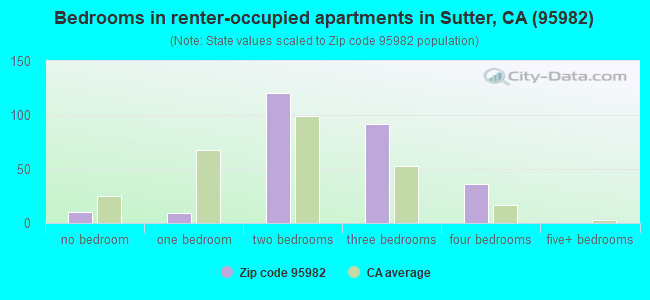
Median number of rooms in apartments:
Here:
5.1
State:
3.9
Notable locations in this zip code not listed on our city pages
Notable locations in zip code 95982: Sutter Branch Sutter County Free Library (A), Sutter County Fire Department (B). Display/hide their locations on the map
Churches in zip code 95982 include: Sutter United Methodist Church (A), Sutter Church of Christ (B), Sutter Baptist Church (C), Sutter Assembly of God Church (D). Display/hide their locations on the map
In group quarters: 12 (-1 institutionalized population)
Size of family households: 363 2-persons, 200 3-persons, 195 4-persons, 109 5-persons, 28 6-persons
Size of nonfamily households: 198 1-person, 31 2-persons
420 married couples with children.
161 single-parent households (66 men, 95 women).
93.0% of residents of 95982 zip code speak English at home.
4.4% of residents speak Spanish at home (59% very well, 25% well, 16% not at all).
0.3% of residents speak other Indo-European language at home (100% well).
1.4% of residents speak Asian or Pacific Island language at home (45% well, 55% not well).
0.2% of residents speak other language at home (100% very well).
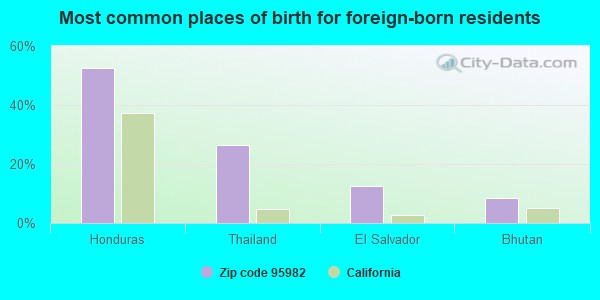
Foreign born population: 95 (3.1%) (53.6% of them are naturalized citizens)
This zip code:
3.1%
Whole state:
26.7%
53%Honduras
26%Thailand
13%El Salvador
8%Bhutan
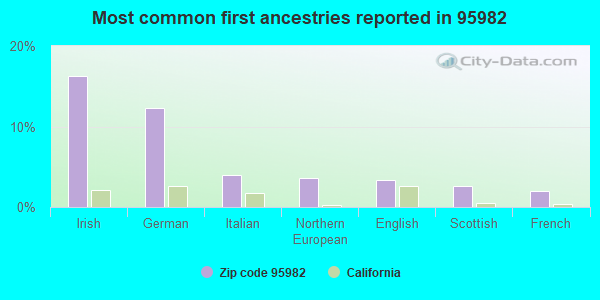
16%Irish
12%German
4%Italian
4%Northern European
3%English
3%Scottish
2%French
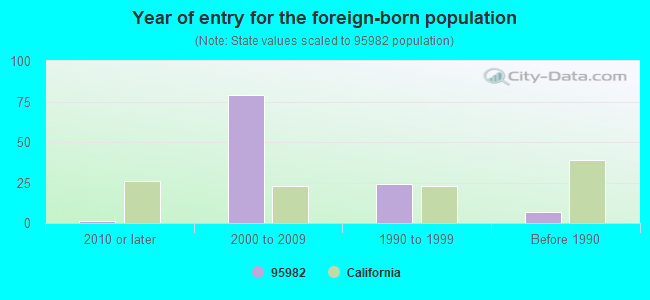
Year of entry for the foreign-born population
12010 or later
792000 to 2009
241990 to 1999
7Before 1990
Facilities with environmental interests located in this zip code:
MERVIN G CLARK CONSTRUCTION (1770 THIRD STREEYT in SUTTER, CA)
TRANSPORTER (Resource Conservation and Recovery Act (tracking hazardous waste)) Organizations: CLARK MERVIN G (CONTACT/OWNER)
CALIFORNIA STATE OF DEPT OF WATER RES (6908 COLUSA HWY in SUTTER, CA)
Small Quantity Generators, between 100 kg and 1000 kg of hazardous waste/month (Resource Conservation and Recovery Act (tracking hazardous waste)) - notification
ANACAPA OIL 2001 (KELLOGG #2 in SUTTER, CA)
CRITERIA AND HAZARDOUS AIR POLLUTANT INVENTORY (Inventory of air pollution sources) Business SIC classification: CRUDE PETROLEUM AND NATURAL GAS Alternative names: SIERRA RESOURCES, INC
ANACAPA OIL 2003 (FRYE #5 in SUTTER, CA)
CRITERIA AND HAZARDOUS AIR POLLUTANT INVENTORY (Inventory of air pollution sources) Business SIC classification: CRUDE PETROLEUM AND NATURAL GAS Alternative names: SIERRA RESOURCES INC
HI & DRI WAREHOUSE (1551 ACACIA AVENUE in SUTTER, CA)
CRITERIA AND HAZARDOUS AIR POLLUTANT INVENTORY (Inventory of air pollution sources) Alternative names: HI AND DRY WHS
NORTH VALLEY GIN (9450 AGRI PARK RD in SUTTER, CA)
CRITERIA AND HAZARDOUS AIR POLLUTANT INVENTORY (Inventory of air pollution sources)
C T & MICHAEL JOSEPH DRILLING (8867 S. BUTTE RD in SUTTER, CA)
CRITERIA AND HAZARDOUS AIR POLLUTANT INVENTORY (Inventory of air pollution sources) Business SIC classification: REFUSE SYSTEMS Business NAICS classification: SOLID WASTE LANDFILL.
CALPINE NG CO (LEWIS 232 in SUTTER, CA)
CRITERIA AND HAZARDOUS AIR POLLUTANT INVENTORY (Inventory of air pollution sources) Business SIC classification: CRUDE PETROLEUM AND NATURAL GAS
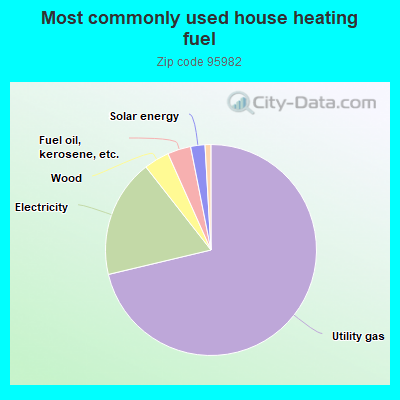
71.5%Utility gas
18.2%Electricity
3.9%Wood
3.6%Fuel oil, kerosene, etc.
2.2%Solar energy
0.9%Bottled, tank, or LP gas
Population in 1990: 3,090. Population change in the 1990s: +86 (+2.8%).
Place of birth for U.S.-born residents:
This state: 2,341
Northeast: 44
Midwest: 243
South: 94
West: 206
65% of the 95982 zip code residents lived in the same house 5 years ago. Out of people who lived in different houses, 75% lived in this county. Out of people who lived in different counties, 50% lived in California.
96% of the 95982 zip code residents lived in the same house 1 year ago. Out of people who lived in different houses, 55% moved from this county. Out of people who lived in different houses, 52% moved from different county within same state.
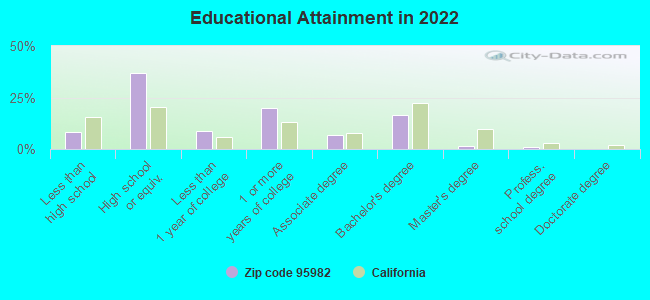
Private vs. public school enrollment:
Students in private schools in grades 1 to 8 (elementary and middle school):
Here:
0.0%
California:
10.5%
Students in private schools in grades 9 to 12 (high school):
Here:
0.0%
California:
8.5%
Students in private undergraduate colleges: 8
Here:
8.1%
California:
15.9%
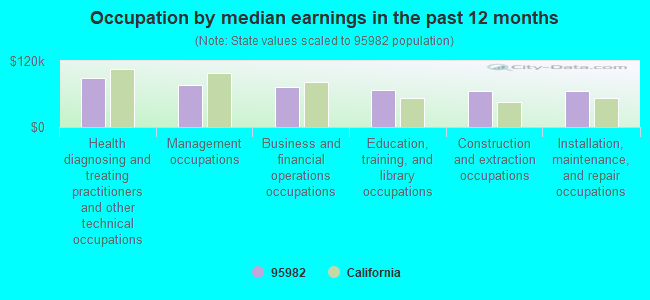
Occupation by median earnings in the past 12 months ($)
89,127Health diagnosing and treating practitioners and other technical occupations
76,373Management occupations
72,700Business and financial operations occupations
67,744Education, training, and library occupations
64,806Construction and extraction occupations
64,734Installation, maintenance, and repair occupations
Companies with federal contracts located in this zip code:
CLOSE, FRANK R & SON INC (1600 ACACIA AVE in SUTTER, CA; small business)
$3,944 with Air Force for Lumber and Related Basic Wood Materials. Signed on 2006-04-12. Completion date: 2006-05-12.
Top industries in this zip code by the number of employees in 2005:
Construction: New Single-Family Housing Construction (except Operative Builders) (20-49 employees: 1 establishment, 5-9 employees: 1 establishment, 1-4 employees: 2 establishments)
Arts, Entertainment, and Recreation: Golf Courses and Country Clubs (20-49: 1)
Wholesale Trade: Brick, Stone, and Related Construction Material Merchant Wholesalers (20-49: 1)
Construction: Other Heavy and Civil Engineering Construction (10-19: 1)
Construction: Oil and Gas Pipeline and Related Structures Construction (10-19: 1)
Construction: Painting and Wall Covering Contractors (5-9: 1, 1-4: 1)
People in group quarters in 2010:
7 people in group homes for juveniles (non-correctional)
2 people in workers' group living quarters and job corps centers
Fatal accident statistics in 2013:
Fatal accident count: 1
Vehicles involved in fatal accidents: 2
Fatal accidents caused by drunken drivers: 0
Fatalities: 1
Persons involved in fatal accidents: 2
Pedestrians involved in fatal accidents: 0
Fatal accident statistics in 2010:
Fatal accident count: 1
Vehicles involved in fatal accidents: 3
Fatal accidents caused by drunken drivers: 1
Fatalities: 1
Persons involved in fatal accidents: 5
Pedestrians involved in fatal accidents: 0
Home Mortgage Disclosure Act Aggregated Statistics For Year 2009 (Based on 2 partial tracts)
A) FHA, FSA/RHS & VA Home Purchase Loans
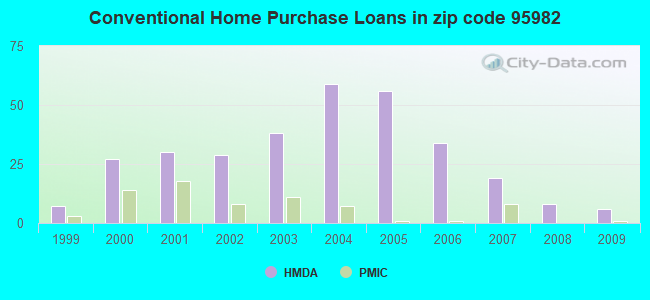
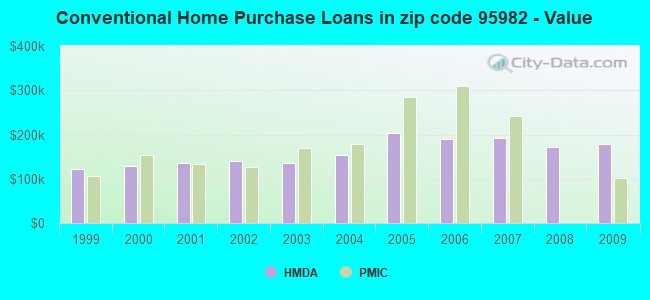
B) Conventional Home Purchase Loans
C) Refinancings
D) Home Improvement Loans
F) Non-occupant Loans on < 5 Family Dwellings (A B C & D)
Number
Average Value
Number
Average Value
Number
Average Value
Number
Average Value
Number
Average Value
LOANS ORIGINATED
16
$178,521
6
$178,623
36
$197,552
1
$240,880
3
$134,053
APPLICATIONS APPROVED, NOT ACCEPTED
1
$133,360
0
$0
1
$239,480
0
$0
0
$0
APPLICATIONS DENIED
1
$342,120
2
$201,430
10
$159,539
1
$60,740
0
$0
APPLICATIONS WITHDRAWN
3
$233,897
0
$0
12
$161,633
1
$158,490
1
$62,840
FILES CLOSED FOR INCOMPLETENESS
0
$0
0
$0
2
$219,585
0
$0
0
$0
Aggregated Statistics For Year 2008 (Based on 2 partial tracts)
A) FHA, FSA/RHS & VA Home Purchase Loans
B) Conventional Home Purchase Loans
C) Refinancings
D) Home Improvement Loans
F) Non-occupant Loans on < 5 Family Dwellings (A B C & D)
G) Loans On Manufactured Home Dwelling (A B C & D)
Number
Average Value
Number
Average Value
Number
Average Value
Number
Average Value
Number
Average Value
Number
Average Value
LOANS ORIGINATED
5
$175,388
8
$172,019
34
$202,827
6
$73,893
6
$129,283
1
$158,490
APPLICATIONS APPROVED, NOT ACCEPTED
0
$0
1
$200,380
8
$220,806
1
$187,820
1
$205,970
0
$0
APPLICATIONS DENIED
3
$220,863
1
$80,990
30
$184,744
4
$159,190
1
$153,600
3
$100,077
APPLICATIONS WITHDRAWN
2
$210,505
0
$0
15
$219,887
2
$117,300
1
$173,850
1
$97,750
FILES CLOSED FOR INCOMPLETENESS
0
$0
0
$0
3
$213,183
0
$0
0
$0
0
$0
Aggregated Statistics For Year 2007 (Based on 2 partial tracts)
A) FHA, FSA/RHS & VA Home Purchase Loans
B) Conventional Home Purchase Loans
C) Refinancings
D) Home Improvement Loans
F) Non-occupant Loans on < 5 Family Dwellings (A B C & D)
G) Loans On Manufactured Home Dwelling (A B C & D)
Number
Average Value
Number
Average Value
Number
Average Value
Number
Average Value
Number
Average Value
Number
Average Value
LOANS ORIGINATED
1
$177,340
19
$191,748
69
$205,170
9
$131,339
7
$144,827
1
$168,270
APPLICATIONS APPROVED, NOT ACCEPTED
0
$0
1
$181,530
16
$213,213
1
$84,480
0
$0
0
$0
APPLICATIONS DENIED
1
$201,080
10
$203,455
47
$255,853
3
$77,967
1
$366,550
0
$0
APPLICATIONS WITHDRAWN
0
$0
6
$180,833
14
$202,029
2
$119,740
3
$127,307
1
$105,430
FILES CLOSED FOR INCOMPLETENESS
0
$0
0
$0
6
$261,708
1
$104,730
0
$0
0
$0
Aggregated Statistics For Year 2006 (Based on 2 partial tracts)
B) Conventional Home Purchase Loans
C) Refinancings
D) Home Improvement Loans
F) Non-occupant Loans on < 5 Family Dwellings (A B C & D)
G) Loans On Manufactured Home Dwelling (A B C & D)
Number
Average Value
Number
Average Value
Number
Average Value
Number
Average Value
Number
Average Value
LOANS ORIGINATED
34
$190,711
92
$204,299
15
$103,008
6
$144,527
2
$185,025
APPLICATIONS APPROVED, NOT ACCEPTED
5
$190,330
17
$204,244
4
$70,342
1
$296,040
0
$0
APPLICATIONS DENIED
18
$218,071
45
$191,865
8
$53,412
1
$272,300
1
$34,910
APPLICATIONS WITHDRAWN
5
$297,014
52
$209,876
3
$235,527
1
$335,140
0
$0
FILES CLOSED FOR INCOMPLETENESS
1
$486,650
9
$247,086
0
$0
1
$408,450
0
$0
Aggregated Statistics For Year 2005 (Based on 2 partial tracts)
B) Conventional Home Purchase Loans
C) Refinancings
D) Home Improvement Loans
F) Non-occupant Loans on < 5 Family Dwellings (A B C & D)
G) Loans On Manufactured Home Dwelling (A B C & D)
Number
Average Value
Number
Average Value
Number
Average Value
Number
Average Value
Number
Average Value
LOANS ORIGINATED
56
$202,491
122
$196,360
26
$120,359
10
$174,061
2
$168,615
APPLICATIONS APPROVED, NOT ACCEPTED
13
$183,573
17
$178,082
1
$29,320
2
$175,945
1
$143,830
APPLICATIONS DENIED
11
$176,581
47
$203,429
12
$78,780
6
$161,168
3
$98,680
APPLICATIONS WITHDRAWN
8
$161,022
45
$192,238
8
$136,760
2
$116,950
1
$109,620
FILES CLOSED FOR INCOMPLETENESS
1
$148,020
16
$278,102
1
$79,590
0
$0
0
$0
Aggregated Statistics For Year 2004 (Based on 2 partial tracts)
A) FHA, FSA/RHS & VA Home Purchase Loans
B) Conventional Home Purchase Loans
C) Refinancings
D) Home Improvement Loans
F) Non-occupant Loans on < 5 Family Dwellings (A B C & D)
G) Loans On Manufactured Home Dwelling (A B C & D)
Number
Average Value
Number
Average Value
Number
Average Value
Number
Average Value
Number
Average Value
Number
Average Value
LOANS ORIGINATED
2
$172,105
59
$152,847
124
$152,788
27
$58,700
11
$124,025
2
$105,080
APPLICATIONS APPROVED, NOT ACCEPTED
1
$106,820
13
$184,969
18
$165,163
1
$41,890
1
$159,890
1
$192,010
APPLICATIONS DENIED
1
$145,920
13
$131,101
38
$124,041
6
$78,198
3
$139,173
0
$0
APPLICATIONS WITHDRAWN
1
$249,960
3
$146,390
41
$142,024
7
$89,669
5
$113,248
0
$0
FILES CLOSED FOR INCOMPLETENESS
1
$143,830
2
$113,805
12
$168,732
0
$0
2
$203,875
0
$0
Aggregated Statistics For Year 2003 (Based on 2 partial tracts)
A) FHA, FSA/RHS & VA Home Purchase Loans
B) Conventional Home Purchase Loans
C) Refinancings
D) Home Improvement Loans
F) Non-occupant Loans on < 5 Family Dwellings (A B C & D)
Number
Average Value
Number
Average Value
Number
Average Value
Number
Average Value
Number
Average Value
LOANS ORIGINATED
2
$173,850
38
$135,267
182
$145,540
8
$30,198
8
$87,711
APPLICATIONS APPROVED, NOT ACCEPTED
0
$0
6
$160,818
30
$148,530
3
$45,850
3
$178,040
APPLICATIONS DENIED
0
$0
12
$97,864
52
$131,194
6
$51,667
3
$143,597
APPLICATIONS WITHDRAWN
0
$0
6
$172,455
45
$153,666
0
$0
6
$77,383
FILES CLOSED FOR INCOMPLETENESS
0
$0
1
$81,690
5
$139,640
0
$0
1
$57,950
Aggregated Statistics For Year 2002 (Based on 2 partial tracts)
A) FHA, FSA/RHS & VA Home Purchase Loans
B) Conventional Home Purchase Loans
C) Refinancings
D) Home Improvement Loans
F) Non-occupant Loans on < 5 Family Dwellings (A B C & D)
Number
Average Value
Number
Average Value
Number
Average Value
Number
Average Value
Number
Average Value
LOANS ORIGINATED
4
$142,608
29
$139,520
105
$113,933
3
$32,350
10
$86,018
APPLICATIONS APPROVED, NOT ACCEPTED
0
$0
6
$173,968
16
$104,468
2
$24,435
1
$11,170
APPLICATIONS DENIED
1
$53,060
3
$96,583
41
$109,345
5
$26,950
1
$10,470
APPLICATIONS WITHDRAWN
0
$0
3
$122,883
22
$119,995
1
$34,910
0
$0
FILES CLOSED FOR INCOMPLETENESS
0
$0
0
$0
6
$122,068
0
$0
0
$0
Aggregated Statistics For Year 2001 (Based on 2 partial tracts)
A) FHA, FSA/RHS & VA Home Purchase Loans
B) Conventional Home Purchase Loans
C) Refinancings
D) Home Improvement Loans
F) Non-occupant Loans on < 5 Family Dwellings (A B C & D)
Number
Average Value
Number
Average Value
Number
Average Value
Number
Average Value
Number
Average Value
LOANS ORIGINATED
8
$100,978
30
$136,708
66
$121,275
8
$19,724
3
$84,017
APPLICATIONS APPROVED, NOT ACCEPTED
1
$108,220
2
$70,170
12
$101,297
1
$31,420
1
$78,200
APPLICATIONS DENIED
0
$0
4
$243,498
31
$88,018
6
$22,925
1
$300,230
APPLICATIONS WITHDRAWN
1
$136,850
3
$93,560
15
$111,293
1
$94,260
0
$0
FILES CLOSED FOR INCOMPLETENESS
0
$0
0
$0
3
$101,007
0
$0
0
$0
Aggregated Statistics For Year 2000 (Based on 2 partial tracts)
A) FHA, FSA/RHS & VA Home Purchase Loans
B) Conventional Home Purchase Loans
C) Refinancings
D) Home Improvement Loans
F) Non-occupant Loans on < 5 Family Dwellings (A B C & D)
Number
Average Value
Number
Average Value
Number
Average Value
Number
Average Value
Number
Average Value
LOANS ORIGINATED
8
$117,646
27
$129,607
24
$83,057
4
$38,575
3
$77,267
APPLICATIONS APPROVED, NOT ACCEPTED
0
$0
3
$123,117
8
$62,576
6
$21,295
0
$0
APPLICATIONS DENIED
3
$91,463
10
$68,773
25
$78,450
6
$43,987
3
$36,540
APPLICATIONS WITHDRAWN
3
$99,377
4
$176,645
16
$102,156
0
$0
1
$53,060
FILES CLOSED FOR INCOMPLETENESS
0
$0
1
$396,580
6
$77,267
0
$0
1
$47,480
Aggregated Statistics For Year 1999 (Based on 1 partial tract)
A) FHA, FSA/RHS & VA Home Purchase Loans
B) Conventional Home Purchase Loans
C) Refinancings
D) Home Improvement Loans
F) Non-occupant Loans on < 5 Family Dwellings (A B C & D)
Detailed PMIC statistics for the following Tracts:0508.00
2005 - 2018 National Fire Incident Reporting System (NFIRS) incidents
Based on the data from the years 2005 - 2018 the average number of fires per year is 34. The highest number of reported fires - 63 took place in 2007, and the least - 4 in 2017. The data has a dropping trend.
When looking into fire subcategories, the most incidents belonged to: Outside Fires (69.2%), and Structure Fires (14.0%).
Fire incident types reported to NFIRS in Zip Code 95982


 Nearest zip codes: 95953, 95957, 95993, 95948, 95950, 95932.


 Based on the data from the years 2005 - 2018 the average number of fires per year is 34. The highest number of reported fires - 63 took place in 2007, and the least - 4 in 2017. The data has a dropping trend.
 When looking into fire subcategories, the most incidents belonged to: Outside Fires (69.2%), and Structure Fires (14.0%).