Estimated zip code population in 2022: 745 Zip code population in 2010: 761 Zip code population in 2000: 756
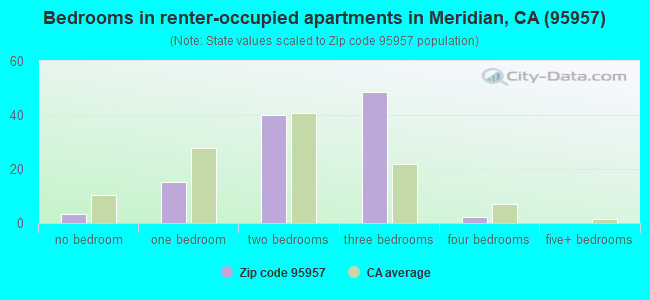
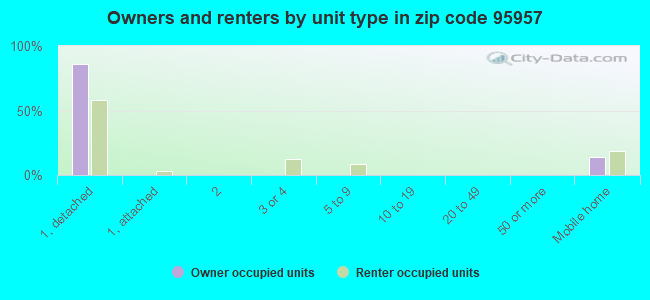
Houses and condos: 316 Renter-occupied apartments: 109
% of renters here:
40%
State:
44%
March 2022 cost of living index in zip code 95957: 93.8 (less than average, U.S. average is 100)
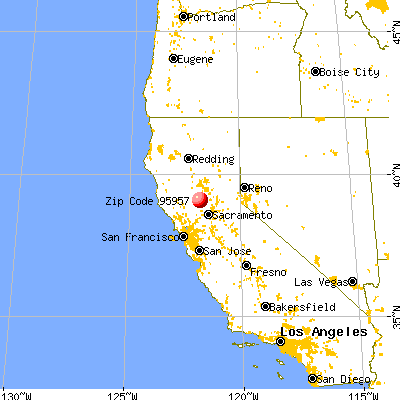
Land area: 69.9 sq. mi. Water area: 0.6 sq. mi.
Population density: 11 people per square mile
(very low).
OSM Map
General Map
Google Map
MSN Map
OSM Map
General Map
Google Map
MSN Map
OSM Map
General Map
Google Map
MSN Map
OSM Map
General Map
Google Map
MSN Map
Please wait while loading the map...
Real estate property taxes paid for housing units in 2022:
This zip code:
0.8% ($2,506)
California:
0.7% ($4,831)
Median real estate property taxes paid for housing units with mortgages in 2022: $3,066 (0.9%) Median real estate property taxes paid for housing units with no mortgage in 2022: $1,630 (0.6%)
Business Search- 14 Million verified businesses
Males: 407
(54.6%)
Females: 338
(45.4%)
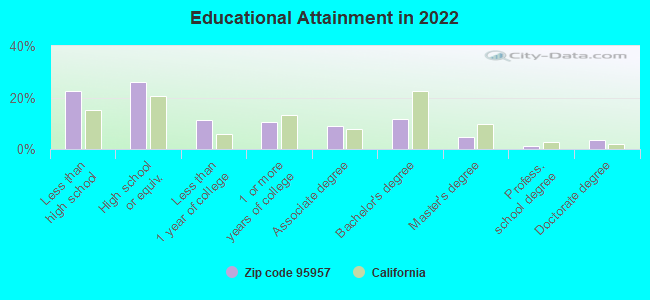
For population 25 years and over in 95957:
High school or higher: 76.2%
Bachelor's degree or higher: 20.3%
Graduate or professional degree: 8.9%
Unemployed: 6.9%
Mean travel time to work (commute): 30.8 minutes
For population 15 years and over in 95957:
Never married: 34.3%
Now married: 49.4%
Separated: 3.6%
Widowed: 5.7%
Divorced: 7.0%
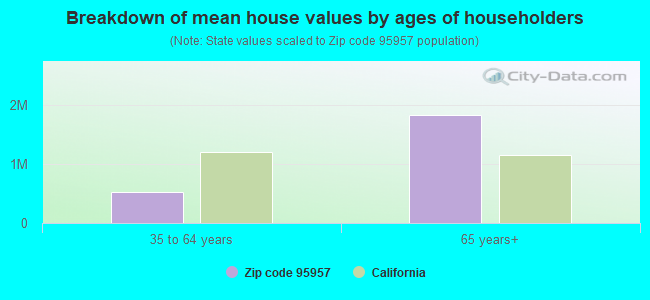
Zip code 95957 compared to state average:
Median house value significantly below state average.
Black race population percentage significantly below state average.
Foreign-born population percentage significantly below state average.
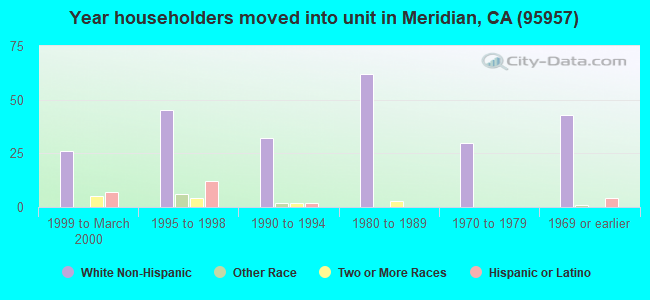
Length of stay since moving in above state average.
House age above state average.
Percentage of population with a bachelor's degree or higher below state average.
Averages for the 2020 tax year for zip code 95957, filed in 2021:
Average Adjusted Gross Income (AGI) in 2020: $63,490 (Individual Income Tax Returns)
Here:
$63,490
State:
$95,910
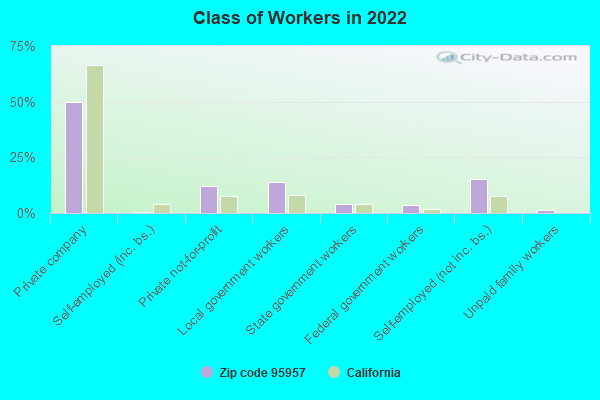
Salary/wage: $50,432 (reported on 75.9% of returns)
Here:
$50,432
State:
$77,331
(% of AGI for various income ranges: 1192.0% for AGIs below $25k, 3622.0% for AGIs $25k-50k, 5018.0% for AGIs $50k-75k, 23660.0% for AGIs $100k-200k)
Taxable interest for individuals: $875 (reported on 27.6% of returns)
This zip code:
$875
California:
$2,294
(% of AGI for various income ranges: 8.0% for AGIs below $25k, 34.0% for AGIs $50k-75k, 245.0% for AGIs $100k-200k)
Ordinary dividends: $4,140 (reported on 17.2% of returns)
Here:
$4,140
State:
$10,949
(% of AGI for various income ranges: 102.0% for AGIs below $25k)
Net capital gain/loss in AGI: +$13,525 (reported on 13.8% of returns)
Here:
+$13,525
State:
+$49,306
(% of AGI for various income ranges: )
Profit/loss from business: +$10,320 (reported on 17.2% of returns)
Here:
+$10,320
State:
+$15,671
(% of AGI for various income ranges: 260.0% for AGIs below $25k)
Taxes paid: $7,450 (reported on 6.9% of returns)
95957:
$7,450
State:
$8,807
(% of AGI for various income ranges: 298.0% for AGIs $25k-50k)
Earned income credit: $1,720 (reported on 17.2% of returns)
Here:
$1,720
State:
$2,074
(% of AGI for various income ranges: 172.0% for AGIs below $25k)
Percentage of individuals using paid preparers for their 2020 taxes: 100.0%
Here:
100%
State:
92%
(% for various income ranges: 100.0% for AGIs below $25k, 100.0% for AGIs $25k-50k, 100.0% for AGIs $50k-75k, 100.0% for AGIs $75k-100k, 100.0% for AGIs $100k-200k)
Averages for the 2012 tax year for zip code 95957, filed in 2013:
Average Adjusted Gross Income (AGI) in 2012: $51,788 (Individual Income Tax Returns)
Here:
$51,788
State:
$72,726
Salary/wage: $38,767 (reported on 72.7% of returns)
Here:
$38,767
State:
$59,079
(% of AGI for various income ranges: 69.9% for AGIs below $25k, 71.6% for AGIs $25k-50k, 111.7% for AGIs $50k-75k, 35.6% for AGIs $100k-200k)
Taxable interest for individuals: $408 (reported on 36.4% of returns)
This zip code:
$408
California:
$2,146
(% of AGI for various income ranges: 0.3% for AGIs $25k-50k, 0.9% for AGIs $50k-75k, 0.1% for AGIs $100k-200k)
Ordinary dividends: $2,267 (reported on 18.2% of returns)
Here:
$2,267
State:
$9,308
Net capital gain/loss in AGI: +$6,540 (reported on 15.2% of returns)
Here:
+$6,540
State:
+$30,460
Profit/loss from business: +$6,020 (reported on 15.2% of returns)
Here:
+$6,020
State:
+$17,064
Taxable individual retirement arrangement distribution: $6,400 (reported on 6.1% of returns)
95957:
$6,400
California:
$19,557
Total itemized deductions: $23,688 (22% of AGI, reported on 24.2% of returns)
Here:
$23,688
State:
$34,004
Here:
22.4% of AGI
State:
22.7% of AGI
(% of AGI for various income ranges: 20.5% for AGIs below $25k, 20.7% for AGIs $50k-75k, 12.4% for AGIs $100k-200k)
Charity contributions: $2,100 (reported on 21.2% of returns)
Here:
$2,100
State:
$4,659
Taxes paid: $6,550 (reported on 24.2% of returns)
95957:
$6,550
State:
$14,448
(% of AGI for various income ranges: 3.8% for AGIs below $25k, 3.9% for AGIs $50k-75k, 4.6% for AGIs $100k-200k)
Earned income credit: $2,383 (reported on 18.2% of returns)
Here:
$2,383
State:
$2,286
(% of AGI for various income ranges: 7.5% for AGIs below $25k, 1.3% for AGIs $25k-50k)
Percentage of individuals using paid preparers for their 2012 taxes: 69.7%
Here:
70%
State:
64%
(% for various income ranges: 58.3% for AGIs below $25k, 75.0% for AGIs $25k-50k, 100.0% for AGIs $50k-75k, 100.0% for AGIs $100k-200k)
Averages for the 2004 tax year for zip code 95957, filed in 2005:
Average Adjusted Gross Income (AGI) in 2004: $38,102 (Individual Income Tax Returns)
Here:
$38,102
State:
$58,600
Salary/wage: $35,688 (reported on 76.2% of returns)
Here:
$35,688
State:
$49,455
(% of AGI for various income ranges: 66.4% for AGIs $10k-25k, 86.4% for AGIs $25k-50k, 69.8% for AGIs $50k-75k, 67.0% for AGIs $75k-100k, 51.6% for AGIs over 100k)
Taxable interest for individuals: $1,044 (reported on 41.7% of returns)
This zip code:
$1,044
California:
$2,365
(% of AGI for various income ranges: 2.8% for AGIs $10k-25k, 0.6% for AGIs $25k-50k, 1.6% for AGIs $50k-75k, 0.4% for AGIs $75k-100k, 0.4% for AGIs over 100k)
Taxable dividends: $1,128 (reported on 24.1% of returns)
Here:
$1,128
State:
$4,746
(% of AGI for various income ranges: 0.6% for AGIs $10k-25k, 1.5% for AGIs $50k-75k, 0.8% for AGIs $75k-100k)
Net capital gain/loss: +$2,864 (reported on 20.4% of returns)
Here:
+$2,864
State:
+$23,418
(% of AGI for various income ranges: 0.9% for AGIs $10k-25k, 0.5% for AGIs $50k-75k, 6.8% for AGIs $75k-100k)
Profit/loss from business: +$1,043 (reported on 14.2% of returns)
Here:
+$1,043
State:
+$16,826
(% of AGI for various income ranges: 3.2% for AGIs $10k-25k, 0.5% for AGIs $50k-75k)
Total itemized deductions: $20,104 (29% of AGI, reported on 29.6% of returns)
Here:
$20,104
State:
$28,113
Here:
28.9% of AGI
State:
25.3% of AGI
(% of AGI for various income ranges: 10.2% for AGIs $25k-50k, 14.8% for AGIs $50k-75k, 24.1% for AGIs $75k-100k, 12.9% for AGIs over 100k)
Charity contributions deductions: $2,197 (3% of AGI, reported on 23.5% of returns)
Here:
$2,197
State:
$3,923
Here:
3.1% of AGI
State:
3.3% of AGI
(% of AGI for various income ranges: 1.4% for AGIs $25k-50k, 1.0% for AGIs $50k-75k, 2.8% for AGIs $75k-100k, 1.1% for AGIs over 100k)
Total tax: $5,075 (reported on 74.4% of returns)
95957:
$5,075
State:
$10,761
(% of AGI for various income ranges: 3.1% for AGIs $10k-25k, 6.5% for AGIs $25k-50k, 8.4% for AGIs $50k-75k, 10.5% for AGIs $75k-100k, 16.9% for AGIs over 100k)
Earned income credit: $1,772 (reported on 17.6% of returns)
Here:
$1,772
State:
$1,763
Percentage of individuals using paid preparers for their 2004 taxes: 72.8%
Here:
73%
State:
66%
(% for various income ranges: 78.7% for AGIs below $10k, 68.4% for AGIs $10k-25k, 63.6% for AGIs $25k-50k, 78.2% for AGIs $50k-75k, 82.8% for AGIs $75k-100k, 70.0% for AGIs over 100k)
Household received Food Stamps/SNAP in the past 12 months: 62 Household did not receive Food Stamps/SNAP in the past 12 months: 215
Women who had a birth in the past 12 months: 12 (12 now married, 0 unmarried) Women who did not have a birth in the past 12 months: 144 (63 now married, 80 unmarried)
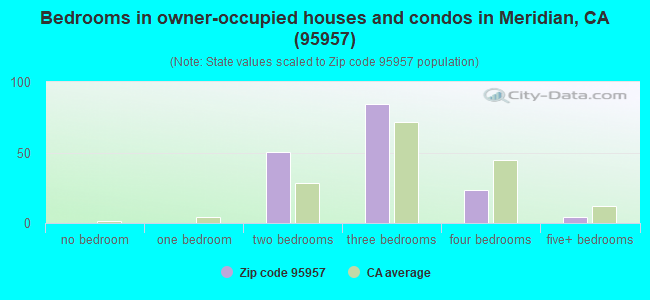
Housing units in zip code 95957 with a mortgage: 95 (4 second mortgage, 1 both second mortgage and home equity loan) Median monthly owner costs for units with a mortgage: $1,734 Median monthly owner costs for units without a mortgage: $606
Residents with income below the poverty level in 2022:
This zip code:
6.8%
Whole state:
12.2%
Residents with income below 50% of the poverty level in 2022:
This zip code:
5.5%
Whole state:
6.2%
Median number of rooms in houses and condos:
Here:
6.6
State:
6.0
Median number of rooms in apartments:
Here:
4.1
State:
3.9
Notable locations in this zip code not listed on our city pages
Size of family households: 74 2-persons, 38 3-persons, 41 4-persons, 17 5-persons, 16 6-persons
Size of nonfamily households: 63 1-person, 12 2-persons, 7 4-persons
83 married couples with children.
41 single-parent households (41 men).
73.1% of residents of 95957 zip code speak English at home.
24.9% of residents speak Spanish at home (67% very well, 15% well, 12% not well, 6% not at all).
0.9% of residents speak other Indo-European language at home (100% not well).
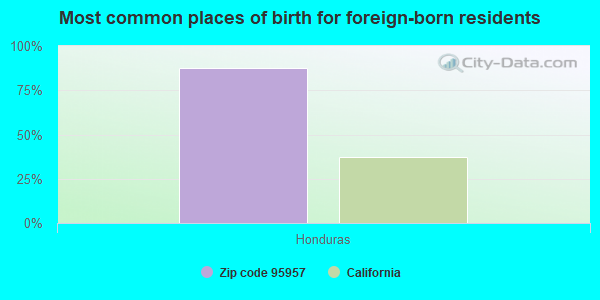
Foreign born population: 82 (11.1%) (55.9% of them are naturalized citizens)
This zip code:
11.1%
Whole state:
26.7%
88%Honduras
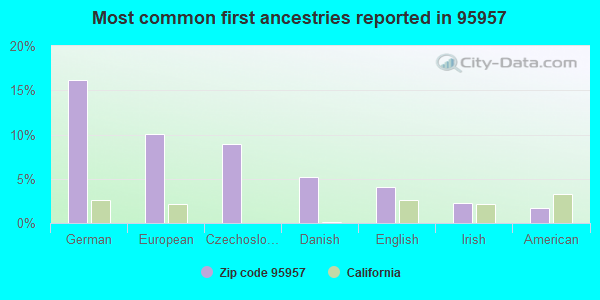
16%German
10%European
9%Czechoslovakian
5%Danish
4%English
2%Irish
2%American
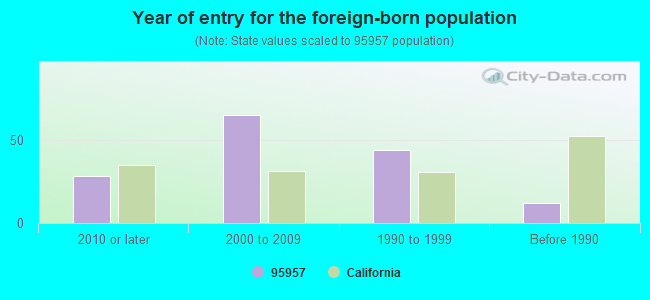
Year of entry for the foreign-born population
282010 or later
652000 to 2009
441990 to 1999
12Before 1990
Facilities with environmental interests located in this zip code:
MERIDIAN ELEMENTARY (15989 CENTRAL ST. in MERIDIAN, CA)
(National Center for Education Statistics) - STATE ID-6053300
MOBIL OIL CORP GRIMES LSE (RT 1 BOX 64 in MERIDIAN, CA)
Small Quantity Generators, between 100 kg and 1000 kg of hazardous waste/month (Resource Conservation and Recovery Act (tracking hazardous waste))
HANKINS CLASS III DISPOSAL SITE (DECKER ROAD; N HWY 20 in MERIDIAN, CA)
CRITERIA AND HAZARDOUS AIR POLLUTANT INVENTORY (Inventory of air pollution sources) Business SIC classification: REFUSE SYSTEMS Business NAICS classification: SOLID WASTE LANDFILL.
KEY PROD CO, INC (ANAPURNA#1 in MERIDIAN, CA)
CRITERIA AND HAZARDOUS AIR POLLUTANT INVENTORY (Inventory of air pollution sources) Business SIC classification: CRUDE PETROLEUM AND NATURAL GAS
MERIDIAN ELEMENTARY SCHOOL (ST RT 20 in MERIDIAN, CA)
COMPLIANCE ACTIVITY (Tracking inspections of insecticide, fungicide, and rodenticide, and toxic substances)
MERIDIAN ELEMENTARY SD (15898 CENTRAL ST in MERIDIAN, CA)
COMPLIANCE ACTIVITY (Tracking inspections of insecticide, fungicide, and rodenticide, and toxic substances)
Housing units lacking complete plumbing facilities: 4.2%
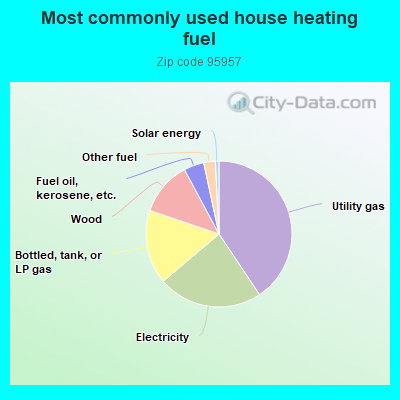
41.1%Utility gas
23.4%Electricity
16.6%Bottled, tank, or LP gas
12.1%Wood
4.5%Fuel oil, kerosene, etc.
2.6%Other fuel
0.8%Solar energy
Population in 1990: 907.
Place of birth for U.S.-born residents:
This state: 505
Northeast: 18
Midwest: 31
South: 18
West: 21
64% of the 95957 zip code residents lived in the same house 5 years ago. Out of people who lived in different houses, 59% lived in this county. Out of people who lived in different counties, 50% lived in California.
88% of the 95957 zip code residents lived in the same house 1 year ago. Out of people who lived in different houses, 25% moved from this county. Out of people who lived in different houses, 75% moved from different county within same state.
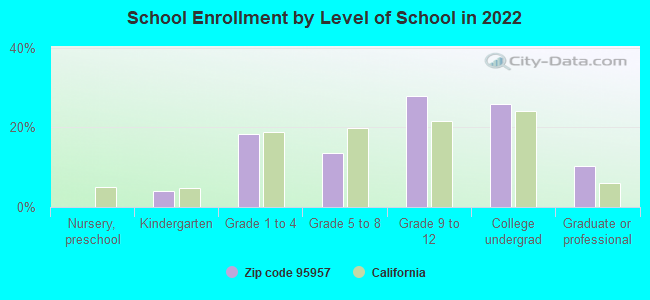
Private vs. public school enrollment:
Students in private schools in grades 1 to 8 (elementary and middle school): 6
Here:
12.9%
California:
10.5%
Students in private schools in grades 9 to 12 (high school):
Here:
0.0%
California:
8.5%
Students in private undergraduate colleges:
Here:
0.0%
California:
15.9%
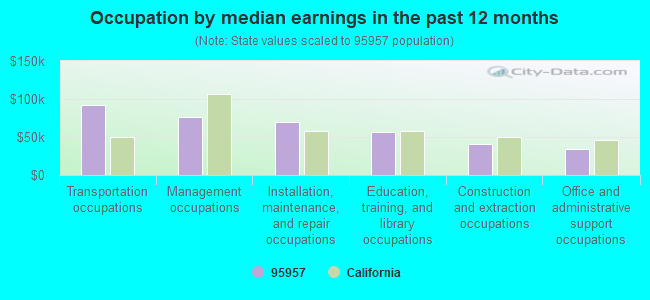
Occupation by median earnings in the past 12 months ($)
92,195Transportation occupations
75,670Management occupations
69,792Installation, maintenance, and repair occupations
57,143Education, training, and library occupations
40,181Construction and extraction occupations
33,742Office and administrative support occupations
Top industries in this zip code by the number of employees in 2005:
Wholesale Trade: Grain and Field Bean Merchant Wholesalers (10-19 employees: 1 establishment)
Accommodation and Food Services: Full-Service Restaurants (5-9: 1)
Construction: Masonry Contractors (1-4: 2)
Real Estate and Rental and Leasing: Construction, Mining, and Forestry Machinery and Equipment Rental and Leasing (1-4: 1)
Professional, Scientific, and Technical Services: Offices of Certified Public Accountants (1-4: 1)
Wholesale Trade: Other Miscellaneous Nondurable Goods Merchant Wholesalers (1-4: 1)
Real Estate and Rental and Leasing: Offices of Real Estate Appraisers (1-4: 1)
Construction: Water and Sewer Line and Related Structures Construction (1-4: 1)
People in group quarters in 2000:
43 people in agriculture workers' dormitories on farms
Fatal accident statistics in 2012:
Fatal accident count: 1
Vehicles involved in fatal accidents: 1
Fatal accidents caused by drunken drivers: 0
Fatalities: 1
Persons involved in fatal accidents: 1
Pedestrians involved in fatal accidents: 0
Fatal accident statistics in 2010:
Fatal accident count: 1
Vehicles involved in fatal accidents: 1
Fatal accidents caused by drunken drivers: 1
Fatalities: 1
Persons involved in fatal accidents: 1
Pedestrians involved in fatal accidents: 0
Home Mortgage Disclosure Act Aggregated Statistics For Year 2009 (Based on 2 partial tracts)
A) FHA, FSA/RHS & VA Home Purchase Loans
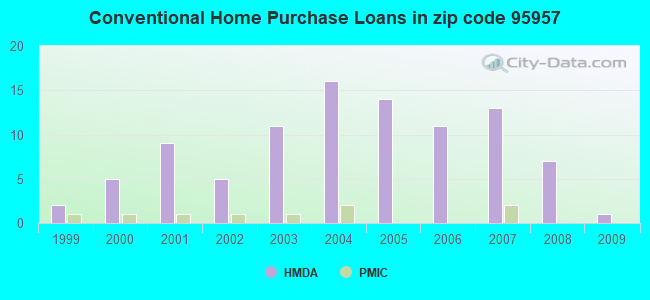
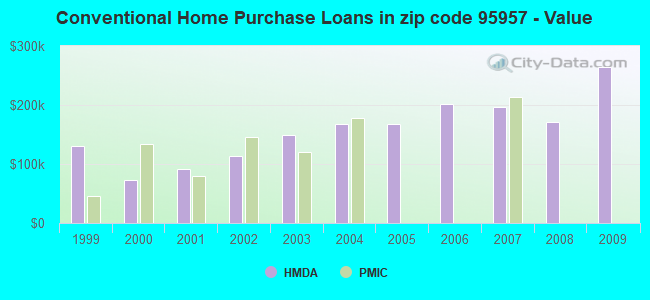
B) Conventional Home Purchase Loans
C) Refinancings
D) Home Improvement Loans
F) Non-occupant Loans on < 5 Family Dwellings (A B C & D)
G) Loans On Manufactured Home Dwelling (A B C & D)
Number
Average Value
Number
Average Value
Number
Average Value
Number
Average Value
Number
Average Value
Number
Average Value
LOANS ORIGINATED
2
$173,700
1
$264,540
14
$188,159
0
$0
0
$0
2
$123,105
APPLICATIONS APPROVED, NOT ACCEPTED
0
$0
0
$0
3
$356,437
0
$0
0
$0
0
$0
APPLICATIONS DENIED
2
$137,450
1
$189,640
5
$126,054
1
$42,230
0
$0
2
$45,420
APPLICATIONS WITHDRAWN
0
$0
0
$0
2
$142,625
1
$39,840
0
$0
0
$0
FILES CLOSED FOR INCOMPLETENESS
0
$0
2
$134,660
1
$142,630
1
$99,600
1
$99,600
0
$0
Aggregated Statistics For Year 2008 (Based on 2 partial tracts)
A) FHA, FSA/RHS & VA Home Purchase Loans
B) Conventional Home Purchase Loans
C) Refinancings
D) Home Improvement Loans
F) Non-occupant Loans on < 5 Family Dwellings (A B C & D)
G) Loans On Manufactured Home Dwelling (A B C & D)
Number
Average Value
Number
Average Value
Number
Average Value
Number
Average Value
Number
Average Value
Number
Average Value
LOANS ORIGINATED
1
$117,930
7
$171,540
7
$210,014
1
$2,390
2
$34,660
0
$0
APPLICATIONS APPROVED, NOT ACCEPTED
0
$0
1
$206,370
2
$96,015
0
$0
0
$0
0
$0
APPLICATIONS DENIED
0
$0
6
$89,507
13
$235,853
5
$206,052
2
$215,535
4
$70,715
APPLICATIONS WITHDRAWN
0
$0
0
$0
6
$154,447
0
$0
1
$286,850
0
$0
FILES CLOSED FOR INCOMPLETENESS
0
$0
1
$159,360
1
$103,580
1
$66,930
1
$103,580
0
$0
Aggregated Statistics For Year 2007 (Based on 2 partial tracts)
B) Conventional Home Purchase Loans
C) Refinancings
D) Home Improvement Loans
F) Non-occupant Loans on < 5 Family Dwellings (A B C & D)
G) Loans On Manufactured Home Dwelling (A B C & D)
Number
Average Value
Number
Average Value
Number
Average Value
Number
Average Value
Number
Average Value
LOANS ORIGINATED
13
$197,055
14
$220,486
4
$91,432
2
$252,585
1
$188,840
APPLICATIONS APPROVED, NOT ACCEPTED
3
$198,403
6
$238,243
1
$16,730
0
$0
2
$109,560
APPLICATIONS DENIED
6
$207,168
14
$236,308
2
$41,035
1
$184,060
1
$165,730
APPLICATIONS WITHDRAWN
2
$254,975
5
$274,736
0
$0
0
$0
0
$0
FILES CLOSED FOR INCOMPLETENESS
0
$0
5
$300,552
0
$0
0
$0
0
$0
Aggregated Statistics For Year 2006 (Based on 2 partial tracts)
B) Conventional Home Purchase Loans
C) Refinancings
D) Home Improvement Loans
F) Non-occupant Loans on < 5 Family Dwellings (A B C & D)
G) Loans On Manufactured Home Dwelling (A B C & D)
Number
Average Value
Number
Average Value
Number
Average Value
Number
Average Value
Number
Average Value
LOANS ORIGINATED
11
$202,387
28
$222,165
4
$152,985
7
$144,790
2
$187,250
APPLICATIONS APPROVED, NOT ACCEPTED
1
$51,000
6
$295,215
0
$0
2
$235,055
0
$0
APPLICATIONS DENIED
1
$179,280
30
$485,889
5
$109,640
2
$70,915
2
$190,835
APPLICATIONS WITHDRAWN
5
$174,500
18
$213,498
1
$168,920
2
$330,275
0
$0
FILES CLOSED FOR INCOMPLETENESS
0
$0
5
$268,362
0
$0
1
$135,460
0
$0
Aggregated Statistics For Year 2005 (Based on 2 partial tracts)
B) Conventional Home Purchase Loans
C) Refinancings
D) Home Improvement Loans
F) Non-occupant Loans on < 5 Family Dwellings (A B C & D)
G) Loans On Manufactured Home Dwelling (A B C & D)
Number
Average Value
Number
Average Value
Number
Average Value
Number
Average Value
Number
Average Value
LOANS ORIGINATED
14
$168,409
41
$206,021
5
$113,304
2
$66,930
2
$188,840
APPLICATIONS APPROVED, NOT ACCEPTED
4
$294,815
8
$334,059
1
$11,950
0
$0
2
$191,630
APPLICATIONS DENIED
14
$195,330
32
$317,898
8
$67,728
2
$106,770
5
$156,332
APPLICATIONS WITHDRAWN
9
$160,422
23
$272,644
1
$23,900
1
$200,000
0
$0
FILES CLOSED FOR INCOMPLETENESS
2
$123,505
4
$142,230
1
$47,810
0
$0
0
$0
Aggregated Statistics For Year 2004 (Based on 2 partial tracts)
A) FHA, FSA/RHS & VA Home Purchase Loans
B) Conventional Home Purchase Loans
C) Refinancings
D) Home Improvement Loans
F) Non-occupant Loans on < 5 Family Dwellings (A B C & D)
G) Loans On Manufactured Home Dwelling (A B C & D)
Number
Average Value
Number
Average Value
Number
Average Value
Number
Average Value
Number
Average Value
Number
Average Value
LOANS ORIGINATED
1
$165,730
16
$167,378
50
$156,077
2
$86,055
4
$94,620
2
$221,110
APPLICATIONS APPROVED, NOT ACCEPTED
0
$0
1
$181,670
13
$162,915
1
$36,650
1
$116,330
3
$173,703
APPLICATIONS DENIED
0
$0
2
$62,550
32
$168,797
4
$309,558
5
$154,420
6
$166,532
APPLICATIONS WITHDRAWN
0
$0
0
$0
18
$210,134
1
$24,700
1
$128,280
2
$84,860
FILES CLOSED FOR INCOMPLETENESS
0
$0
1
$286,850
3
$559,883
1
$39,840
0
$0
0
$0
Aggregated Statistics For Year 2003 (Based on 2 partial tracts)
B) Conventional Home Purchase Loans
C) Refinancings
D) Home Improvement Loans
F) Non-occupant Loans on < 5 Family Dwellings (A B C & D)
Number
Average Value
Number
Average Value
Number
Average Value
Number
Average Value
LOANS ORIGINATED
11
$148,712
41
$126,847
2
$35,460
2
$117,925
APPLICATIONS APPROVED, NOT ACCEPTED
3
$124,833
6
$135,722
1
$33,470
1
$125,100
APPLICATIONS DENIED
4
$166,930
25
$168,667
3
$28,420
3
$208,230
APPLICATIONS WITHDRAWN
5
$225,654
16
$174,798
0
$0
2
$133,860
FILES CLOSED FOR INCOMPLETENESS
1
$181,670
1
$77,290
1
$15,940
0
$0
Aggregated Statistics For Year 2002 (Based on 2 partial tracts)
A) FHA, FSA/RHS & VA Home Purchase Loans
B) Conventional Home Purchase Loans
C) Refinancings
D) Home Improvement Loans
F) Non-occupant Loans on < 5 Family Dwellings (A B C & D)
Number
Average Value
Number
Average Value
Number
Average Value
Number
Average Value
Number
Average Value
LOANS ORIGINATED
1
$93,230
5
$114,262
27
$113,913
2
$53,785
1
$74,900
APPLICATIONS APPROVED, NOT ACCEPTED
0
$0
2
$63,345
4
$125,895
0
$0
0
$0
APPLICATIONS DENIED
0
$0
1
$107,570
21
$95,616
0
$0
0
$0
APPLICATIONS WITHDRAWN
0
$0
1
$7,970
14
$187,646
0
$0
0
$0
FILES CLOSED FOR INCOMPLETENESS
0
$0
0
$0
5
$89,242
0
$0
0
$0
Aggregated Statistics For Year 2001 (Based on 2 partial tracts)
A) FHA, FSA/RHS & VA Home Purchase Loans
B) Conventional Home Purchase Loans
C) Refinancings
D) Home Improvement Loans
F) Non-occupant Loans on < 5 Family Dwellings (A B C & D)
Number
Average Value
Number
Average Value
Number
Average Value
Number
Average Value
Number
Average Value
LOANS ORIGINATED
2
$75,695
9
$91,632
20
$105,616
2
$27,090
1
$71,710
APPLICATIONS APPROVED, NOT ACCEPTED
1
$101,190
2
$70,915
4
$103,385
0
$0
0
$0
APPLICATIONS DENIED
1
$84,460
5
$95,298
22
$106,989
0
$0
1
$114,740
APPLICATIONS WITHDRAWN
1
$94,020
2
$74,500
10
$86,453
1
$23,900
2
$123,105
FILES CLOSED FOR INCOMPLETENESS
0
$0
0
$0
3
$97,740
0
$0
0
$0
Aggregated Statistics For Year 2000 (Based on 2 partial tracts)
A) FHA, FSA/RHS & VA Home Purchase Loans
B) Conventional Home Purchase Loans
C) Refinancings
D) Home Improvement Loans
F) Non-occupant Loans on < 5 Family Dwellings (A B C & D)
Number
Average Value
Number
Average Value
Number
Average Value
Number
Average Value
Number
Average Value
LOANS ORIGINATED
2
$79,680
5
$73,306
9
$85,612
1
$7,970
2
$40,240
APPLICATIONS APPROVED, NOT ACCEPTED
2
$74,900
2
$67,730
1
$85,260
0
$0
0
$0
APPLICATIONS DENIED
1
$82,070
2
$93,225
6
$71,313
1
$16,730
1
$60,560
APPLICATIONS WITHDRAWN
0
$0
0
$0
6
$62,150
0
$0
1
$60,560
FILES CLOSED FOR INCOMPLETENESS
0
$0
0
$0
2
$76,890
0
$0
0
$0
Aggregated Statistics For Year 1999 (Based on 1 partial tract)
A) FHA, FSA/RHS & VA Home Purchase Loans
B) Conventional Home Purchase Loans
C) Refinancings
D) Home Improvement Loans
F) Non-occupant Loans on < 5 Family Dwellings (A B C & D)
Detailed PMIC statistics for the following Tracts:0509.00
2003 - 2018 National Fire Incident Reporting System (NFIRS) incidents
Based on the data from the years 2003 - 2018 the average number of fires per year is 15. The highest number of fires - 69 took place in 2005, and the least - 0 in 2004. The data has an increasing trend.
When looking into fire subcategories, the most reports belonged to: Outside Fires (67.6%), and Structure Fires (14.7%).
Fire incident types reported to NFIRS in Zip Code 95957


 Nearest zip codes: 95950, 95982, 95993, 95645, 95953, 95991.
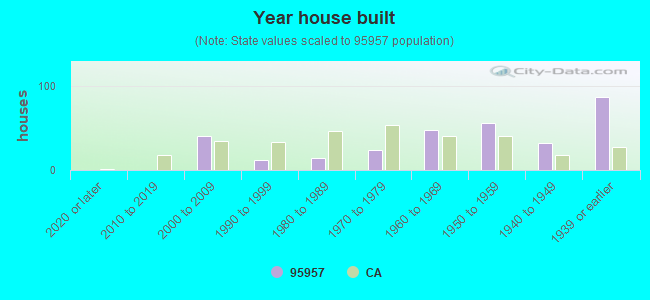


 Based on the data from the years 2003 - 2018 the average number of fires per year is 15. The highest number of fires - 69 took place in 2005, and the least - 0 in 2004. The data has an increasing trend.
 When looking into fire subcategories, the most reports belonged to: Outside Fires (67.6%), and Structure Fires (14.7%).