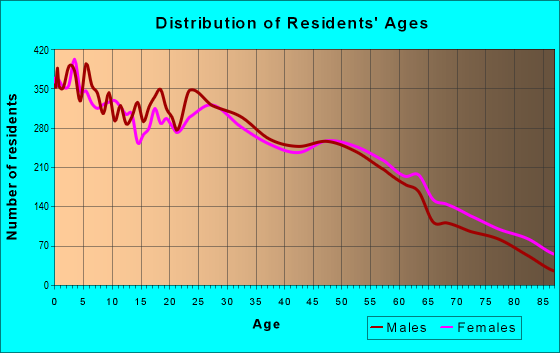
Estimated zip code population in 2022: 43,612 Zip code population in 2010: 40,593 Zip code population in 2000: 34,957
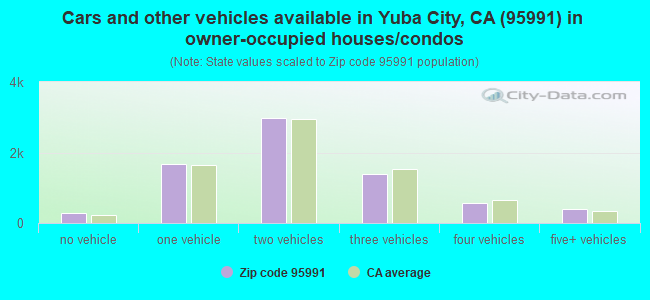
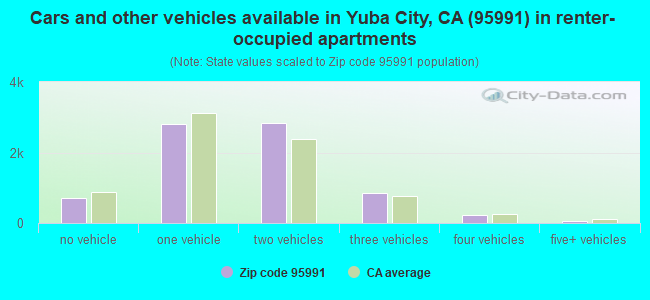
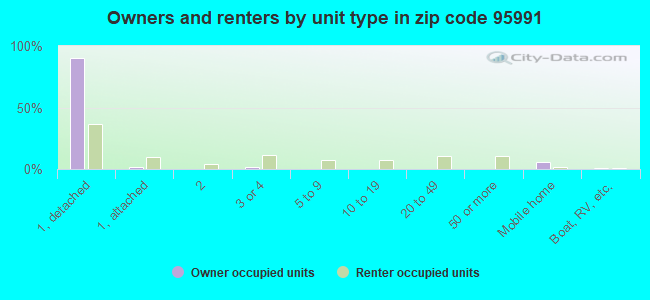
Houses and condos: 15,363 Renter-occupied apartments: 7,510
% of renters here:
51%
State:
44%
March 2022 cost of living index in zip code 95991: 93.8 (less than average, U.S. average is 100)
Land area: 40.7 sq. mi. Water area: 1.1 sq. mi.
Population density: 1,071 people per square mile
(low).
OSM Map
General Map
Google Map
MSN Map
OSM Map
General Map
Google Map
MSN Map
OSM Map
General Map
Google Map
MSN Map
OSM Map
General Map
Google Map
MSN Map
Please wait while loading the map...
Real estate property taxes paid for housing units in 2022:
This zip code:
0.7% ($2,823)
California:
0.7% ($4,831)
Median real estate property taxes paid for housing units with mortgages in 2022: $3,097 (0.8%) Median real estate property taxes paid for housing units with no mortgage in 2022: $2,255 (0.7%)
Averages for the 2020 tax year for zip code 95991, filed in 2021:
Average Adjusted Gross Income (AGI) in 2020: $52,903 (Individual Income Tax Returns)
Here:
$52,903
State:
$95,910
Salary/wage: $45,792 (reported on 83.6% of returns)
Here:
$45,792
State:
$77,331
(% of AGI for various income ranges: 1359.5% for AGIs below $25k, 4129.1% for AGIs $25k-50k, 7401.5% for AGIs $50k-75k, 10481.6% for AGIs $75k-100k, 18871.6% for AGIs $100k-200k, 65076.0% for AGIs over 200k)
Taxable interest for individuals: $811 (reported on 27.8% of returns)
This zip code:
$811
California:
$2,294
(% of AGI for various income ranges: 8.7% for AGIs below $25k, 9.9% for AGIs $25k-50k, 25.9% for AGIs $50k-75k, 62.1% for AGIs $75k-100k, 86.9% for AGIs $100k-200k, 1416.0% for AGIs over 200k)
Ordinary dividends: $4,040 (reported on 9.2% of returns)
Here:
$4,040
State:
$10,949
(% of AGI for various income ranges: 12.7% for AGIs below $25k, 19.2% for AGIs $25k-50k, 37.6% for AGIs $50k-75k, 96.5% for AGIs $75k-100k, 164.2% for AGIs $100k-200k, 2228.0% for AGIs over 200k)
Net capital gain/loss in AGI: +$13,278 (reported on 9.1% of returns)
Here:
+$13,278
State:
+$49,306
(% of AGI for various income ranges: 5.2% for AGIs below $25k, 12.6% for AGIs $25k-50k, 29.4% for AGIs $50k-75k, 176.0% for AGIs $75k-100k, 305.5% for AGIs $100k-200k, 15637.0% for AGIs over 200k)
Profit/loss from business: +$13,138 (reported on 14.0% of returns)
Here:
+$13,138
State:
+$15,671
(% of AGI for various income ranges: 123.7% for AGIs below $25k, 234.1% for AGIs $25k-50k, 250.6% for AGIs $50k-75k, 380.3% for AGIs $75k-100k, 618.8% for AGIs $100k-200k, 5224.0% for AGIs over 200k)
Taxable individual retirement arrangement distribution: $16,445 (reported on 4.2% of returns)
95991:
$16,445
California:
$23,505
(% of AGI for various income ranges: 21.5% for AGIs below $25k, 41.0% for AGIs $25k-50k, 90.3% for AGIs $50k-75k, 227.3% for AGIs $75k-100k, 356.6% for AGIs $100k-200k, 2745.0% for AGIs over 200k)
Self-employed (Keogh) retirement plans: $24,425 (reported on 0.2% of returns)
95991:
$24,425
California:
$30,163
(% of AGI for various income ranges: 97.7% for AGIs $100k-200k)
Total itemized deductions: $29,131 (reported on 6.6% of returns)
Here:
$29,131
State:
$39,517
(% of AGI for various income ranges: 37.5% for AGIs below $25k, 94.1% for AGIs $25k-50k, 280.6% for AGIs $50k-75k, 583.5% for AGIs $75k-100k, 1247.3% for AGIs $100k-200k, 6446.0% for AGIs over 200k)
Charity contributions: $7,032 (reported on 5.1% of returns)
Here:
$7,032
State:
$12,598
(% of AGI for various income ranges: 1.7% for AGIs below $25k, 8.3% for AGIs $25k-50k, 31.2% for AGIs $50k-75k, 83.3% for AGIs $75k-100k, 247.1% for AGIs $100k-200k, 2246.0% for AGIs over 200k)
Taxes paid: $7,625 (reported on 6.6% of returns)
95991:
$7,625
State:
$8,807
(% of AGI for various income ranges: 4.6% for AGIs below $25k, 17.9% for AGIs $25k-50k, 62.3% for AGIs $50k-75k, 171.3% for AGIs $75k-100k, 399.7% for AGIs $100k-200k, 1425.0% for AGIs over 200k)
Earned income credit: $2,286 (reported on 21.0% of returns)
Here:
$2,286
State:
$2,074
(% of AGI for various income ranges: 122.8% for AGIs below $25k, 96.6% for AGIs $25k-50k, 2.5% for AGIs $50k-75k)
Percentage of individuals using paid preparers for their 2020 taxes: 94.6%
Here:
95%
State:
92%
(% for various income ranges: 93.5% for AGIs below $25k, 95.3% for AGIs $25k-50k, 95.1% for AGIs $50k-75k, 95.4% for AGIs $75k-100k, 95.2% for AGIs $100k-200k, 94.4% for AGIs over 200k)
Averages for the 2012 tax year for zip code 95991, filed in 2013:
Average Adjusted Gross Income (AGI) in 2012: $42,585 (Individual Income Tax Returns)
Here:
$42,585
State:
$72,726
Salary/wage: $36,264 (reported on 85.1% of returns)
Here:
$36,264
State:
$59,079
(% of AGI for various income ranges: 77.7% for AGIs below $25k, 80.3% for AGIs $25k-50k, 75.2% for AGIs $50k-75k, 75.0% for AGIs $75k-100k, 72.0% for AGIs $100k-200k, 40.7% for AGIs over 200k)
Taxable interest for individuals: $867 (reported on 28.7% of returns)
This zip code:
$867
California:
$2,146
(% of AGI for various income ranges: 0.7% for AGIs below $25k, 0.4% for AGIs $25k-50k, 0.4% for AGIs $50k-75k, 0.6% for AGIs $75k-100k, 0.8% for AGIs $100k-200k, 0.9% for AGIs over 200k)
Ordinary dividends: $3,553 (reported on 10.9% of returns)
Here:
$3,553
State:
$9,308
(% of AGI for various income ranges: 0.6% for AGIs below $25k, 0.5% for AGIs $25k-50k, 0.7% for AGIs $50k-75k, 0.7% for AGIs $75k-100k, 1.1% for AGIs $100k-200k, 2.4% for AGIs over 200k)
Net capital gain/loss in AGI: +$8,899 (reported on 8.6% of returns)
Here:
+$8,899
State:
+$30,460
(% of AGI for various income ranges: 0.2% for AGIs $25k-50k, 0.2% for AGIs $50k-75k, 0.4% for AGIs $75k-100k, 1.1% for AGIs $100k-200k, 13.9% for AGIs over 200k)
Profit/loss from business: +$11,971 (reported on 12.6% of returns)
Here:
+$11,971
State:
+$17,064
(% of AGI for various income ranges: 6.7% for AGIs below $25k, 3.3% for AGIs $25k-50k, 2.2% for AGIs $50k-75k, 1.8% for AGIs $75k-100k, 2.5% for AGIs $100k-200k, 6.3% for AGIs over 200k)
Taxable individual retirement arrangement distribution: $13,748 (reported on 6.1% of returns)
95991:
$13,748
California:
$19,557
(% of AGI for various income ranges: 1.5% for AGIs below $25k, 1.3% for AGIs $25k-50k, 1.8% for AGIs $50k-75k, 2.0% for AGIs $75k-100k, 2.6% for AGIs $100k-200k, 2.7% for AGIs over 200k)
Self-employment retirement plans: $21,250 (reported on 0.4% of returns)
95991:
$21,250
California:
$24,530
Total itemized deductions: $21,289 (24% of AGI, reported on 25.4% of returns)
Here:
$21,289
State:
$34,004
Here:
24.4% of AGI
State:
22.7% of AGI
(% of AGI for various income ranges: 6.1% for AGIs below $25k, 8.8% for AGIs $25k-50k, 14.2% for AGIs $50k-75k, 16.4% for AGIs $75k-100k, 17.0% for AGIs $100k-200k, 14.1% for AGIs over 200k)
Charity contributions: $3,237 (reported on 20.4% of returns)
Here:
$3,237
State:
$4,659
(% of AGI for various income ranges: 0.4% for AGIs below $25k, 0.9% for AGIs $25k-50k, 1.5% for AGIs $50k-75k, 1.8% for AGIs $75k-100k, 2.3% for AGIs $100k-200k, 2.6% for AGIs over 200k)
Taxes paid: $6,786 (reported on 25.4% of returns)
95991:
$6,786
State:
$14,448
(% of AGI for various income ranges: 1.2% for AGIs below $25k, 1.9% for AGIs $25k-50k, 3.6% for AGIs $50k-75k, 4.8% for AGIs $75k-100k, 6.4% for AGIs $100k-200k, 7.5% for AGIs over 200k)
Earned income credit: $2,337 (reported on 26.8% of returns)
Here:
$2,337
State:
$2,286
(% of AGI for various income ranges: 7.5% for AGIs below $25k, 1.7% for AGIs $25k-50k)
Percentage of individuals using paid preparers for their 2012 taxes: 63.4%
Here:
63%
State:
64%
(% for various income ranges: 61.2% for AGIs below $25k, 65.2% for AGIs $25k-50k, 64.1% for AGIs $50k-75k, 63.6% for AGIs $75k-100k, 65.7% for AGIs $100k-200k, 82.4% for AGIs over 200k)
Averages for the 2004 tax year for zip code 95991, filed in 2005:
Average Adjusted Gross Income (AGI) in 2004: $38,305 (Individual Income Tax Returns)
Here:
$38,305
State:
$58,600
Salary/wage: $34,243 (reported on 85.8% of returns)
Here:
$34,243
State:
$49,455
(% of AGI for various income ranges: 144.8% for AGIs below $10k, 79.5% for AGIs $10k-25k, 82.0% for AGIs $25k-50k, 80.3% for AGIs $50k-75k, 81.0% for AGIs $75k-100k, 59.7% for AGIs over 100k)
Taxable interest for individuals: $1,375 (reported on 37.5% of returns)
This zip code:
$1,375
California:
$2,365
(% of AGI for various income ranges: 5.8% for AGIs below $10k, 1.4% for AGIs $10k-25k, 1.0% for AGIs $25k-50k, 0.8% for AGIs $50k-75k, 1.0% for AGIs $75k-100k, 2.1% for AGIs over 100k)
Taxable dividends: $2,251 (reported on 14.8% of returns)
Here:
$2,251
State:
$4,746
(% of AGI for various income ranges: 3.2% for AGIs below $10k, 0.9% for AGIs $10k-25k, 0.6% for AGIs $25k-50k, 0.6% for AGIs $50k-75k, 0.6% for AGIs $75k-100k, 1.4% for AGIs over 100k)
Net capital gain/loss: +$9,356 (reported on 12.6% of returns)
Here:
+$9,356
State:
+$23,418
(% of AGI for various income ranges: -1.2% for AGIs below $10k, 0.3% for AGIs $10k-25k, 0.6% for AGIs $25k-50k, 1.0% for AGIs $50k-75k, 2.0% for AGIs $75k-100k, 10.0% for AGIs over 100k)
Profit/loss from business: +$13,022 (reported on 12.5% of returns)
Here:
+$13,022
State:
+$16,826
(% of AGI for various income ranges: -1.3% for AGIs below $10k, 3.2% for AGIs $10k-25k, 2.4% for AGIs $25k-50k, 3.1% for AGIs $50k-75k, 2.3% for AGIs $75k-100k, 9.3% for AGIs over 100k)
IRA payment deduction: $2,974 (reported on 1.9% of returns)
95991:
$2,974
California:
$3,192
(% of AGI for various income ranges: 0.4% for AGIs below $10k, 0.1% for AGIs $10k-25k, 0.2% for AGIs $25k-50k, 0.1% for AGIs $50k-75k, 0.2% for AGIs $75k-100k, 0.1% for AGIs over 100k)
Self-employed pension: $14,517 (reported on 0.6% of returns)
Here:
$14,517
California:
$17,688
(% of AGI for various income ranges: 0.1% for AGIs $25k-50k, 0.1% for AGIs $50k-75k, 0.1% for AGIs $75k-100k, 0.8% for AGIs over 100k)
Total itemized deductions: $18,791 (26% of AGI, reported on 31.5% of returns)
Here:
$18,791
State:
$28,113
Here:
26.2% of AGI
State:
25.3% of AGI
(% of AGI for various income ranges: 18.8% for AGIs below $10k, 7.6% for AGIs $10k-25k, 12.9% for AGIs $25k-50k, 18.6% for AGIs $50k-75k, 19.5% for AGIs $75k-100k, 16.5% for AGIs over 100k)
Charity contributions deductions: $2,750 (4% of AGI, reported on 27.2% of returns)
Here:
$2,750
State:
$3,923
Here:
3.7% of AGI
State:
3.3% of AGI
(% of AGI for various income ranges: 0.9% for AGIs below $10k, 0.7% for AGIs $10k-25k, 1.4% for AGIs $25k-50k, 2.1% for AGIs $50k-75k, 2.6% for AGIs $75k-100k, 2.6% for AGIs over 100k)
Total tax: $5,162 (reported on 68.4% of returns)
95991:
$5,162
State:
$10,761
(% of AGI for various income ranges: 4.0% for AGIs below $10k, 3.4% for AGIs $10k-25k, 5.8% for AGIs $25k-50k, 7.9% for AGIs $50k-75k, 9.6% for AGIs $75k-100k, 17.1% for AGIs over 100k)
Earned income credit: $1,751 (reported on 20.6% of returns)
Here:
$1,751
State:
$1,763
Percentage of individuals using paid preparers for their 2004 taxes: 63.3%
Here:
63%
State:
66%
(% for various income ranges: 55.4% for AGIs below $10k, 63.8% for AGIs $10k-25k, 64.5% for AGIs $25k-50k, 65.6% for AGIs $50k-75k, 64.5% for AGIs $75k-100k, 73.3% for AGIs over 100k)
Likely homosexual households (counted as self-reported same-sex unmarried-partner households)
Lesbian couples: 0.2% of all households
Gay men: 0.1% of all households
Household received Food Stamps/SNAP in the past 12 months: 2,997 Household did not receive Food Stamps/SNAP in the past 12 months: 12,077
Women who had a birth in the past 12 months: 632 (389 now married, 244 unmarried) Women who did not have a birth in the past 12 months: 9,714 (4,247 now married, 5,450 unmarried)
Housing units in zip code 95991 with a mortgage: 4,810 (304 second mortgage, 18 home equity loan, 170 both second mortgage and home equity loan) Houses without a mortgage: 99
Median monthly owner costs for units with a mortgage: $1,853 Median monthly owner costs for units without a mortgage: $603
Residents with income below the poverty level in 2022:
This zip code:
15.5%
Whole state:
12.2%
Residents with income below 50% of the poverty level in 2022:
This zip code:
8.9%
Whole state:
6.2%
Median number of rooms in houses and condos:
Here:
6.1
State:
6.0
Median number of rooms in apartments:
Here:
4.3
State:
3.9
Notable locations in this zip code not listed on our city pages
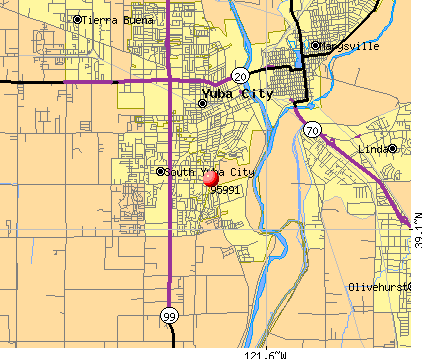
Notable locations in zip code 95991: Starrs Landing (A), Yuba City Womens Club (B), Yuba City City Hall (C), Sutter County Office Building (D), Sutter County Law Library (E), Sutter County Jail (F), Sutter County Free Library (G), Sutter County Courthouse (H), Sutter - Yuba Mental Health Services (I), North Valley Behavioral Health (J), Yuba City Farm Labor Center (K), Sutter County Fire Department (L), Yuba City Fire Department Station 2 (M), Yuba City Fire Department Station 3 (N), Yuba City Fire Department Station 1 (O). Display/hide their locations on the map
Churches in zip code 95991 include: Tabernacle De La Fe (A), Saint Isidore Catholic Church (B), Reorganized Church of Jesus Christ of Latter Day Saints (C), Pentecostal Holiness Church (D), Kingdom Hall of Jehovahs Witnesses (E), First United Methodist Church (F), First Lutheran Church (G), First Church of Christ Scientist (H), Cooper Avenue Baptist Church (I). Display/hide their locations on the map
Parks in zip code 95991 include: Alta Park (1), Blackburn Talley Park (2), Gauche Park (3), Hillcrest Park (4), Kingwood Park (5), Maple Park (6), Morley Park (7), Sam Brannan Park (8), Shanghai Bend Park (9). Display/hide their locations on the map
6,421 married couples with children.
3,404 single-parent households (905 men, 2,499 women).
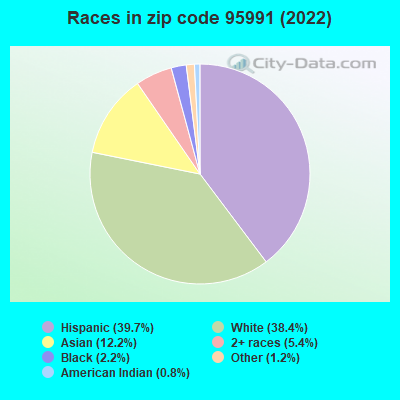
61.9% of residents of 95991 zip code speak English at home.
25.8% of residents speak Spanish at home (57% very well, 16% well, 16% not well, 11% not at all).
10.8% of residents speak other Indo-European language at home (56% very well, 15% well, 17% not well, 12% not at all).
1.3% of residents speak Asian or Pacific Island language at home (40% very well, 50% well, 8% not well, 2% not at all).
0.2% of residents speak other language at home (34% very well, 62% well, 4% not well).
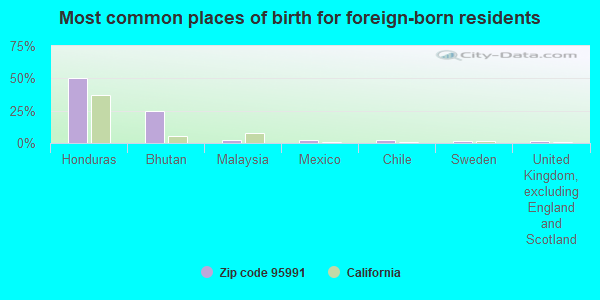
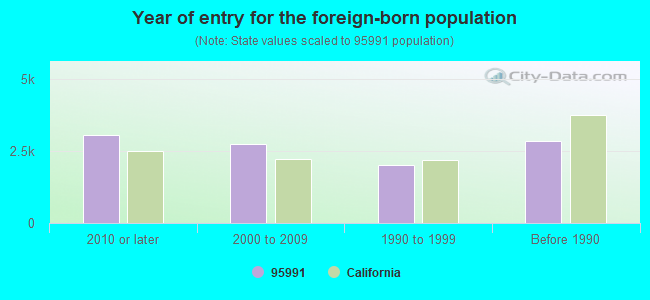
Foreign born population: 9,675 (22.2%) (42.0% of them are naturalized citizens)
Major facilities with environmental interests located in this zip code:
JOHN TAYLOR FERTILIZER COMPANY INCORPORATED YUBA CITY (900 N. GEORGE WASHINGTON BLVD. in YUBA CITY, CA)
STATE MASTER (California - Hazardous Waste Tracking) - HAZARDOU WASTE PROGRAM COMPLIANCE ACTIVITY (Tracking inspections of insecticide, fungicide, and rodenticide, and toxic substances) Small Quantity Generators, between 100 kg and 1000 kg of hazardous waste/month (Resource Conservation and Recovery Act (tracking hazardous waste)) - notification Organizations: JOHN TAYLOR FERTILIZERS CO (CONTACT/OWNER)
Alternative names: JOHN TAYLOR FERTILIZER/YUBA CITY, JOHN TAYLOR FERTILIZERS YUBA, JOHN TAYLOR OF YUBA CITY, TAYLOR JOHN-YUBA CITY
A 1 BODY SHOP AND TOWING (527 GARDEN HWY in YUBA CITY, CA)
STATE MASTER (California - Hazardous Waste Tracking) - HAZARDOU WASTE PROGRAM Small Quantity Generators, between 100 kg and 1000 kg of hazardous waste/month (Resource Conservation and Recovery Act (tracking hazardous waste)) - notification Organizations: MARVIN THOMAS (CONTACT/OWNER)
EQUILON ENTERPRISES (1280 BRIDGE ST in YUBA CITY, CA) . Federal Facility
STATE MASTER (California - Hazardous Waste Tracking) - HAZARDOU WASTE PROGRAM Small Quantity Generators, between 100 kg and 1000 kg of hazardous waste/month (Resource Conservation and Recovery Act (tracking hazardous waste)) - notification Organizations: EQUILON ENTERPRISES, LLC (CONTACT/OWNER)
Alternative names: SHELL OIL CO
EQUILON ENTERPRISES (831 COLUSA AVE in YUBA CITY, CA) . Federal Facility
STATE MASTER (California - Hazardous Waste Tracking) - HAZARDOU WASTE PROGRAM Small Quantity Generators, between 100 kg and 1000 kg of hazardous waste/month (Resource Conservation and Recovery Act (tracking hazardous waste)) - notification Organizations: EQUILON ENTERPRISES LLC (CONTACT/OWNER)
Alternative names: SHELL OIL CO
JIFFY LUBE #2611 (660 COLUSA AVE in YUBA CITY, CA)
Small Quantity Generators, between 100 kg and 1000 kg of hazardous waste/month (Resource Conservation and Recovery Act (tracking hazardous waste)) - notification STATE MASTER (California - Used Oil Recycling System ) - USED OIL RECYCLING Business NAICS classification: ALL OTHER AUTOMOTIVE REPAIR AND MAINTENANCE. Organizations: JAMES R ETHINGTON (CONTACT/OWNER)
Alternative names: MINIT LUBE NO 1581
LARRY GEWEKE FORD (871 E ONSTOTT RD in YUBA CITY, CA)
STATE MASTER (California - Hazardous Waste Tracking) - HAZARDOU WASTE PROGRAM Small Quantity Generators, between 100 kg and 1000 kg of hazardous waste/month (Resource Conservation and Recovery Act (tracking hazardous waste)) - notification
GRAY AVENUE ELEMENTARY (808 GRAY AVE. in YUBA CITY, CA)
(National Center for Education Statistics) - STATE ID-6053383 Organizations: YUBA CITY UNIFIED (SCHOOL DISTRICT)
APRIL LANE ELEMENTARY (800 APRIL LANE in YUBA CITY, CA)
(National Center for Education Statistics) - STATE ID-6053342 Organizations: YUBA CITY UNIFIED (SCHOOL DISTRICT)
KING AVENUE ELEMENTARY (630 KING AVE. in YUBA CITY, CA)
(National Center for Education Statistics) - STATE ID-6053391 Organizations: YUBA CITY UNIFIED (SCHOOL DISTRICT)
LINCREST ELEMENTARY (1400 PHILLIPS ROAD in YUBA CITY, CA)
(National Center for Education Statistics) - STATE ID-6053417 Organizations: YUBA CITY UNIFIED (SCHOOL DISTRICT)
(Resource Conservation and Recovery Act (tracking hazardous waste)) Organizations: BEER JEAN F (CONTACT/OWNER)
JASCHKE PAINT & BODY (1475 FRANKLIN in YUBA CITY, CA)
(Resource Conservation and Recovery Act (tracking hazardous waste)) Organizations: GLENN A JASCHKE (CONTACT/OWNER)
Housing units lacking complete plumbing facilities: 0.4% Housing units lacking complete kitchen facilities: 1.7%
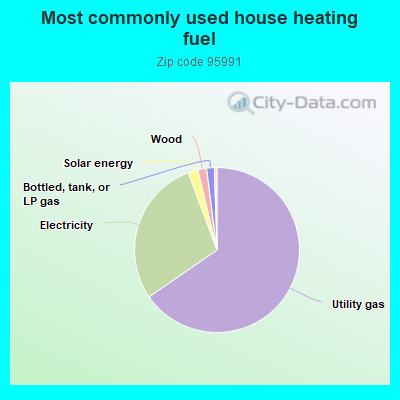
65.2%Utility gas
28.9%Electricity
1.9%Solar energy
1.7%Wood
1.5%Bottled, tank, or LP gas
0.5%No fuel used
Population in 1990: 30,201. Population change in the 1990s: +4,756 (+15.7%).
Place of birth for U.S.-born residents:
This state: 27,600
Northeast: 1,042
Midwest: 1,115
South: 1,808
West: 1,573
47% of the 95991 zip code residents lived in the same house 5 years ago. Out of people who lived in different houses, 57% lived in this county. Out of people who lived in different counties, 50% lived in California.
86% of the 95991 zip code residents lived in the same house 1 year ago. Out of people who lived in different houses, 36% moved from this county. Out of people who lived in different houses, 51% moved from different county within same state. Out of people who lived in different houses, 7% moved from different state. Out of people who lived in different houses, 7% moved from abroad.
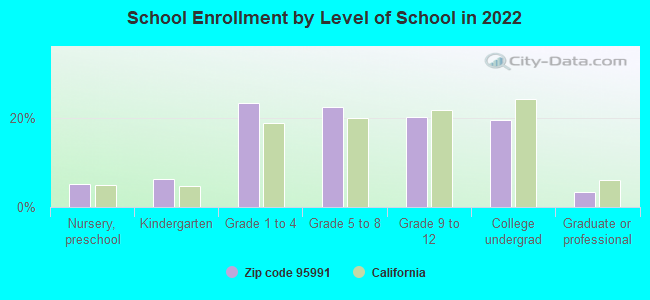
Private vs. public school enrollment:
Students in private schools in grades 1 to 8 (elementary and middle school): 96
Here:
1.8%
California:
10.5%
Students in private schools in grades 9 to 12 (high school): 100
Here:
4.2%
California:
8.5%
Students in private undergraduate colleges: 122
Here:
5.3%
California:
15.9%
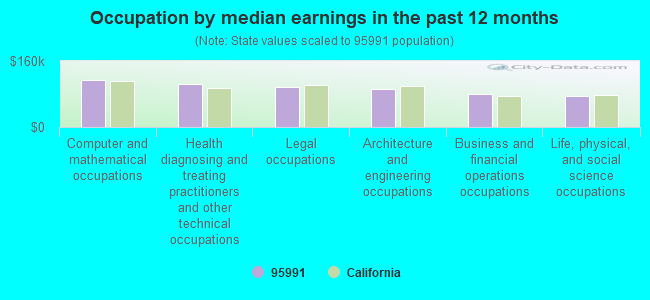
Occupation by median earnings in the past 12 months ($)
114,881Computer and mathematical occupations
103,034Health diagnosing and treating practitioners and other technical occupations
97,551Legal occupations
91,760Architecture and engineering occupations
79,353Business and financial operations occupations
74,228Life, physical, and social science occupations
Companies with federal contracts located in this zip code (YUBA CITY, CA):
ARTHUR VINCENT DOMBROWSKI JR (935-A SPIVA AVENUE; small business) : $701,395 in 8 contractsfrom 2001 to 2005
Contracts for Packing/Crating Services, Miscellaneous Items, Motor Freight by Air Force Signed by year:2000: $0; 2001: $130,000; 2002: $65,600; 2003: $218,325; 2004: $201,500; 2005: $85,970; 2006: $0.
Biggest contracts:
$143,325 with Air Force for Packing/Crating Services. Signed on 2003-02-27. Completion date: 2003-12-31.
$130,000, same as above.Signed on 2001-09-19. Completion date: 2001-12-31.
$85,970, same as above.Signed on 2005-12-06. Completion date: 2006-09-30.
$75,000, same as above.Signed on 2004-01-01. Completion date: 2004-04-30.
CANOVA MVG & STOR CO YUBA CY (717 BRIDGE ST; small business) : $602,997 in 3 contractsfrom 2001 to 2002
$302,047 with Air Force for Packing/Crating Services. Signed on 2002-01-16. Completion date: 2002-12-31.
$190,975, same as above.Signed on 2001-09-19. Completion date: 2001-12-31.
$109,975, same as above.Signed on 2001-09-19. Completion date: 2001-12-31.
PEPSI-COLA BOTTLING CO OF YUBA (750 SUTTER ST; small business) : $336,124 in 5 contractsfrom 2004 to 2005
Contracts for Food Items For Resale, Non-Food Items For Resale by Defense Commissary Agency Signed by year:2000: $0; 2001: $0; 2002: $0; 2003: $0; 2004: $74,657; 2005: $261,467; 2006: $0.
Biggest contracts:
$125,303 with Defense Commissary Agency for Food Items For Resale. Signed on 2005-04-01. Completion date: 2005-08-31.
$74,657, same as above.Signed on 2004-10-01. Completion date: 2005-02-28.
$64,087 with Defense Commissary Agency for Non-Food Items For Resale. Signed on 2005-10-01. Completion date: 2005-12-31.
$38,835 with Defense Commissary Agency for Food Items For Resale. Signed on 2005-01-01. Completion date: 2005-03-31.
JETSTREAM ENGINEERING INC (301D BURNS DR UNIT 2; small business) : $40,822 in 2 contractsin 2005
$20,411 with Army for ADP Central Processing Unit (CPU, Computer), Analog. Signed on 2005-09-20. Completion date: 2005-09-30.
$20,411 with U.S. Army Corps of Engineers - civil program financing only for ADP Central Processing Unit (CPU, Computer), Analog. Signed on 2005-09-20. Completion date: 2005-09-30.
BEELER, H R TRACTOR & EQUIPMEN (887 E ONSTOTT RD; small business)
$31,998 with Air Force for Tractors, Wheeled. Signed on 2006-06-22. Completion date: 2006-09-20.
R B SPENCER INC (1188 HASSETT AVE; small business) : $23,870 in 6 contractsfrom 2002 to 2005
Contracts for Purchase of Structures and Facilities -- Heating and Cooling Plants, Maintenance, Repair and Rebuilding of Equipment -- Refrigeration, Air Conditioning, and Air Circulating Equipment by Army, U.S. Army Corps of Engineers - civil program financing only, Bureau of Reclamation Signed by year:2000: $0; 2001: $0; 2002: $6,000; 2003: $0; 2004: $0; 2005: $17,870; 2006: $0.
Biggest contracts:
$5,012 with Army for Purchase of Structures and Facilities -- Heating and Cooling Plants. Signed on 2005-08-25. Completion date: 2005-09-30.
$5,012 with U.S. Army Corps of Engineers - civil program financing only for Purchase of Structures and Facilities -- Heating and Cooling Plants. Signed on 2005-08-25. Completion date: 2005-09-30.
$4,000 with Bureau of Reclamation for Maintenance, Repair and Rebuilding of Equipment -- Refrigeration, Air Conditioning, and Air Circulating Equipment. Signed on 2002-03-15. Completion date: 2002-04-15.
$3,923 with U.S. Army Corps of Engineers - civil program financing only for Purchase of Structures and Facilities -- Heating and Cooling Plants. Signed on 2005-08-25. Completion date: 2005-09-30.
YUBA CITY UNIFIED SCHOOL DISTR (750 N PALORA AVE)
$21,600 with Air Force for Motor Passenger Services. Signed on 2006-05-25. Completion date: 2006-06-04.
COUNTY OF SUTTER (275 SAMUEL DR; small business) : $19,712 in 2 contractsfrom 2004 to 2005
$15,143 with Air Force for Maintenance, Repair and Rebuilding of Equipment -- Vehicular Equipment Components. Signed on 2004-10-01. Completion date: 2005-09-30.
$4,569 with Air Force for Vehicular Furniture and Accessories. Signed on 2005-11-14. Completion date: 2005-12-14.
CARL E HALL (988 LOS BRAVOS; small business) : $15,710 in 5 contractsfrom 2002 to 2004
Contracts for Construction of Structures and Facilities -- Other Utilities, Maintenance, Repair or Alteration of Real Property -- Other Non-Building Facilities by U.S. Army Corps of Engineers - civil program financing only, Army Signed by year:2000: $0; 2001: $0; 2002: $5,506; 2003: $0; 2004: $10,204; 2005: $0; 2006: $0.
Biggest contracts:
$5,506 with U.S. Army Corps of Engineers - civil program financing only for Construction of Structures and Facilities -- Other Utilities. Signed on 2002-09-27. Completion date: 2002-10-04.
$3,992 with Army for Maintenance, Repair or Alteration of Real Property -- Other Non-Building Facilities. Signed on 2004-09-14. Completion date: 2004-10-29.
$3,992 with U.S. Army Corps of Engineers - civil program financing only for Maintenance, Repair or Alteration of Real Property -- Other Non-Building Facilities. Signed on 2004-09-14. Completion date: 2004-10-29.
$1,110 with Army for Maintenance, Repair or Alteration of Real Property -- Other Non-Building Facilities. Signed on 2004-09-16. Completion date: 2004-10-29.
BONANZA OVERHAD DOOR SUPPLY (1306 HASSETT AVE STE F; small business)
$9,736 with Air Force for Maintenance, Repair or Alteration of Real Property -- Other Administrative Facilities and Service Buildings. Signed on 2001-09-29. Completion date: 2001-08-26.
Top industries in this zip code by the number of employees in 2005:
Health Care and Social Assistance: Offices of Physicians (except Mental Health Specialists) (100-249: 1, 50-99: 2, 20-49: 7, 10-19: 2, 5-9: 20, 1-4: 28)
Health Care and Social Assistance: General Medical and Surgical Hospitals (500-999: 1)
Administrative and Support and Waste Management and Remediation Services: Landscaping Services (250-499: 1, 20-49: 1, 10-19: 1, 5-9: 2, 1-4: 8)
Health Care and Social Assistance: Nursing Care Facilities (100-249: 2, 50-99: 1, 20-49: 1)
2005 - 2018 National Fire Incident Reporting System (NFIRS) incidents
Based on the data from the years 2005 - 2018 the average number of fire incidents per year is 241. The highest number of fires - 385 took place in 2007, and the least - 57 in 2015. The data has a decreasing trend.
When looking into fire subcategories, the most incidents belonged to: Outside Fires (47.7%), and Structure Fires (32.2%).
Fire incident types reported to NFIRS in Zip Code 95991
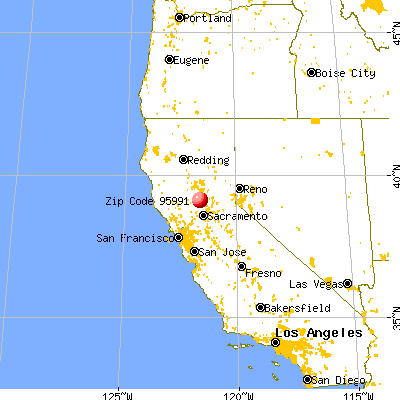


 Nearest zip codes: 95961, 95993, 95674, 95659, 95692, 95668.


 Based on the data from the years 2005 - 2018 the average number of fire incidents per year is 241. The highest number of fires - 385 took place in 2007, and the least - 57 in 2015. The data has a decreasing trend.
 When looking into fire subcategories, the most incidents belonged to: Outside Fires (47.7%), and Structure Fires (32.2%).