Estimated zip code population in 2022: 11,360 Zip code population in 2010: 10,810 Zip code population in 2000: 9,747
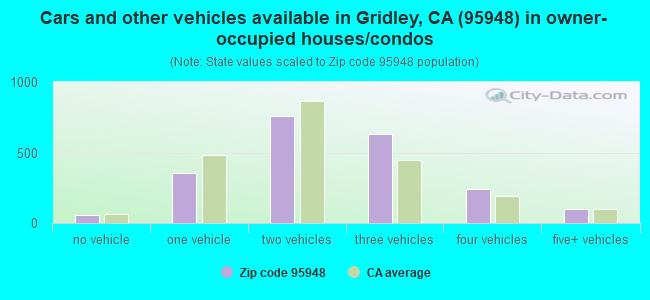
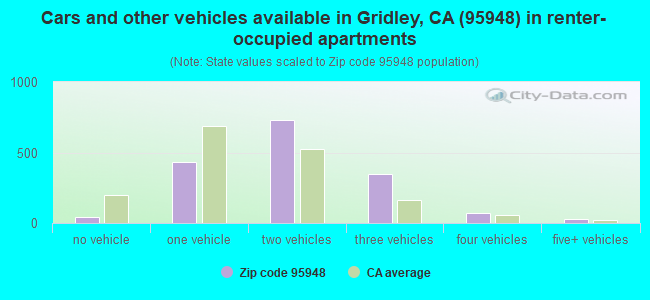
Houses and condos: 4,298 Renter-occupied apartments: 1,659
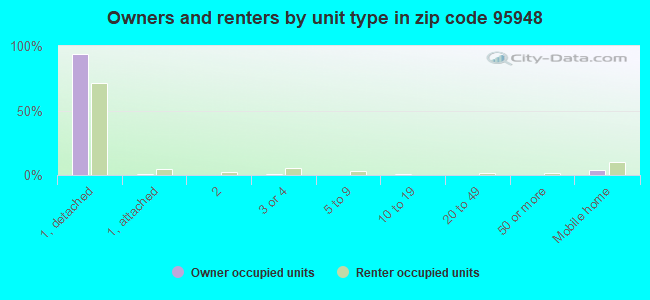
% of renters here:
43%
State:
44%
March 2022 cost of living index in zip code 95948: 95.1 (less than average, U.S. average is 100)
Land area: 78.0 sq. mi. Water area: 0.3 sq. mi.
Population density: 146 people per square mile
(very low).
OSM Map
General Map
Google Map
MSN Map
OSM Map
General Map
Google Map
MSN Map
OSM Map
General Map
Google Map
MSN Map
OSM Map
General Map
Google Map
MSN Map
Please wait while loading the map...
Real estate property taxes paid for housing units in 2022:
This zip code:
0.7% ($2,384)
California:
0.7% ($4,831)
Median real estate property taxes paid for housing units with mortgages in 2022: $2,619 (0.7%) Median real estate property taxes paid for housing units with no mortgage in 2022: $2,048 (0.6%)
Averages for the 2020 tax year for zip code 95948, filed in 2021:
Average Adjusted Gross Income (AGI) in 2020: $56,172 (Individual Income Tax Returns)
Here:
$56,172
State:
$95,910
Salary/wage: $46,558 (reported on 83.6% of returns)
Here:
$46,558
State:
$77,331
(% of AGI for various income ranges: 1511.9% for AGIs below $25k, 4469.4% for AGIs $25k-50k, 7912.0% for AGIs $50k-75k, 11223.5% for AGIs $75k-100k, 20151.9% for AGIs $100k-200k, 61996.7% for AGIs over 200k)
Taxable interest for individuals: $1,125 (reported on 28.1% of returns)
This zip code:
$1,125
California:
$2,294
(% of AGI for various income ranges: 11.8% for AGIs below $25k, 20.6% for AGIs $25k-50k, 42.4% for AGIs $50k-75k, 61.9% for AGIs $75k-100k, 137.4% for AGIs $100k-200k, 1866.7% for AGIs over 200k)
Ordinary dividends: $12,116 (reported on 9.7% of returns)
Here:
$12,116
State:
$10,949
(% of AGI for various income ranges: 14.8% for AGIs below $25k, 27.7% for AGIs $25k-50k, 69.8% for AGIs $50k-75k, 55.8% for AGIs $75k-100k, 534.8% for AGIs $100k-200k, 12356.7% for AGIs over 200k)
Net capital gain/loss in AGI: +$21,880 (reported on 9.7% of returns)
Here:
+$21,880
State:
+$49,306
(% of AGI for various income ranges: 19.3% for AGIs below $25k, 26.5% for AGIs $25k-50k, 65.5% for AGIs $50k-75k, 151.5% for AGIs $75k-100k, 610.7% for AGIs $100k-200k, 27073.3% for AGIs over 200k)
Profit/loss from business: +$14,892 (reported on 12.3% of returns)
Here:
+$14,892
State:
+$15,671
(% of AGI for various income ranges: 72.6% for AGIs below $25k, 151.6% for AGIs $25k-50k, 240.2% for AGIs $50k-75k, 309.2% for AGIs $75k-100k, 813.3% for AGIs $100k-200k, 9976.7% for AGIs over 200k)
Taxable individual retirement arrangement distribution: $13,665 (reported on 5.1% of returns)
95948:
$13,665
California:
$23,505
(% of AGI for various income ranges: 29.6% for AGIs below $25k, 42.4% for AGIs $25k-50k, 96.7% for AGIs $50k-75k, 247.3% for AGIs $75k-100k, 638.1% for AGIs $100k-200k)
Total itemized deductions: $30,282 (reported on 6.4% of returns)
Here:
$30,282
State:
$39,517
(% of AGI for various income ranges: 133.1% for AGIs $25k-50k, 302.9% for AGIs $50k-75k, 464.2% for AGIs $75k-100k, 1299.6% for AGIs $100k-200k, 8340.0% for AGIs over 200k)
Charity contributions: $10,496 (reported on 4.5% of returns)
Here:
$10,496
State:
$12,598
(% of AGI for various income ranges: 11.4% for AGIs $25k-50k, 34.3% for AGIs $50k-75k, 66.5% for AGIs $75k-100k, 285.6% for AGIs $100k-200k, 3970.0% for AGIs over 200k)
Taxes paid: $7,482 (reported on 6.4% of returns)
95948:
$7,482
State:
$8,807
(% of AGI for various income ranges: 26.2% for AGIs $25k-50k, 73.5% for AGIs $50k-75k, 148.5% for AGIs $75k-100k, 374.1% for AGIs $100k-200k, 1530.0% for AGIs over 200k)
Earned income credit: $2,123 (reported on 18.3% of returns)
Here:
$2,123
State:
$2,074
(% of AGI for various income ranges: 107.2% for AGIs below $25k, 91.5% for AGIs $25k-50k, 3.1% for AGIs $50k-75k)
Percentage of individuals using paid preparers for their 2020 taxes: 92.2%
Here:
92%
State:
92%
(% for various income ranges: 90.9% for AGIs below $25k, 92.1% for AGIs $25k-50k, 92.7% for AGIs $50k-75k, 95.6% for AGIs $75k-100k, 92.9% for AGIs $100k-200k, 92.9% for AGIs over 200k)
Averages for the 2012 tax year for zip code 95948, filed in 2013:
Average Adjusted Gross Income (AGI) in 2012: $44,751 (Individual Income Tax Returns)
Here:
$44,751
State:
$72,726
Salary/wage: $35,330 (reported on 84.9% of returns)
Here:
$35,330
State:
$59,079
(% of AGI for various income ranges: 76.3% for AGIs below $25k, 77.7% for AGIs $25k-50k, 75.4% for AGIs $50k-75k, 72.6% for AGIs $75k-100k, 67.0% for AGIs $100k-200k, 27.4% for AGIs over 200k)
Taxable interest for individuals: $1,380 (reported on 29.7% of returns)
This zip code:
$1,380
California:
$2,146
(% of AGI for various income ranges: 1.0% for AGIs below $25k, 0.5% for AGIs $25k-50k, 0.5% for AGIs $50k-75k, 0.7% for AGIs $75k-100k, 0.9% for AGIs $100k-200k, 2.2% for AGIs over 200k)
Ordinary dividends: $3,347 (reported on 11.4% of returns)
Here:
$3,347
State:
$9,308
(% of AGI for various income ranges: 0.8% for AGIs below $25k, 0.4% for AGIs $25k-50k, 0.8% for AGIs $50k-75k, 0.8% for AGIs $75k-100k, 1.3% for AGIs $100k-200k, 1.0% for AGIs over 200k)
Net capital gain/loss in AGI: +$10,385 (reported on 9.3% of returns)
Here:
+$10,385
State:
+$30,460
(% of AGI for various income ranges: 0.1% for AGIs below $25k, 0.4% for AGIs $25k-50k, 0.2% for AGIs $50k-75k, 0.6% for AGIs $75k-100k, 1.6% for AGIs $100k-200k, 11.1% for AGIs over 200k)
Profit/loss from business: +$11,714 (reported on 13.0% of returns)
Here:
+$11,714
State:
+$17,064
(% of AGI for various income ranges: 5.5% for AGIs below $25k, 3.0% for AGIs $25k-50k, 2.7% for AGIs $50k-75k, 1.1% for AGIs $75k-100k, 3.8% for AGIs $100k-200k, 4.3% for AGIs over 200k)
Taxable individual retirement arrangement distribution: $10,997 (reported on 6.7% of returns)
95948:
$10,997
California:
$19,557
(% of AGI for various income ranges: 1.3% for AGIs below $25k, 1.3% for AGIs $25k-50k, 2.2% for AGIs $50k-75k, 1.6% for AGIs $75k-100k, 2.1% for AGIs $100k-200k, 1.4% for AGIs over 200k)
Self-employment retirement plans: $19,867 (reported on 0.7% of returns)
95948:
$19,867
California:
$24,530
Total itemized deductions: $22,053 (24% of AGI, reported on 25.3% of returns)
Here:
$22,053
State:
$34,004
Here:
23.6% of AGI
State:
22.7% of AGI
(% of AGI for various income ranges: 6.0% for AGIs below $25k, 8.8% for AGIs $25k-50k, 14.0% for AGIs $50k-75k, 16.6% for AGIs $75k-100k, 17.0% for AGIs $100k-200k, 12.0% for AGIs over 200k)
Charity contributions: $3,583 (reported on 20.0% of returns)
Here:
$3,583
State:
$4,659
(% of AGI for various income ranges: 0.5% for AGIs below $25k, 0.9% for AGIs $25k-50k, 1.4% for AGIs $50k-75k, 2.1% for AGIs $75k-100k, 2.5% for AGIs $100k-200k, 2.3% for AGIs over 200k)
Taxes paid: $7,050 (reported on 25.3% of returns)
95948:
$7,050
State:
$14,448
(% of AGI for various income ranges: 1.2% for AGIs below $25k, 1.5% for AGIs $25k-50k, 3.2% for AGIs $50k-75k, 4.4% for AGIs $75k-100k, 6.5% for AGIs $100k-200k, 7.4% for AGIs over 200k)
Earned income credit: $2,319 (reported on 25.5% of returns)
Here:
$2,319
State:
$2,286
(% of AGI for various income ranges: 7.3% for AGIs below $25k, 1.6% for AGIs $25k-50k)
Percentage of individuals using paid preparers for their 2012 taxes: 67.1%
Here:
67%
State:
64%
(% for various income ranges: 61.5% for AGIs below $25k, 72.5% for AGIs $25k-50k, 70.4% for AGIs $50k-75k, 69.0% for AGIs $75k-100k, 69.0% for AGIs $100k-200k, 85.7% for AGIs over 200k)
Averages for the 2004 tax year for zip code 95948, filed in 2005:
Average Adjusted Gross Income (AGI) in 2004: $33,353 (Individual Income Tax Returns)
Here:
$33,353
State:
$58,600
Salary/wage: $29,456 (reported on 84.2% of returns)
Here:
$29,456
State:
$49,455
(% of AGI for various income ranges: 78.0% for AGIs $10k-25k, 82.4% for AGIs $25k-50k, 76.4% for AGIs $50k-75k, 69.7% for AGIs $75k-100k, 48.3% for AGIs over 100k)
Taxable interest for individuals: $1,909 (reported on 33.8% of returns)
This zip code:
$1,909
California:
$2,365
(% of AGI for various income ranges: 1.3% for AGIs $10k-25k, 0.9% for AGIs $25k-50k, 1.2% for AGIs $50k-75k, 2.2% for AGIs $75k-100k, 3.5% for AGIs over 100k)
Taxable dividends: $2,212 (reported on 15.3% of returns)
Here:
$2,212
State:
$4,746
(% of AGI for various income ranges: 0.7% for AGIs $10k-25k, 0.6% for AGIs $25k-50k, 0.5% for AGIs $50k-75k, 1.0% for AGIs $75k-100k, 1.9% for AGIs over 100k)
Net capital gain/loss: +$13,664 (reported on 12.8% of returns)
Here:
+$13,664
State:
+$23,418
(% of AGI for various income ranges: 0.5% for AGIs $10k-25k, 0.7% for AGIs $25k-50k, 1.0% for AGIs $50k-75k, 1.4% for AGIs $75k-100k, 20.9% for AGIs over 100k)
Profit/loss from business: +$11,002 (reported on 11.8% of returns)
Here:
+$11,002
State:
+$16,826
(% of AGI for various income ranges: 4.3% for AGIs $10k-25k, 2.8% for AGIs $25k-50k, 2.8% for AGIs $50k-75k, 4.9% for AGIs $75k-100k, 5.3% for AGIs over 100k)
IRA payment deduction: $3,163 (reported on 2.3% of returns)
95948:
$3,163
California:
$3,192
(% of AGI for various income ranges: 0.2% for AGIs $10k-25k, 0.2% for AGIs $25k-50k, 0.2% for AGIs $50k-75k, 0.3% for AGIs $75k-100k, 0.2% for AGIs over 100k)
Self-employed pension: $9,176 (reported on 0.4% of returns)
Here:
$9,176
California:
$17,688
Total itemized deductions: $18,392 (29% of AGI, reported on 26.7% of returns)
Here:
$18,392
State:
$28,113
Here:
28.7% of AGI
State:
25.3% of AGI
(% of AGI for various income ranges: 8.9% for AGIs $10k-25k, 11.3% for AGIs $25k-50k, 17.1% for AGIs $50k-75k, 17.2% for AGIs $75k-100k, 18.0% for AGIs over 100k)
Charity contributions deductions: $3,002 (4% of AGI, reported on 22.4% of returns)
Here:
$3,002
State:
$3,923
Here:
4.4% of AGI
State:
3.3% of AGI
(% of AGI for various income ranges: 0.7% for AGIs $10k-25k, 1.1% for AGIs $25k-50k, 2.3% for AGIs $50k-75k, 2.3% for AGIs $75k-100k, 3.7% for AGIs over 100k)
Total tax: $4,463 (reported on 62.0% of returns)
95948:
$4,463
State:
$10,761
(% of AGI for various income ranges: 3.1% for AGIs $10k-25k, 5.3% for AGIs $25k-50k, 7.8% for AGIs $50k-75k, 11.0% for AGIs $75k-100k, 14.7% for AGIs over 100k)
Earned income credit: $1,780 (reported on 23.3% of returns)
Here:
$1,780
State:
$1,763
Percentage of individuals using paid preparers for their 2004 taxes: 69.8%
Here:
70%
State:
66%
(% for various income ranges: 62.5% for AGIs below $10k, 72.3% for AGIs $10k-25k, 69.4% for AGIs $25k-50k, 68.8% for AGIs $50k-75k, 74.5% for AGIs $75k-100k, 84.6% for AGIs over 100k)
Household received Food Stamps/SNAP in the past 12 months: 698 Household did not receive Food Stamps/SNAP in the past 12 months: 3,162
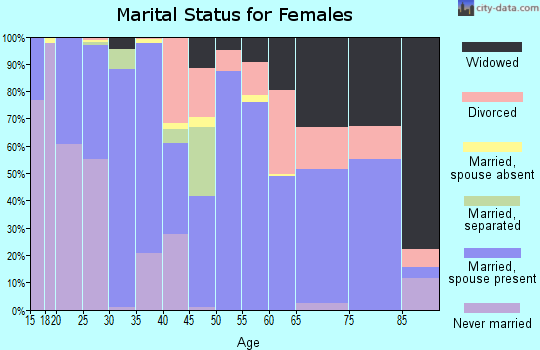
Women who had a birth in the past 12 months: 252 (189 now married, 62 unmarried) Women who did not have a birth in the past 12 months: 2,386 (1,248 now married, 1,125 unmarried)
Housing units in zip code 95948 with a mortgage: 1,399 (89 second mortgage, 50 both second mortgage and home equity loan) Houses without a mortgage: 62
Median monthly owner costs for units with a mortgage: $1,548 Median monthly owner costs for units without a mortgage: $545
Residents with income below the poverty level in 2022:
This zip code:
9.0%
Whole state:
12.2%
Residents with income below 50% of the poverty level in 2022:
This zip code:
7.3%
Whole state:
6.2%
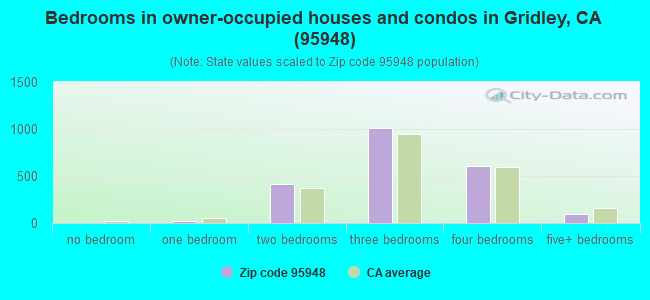
Median number of rooms in houses and condos:
Here:
6.3
State:
6.0
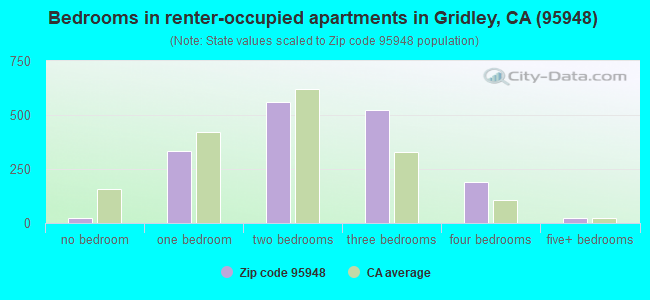
Median number of rooms in apartments:
Here:
4.8
State:
3.9
Notable locations in this zip code not listed on our city pages
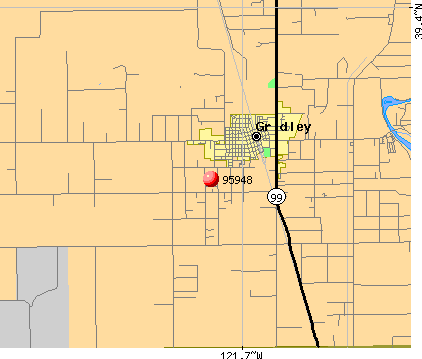
Notable locations in zip code 95948: Hangtown Gun Club (A), Wild Goose Country Club (B), Tule Goose Gun Club (C), Sanborn Slough Gun Club (D), Butte County Fairgrounds (E), Oroville Gun Club (F), Gridley City Hall (G), Gridley Branch Butte County Library (H), Gridley City Volunteer Fire Department Station 76 (I), Butte County Fire Department Station 77 (J), Butte County Fire Department Station 74 (K), Manzanita Fire Station (L). Display/hide their locations on the map
Churches in zip code 95948 include: Calvary Baptist Church (A), Calvary Chapel of Gridley (B), Church of the Nazarene (C), First Baptist Church (D), First Church of Christ Scientist (E), First Presbyterian Church (F), Grace Lutheran Church (G), Gridley Christian Church (H), Iglesia Gentil De Cristo (I). Display/hide their locations on the map
Parks in zip code 95948 include: Gray Lodge Waterfowl Management Area (1), Manuel Vierra Park (2), Nick Daddow Plaza (3). Display/hide their locations on the map
In group quarters: 178 (-1 institutionalized population)
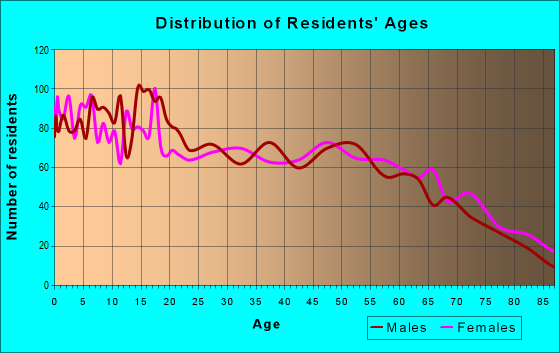
Size of family households: 1,054 2-persons, 528 3-persons, 527 4-persons, 420 5-persons, 239 6-persons, 65 7-or-more-persons
Size of nonfamily households: 862 1-person, 104 2-persons
2,582 married couples with children.
485 single-parent households (61 men, 424 women).
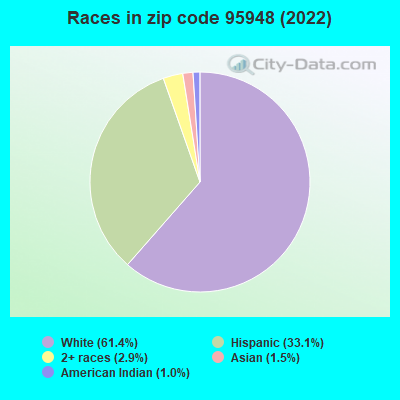
74.4% of residents of 95948 zip code speak English at home.
23.6% of residents speak Spanish at home (58% very well, 25% well, 12% not well, 5% not at all).
0.7% of residents speak other Indo-European language at home (72% very well, 24% well, 4% not well).
0.8% of residents speak Asian or Pacific Island language at home (45% very well, 30% well, 20% not well, 5% not at all).
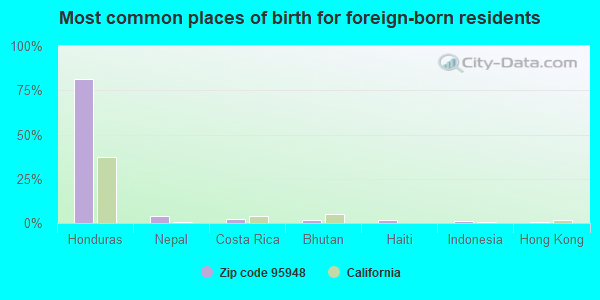
Foreign born population: 1,361 (12.0%) (41.8% of them are naturalized citizens)
This zip code:
12.0%
Whole state:
26.7%
82%Honduras
4%Nepal
2%Costa Rica
2%Bhutan
2%Haiti
1%Indonesia
1%Hong Kong
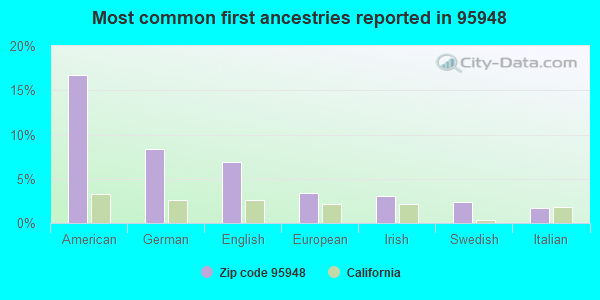
17%American
8%German
7%English
3%European
3%Irish
2%Swedish
2%Italian
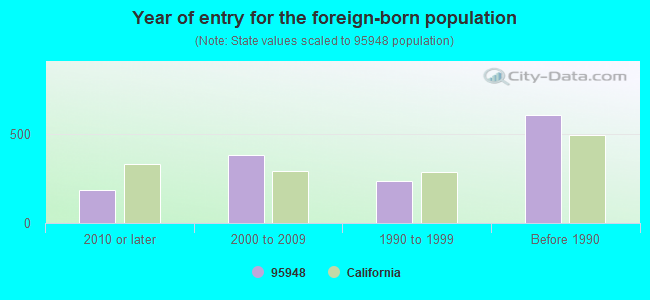
Year of entry for the foreign-born population
1892010 or later
3822000 to 2009
2361990 to 1999
610Before 1990
Major facilities with environmental interests located in this zip code:
ESPERANZA HIGH (CONT) (300 E. SPRUCE ST. in GRIDLEY, CA)
(National Center for Education Statistics) - STATE ID-0433946 (National Center for Education Statistics) - STATE ID-0433953 Organizations: GRIDLEY UNIFIED (SCHOOL DISTRICT)
GRIDLEY COUNTRY FORD MERCURY (1709 HWY 99 in GRIDLEY, CA)
STATE MASTER (California - Hazardous Waste Tracking) - HAZARDOU WASTE PROGRAM Small Quantity Generators, between 100 kg and 1000 kg of hazardous waste/month (Resource Conservation and Recovery Act (tracking hazardous waste)) - notification Organizations: GRIDLEY COUNTRY FORD MERCURY CORP (CONTACT/OWNER)
EQUILON ENTERPRISES (1653 HWY 99 E in GRIDLEY, CA) . Federal Facility
STATE MASTER (California - Hazardous Waste Tracking) - HAZARDOU WASTE PROGRAM Small Quantity Generators, between 100 kg and 1000 kg of hazardous waste/month (Resource Conservation and Recovery Act (tracking hazardous waste)) - notification Organizations: EQUILON ENTERPRISES, LLC (CONTACT/OWNER)
Alternative names: SHELL OIL CO
GRIDLEY UNIFIED COMMUNITY DAY (1-6) (429 MAGNOLIA ST. in GRIDLEY, CA)
(National Center for Education Statistics) - STATE ID-6116016
GRIDLEY UNIFIED COMMUNITY DAY (7-12) (429 MAGNOLIA ST. in GRIDLEY, CA)
(National Center for Education Statistics) - STATE ID-0430157
MANZANITA ELEMENTARY (627 E. EVANS-REIMER ROAD in GRIDLEY, CA)
(National Center for Education Statistics) - STATE ID-6003198
MCKINLEY ELEMENTARY (1045 SYCAMORE ST. in GRIDLEY, CA)
(National Center for Education Statistics) - STATE ID-6003156 Organizations: GRIDLEY UNIFIED (SCHOOL DISTRICT)
CALIFORNIA OLIVE RANCH (LONE TREE AND CENTRAL HOUSE ROADS in GRIDLEY, CA)
(Integrated Compliance Information System) - ICIS-09-2002-0051, FORMAL ENFORCEMENT ACTION, ICIS-09-2004-0379, ENFORCEMENT/COMPLIANCE ACTIVITY Business SIC classification: GRAPES
JOHN TAYLOR FERTILIZER COMPANY INCORPORATED GRIDLEY (557 ORD RANCH RD. in GRIDLEY, CA)
COMPLIANCE ACTIVITY (Tracking inspections of insecticide, fungicide, and rodenticide, and toxic substances) Small Quantity Generators, between 100 kg and 1000 kg of hazardous waste/month (Resource Conservation and Recovery Act (tracking hazardous waste)) Business NAICS classification: SOIL PREPARATION, PLANTING, AND CULTIVATING. Alternative names: JOHN TAYLOR FERTILIZER GRIDLEY, TAYLOR JOHN-GRIDLEY
FRANCIS & WALTERS TRUCKING (HWY 99E & LIBERTY RD in GRIDLEY, CA)
Small Quantity Generators, between 100 kg and 1000 kg of hazardous waste/month (Resource Conservation and Recovery Act (tracking hazardous waste)) - notification Organizations: FRANCES & WALTERS (CONTACT/OWNER)
GRIDLEY AUTOMOTIVE MACHINE (852 WASHINGTON in GRIDLEY, CA)
Small Quantity Generators, between 100 kg and 1000 kg of hazardous waste/month (Resource Conservation and Recovery Act (tracking hazardous waste)) Organizations: RICHARD CARDOZA ET AL (CONTACT/OWNER)
GRIDLEY GROWERS INC (700 HAZEL ST in GRIDLEY, CA)
Small Quantity Generators, between 100 kg and 1000 kg of hazardous waste/month (Resource Conservation and Recovery Act (tracking hazardous waste)) - notification Business NAICS classification: ALL OTHER MISCELLANEOUS STORE RETAILERS (EXCEPT TOBACCO STORES).
GRIDLEY PIT STOP (1344 HWY 99 in GRIDLEY, CA)
National Pollutant Discharge Elimination System NON-MAJOR (Tracking pollutant discharge elimination systems) - permit
Housing units lacking complete plumbing facilities: 2.0% Housing units lacking complete kitchen facilities: 3.1%
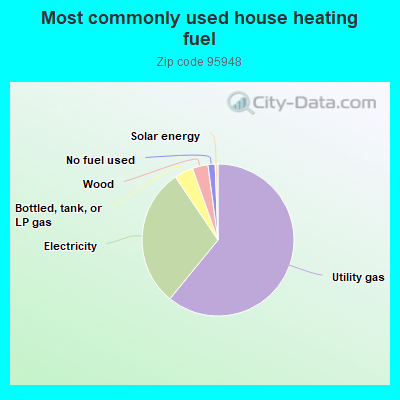
60.6%Utility gas
29.5%Electricity
4.0%Bottled, tank, or LP gas
3.3%Wood
1.5%No fuel used
0.6%Solar energy
Population in 1990: 9,499. Population change in the 1990s: +248 (+2.6%).
Place of birth for U.S.-born residents:
This state: 8,710
Northeast: 127
Midwest: 369
South: 315
West: 399
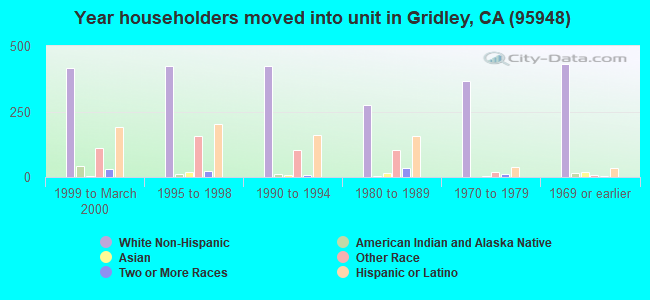
61% of the 95948 zip code residents lived in the same house 5 years ago. Out of people who lived in different houses, 66% lived in this county. Out of people who lived in different counties, 50% lived in California.
92% of the 95948 zip code residents lived in the same house 1 year ago. Out of people who lived in different houses, 75% moved from this county. Out of people who lived in different houses, 21% moved from different county within same state. Out of people who lived in different houses, 2% moved from different state.
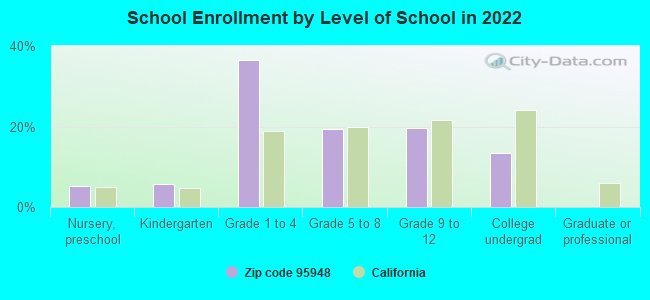
Private vs. public school enrollment:
Students in private schools in grades 1 to 8 (elementary and middle school): 93
Here:
5.3%
California:
10.5%
Students in private schools in grades 9 to 12 (high school): 25
Here:
4.1%
California:
8.5%
Students in private undergraduate colleges: 43
Here:
10.0%
California:
15.9%
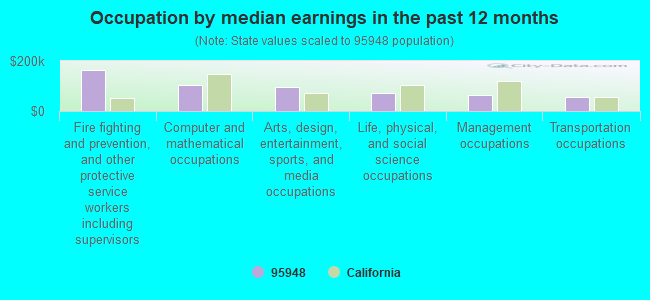
Occupation by median earnings in the past 12 months ($)
164,593Fire fighting and prevention, and other protective service workers including supervisors
103,433Computer and mathematical occupations
94,504Arts, design, entertainment, sports, and media occupations
70,044Life, physical, and social science occupations
62,138Management occupations
57,587Transportation occupations
Top industries in this zip code by the number of employees in 2005:
Health Care and Social Assistance: General Medical and Surgical Hospitals (100-249 employees: 1 establishment)
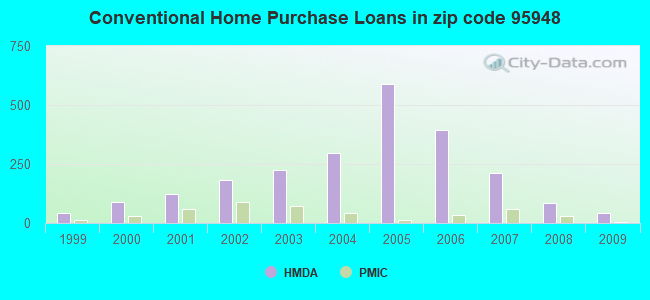
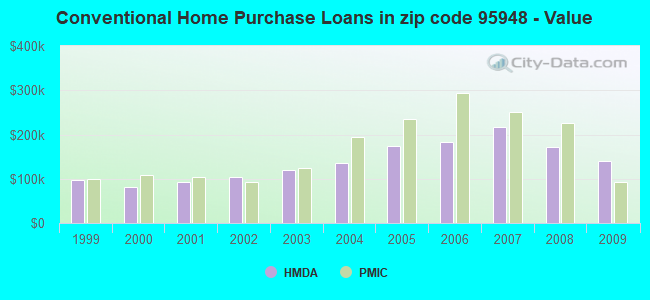
Detailed PMIC statistics for the following Tracts:0034.00
, 0035.00
2003 - 2018 National Fire Incident Reporting System (NFIRS) incidents
Based on the data from the years 2003 - 2018 the average number of fire incidents per year is 52. The highest number of reported fire incidents - 77 took place in 2003, and the least - 1 in 2004. The data has a decreasing trend.
When looking into fire subcategories, the most reports belonged to: Outside Fires (54.2%), and Structure Fires (27.4%).
Fire incident types reported to NFIRS in Zip Code 95948
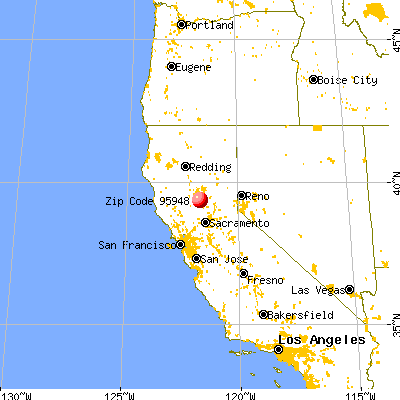


 Nearest zip codes: 95917, 95953, 95974, 95982, 95920, 95932.
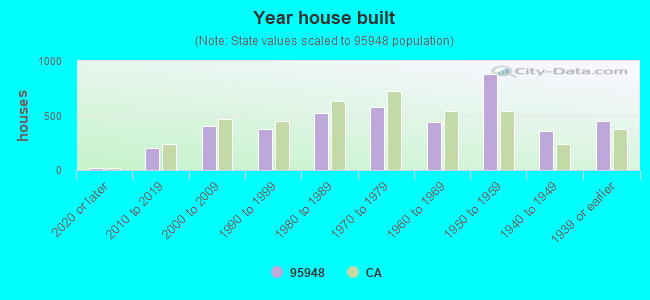


 Based on the data from the years 2003 - 2018 the average number of fire incidents per year is 52. The highest number of reported fire incidents - 77 took place in 2003, and the least - 1 in 2004. The data has a decreasing trend.
 When looking into fire subcategories, the most reports belonged to: Outside Fires (54.2%), and Structure Fires (27.4%).