Estimated zip code population in 2022: 38,004 Zip code population in 2010: 31,957 Zip code population in 2000: 26,954
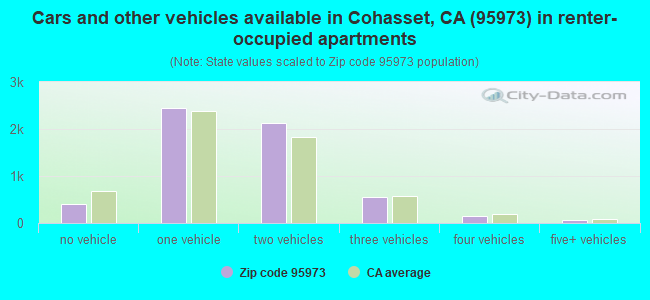
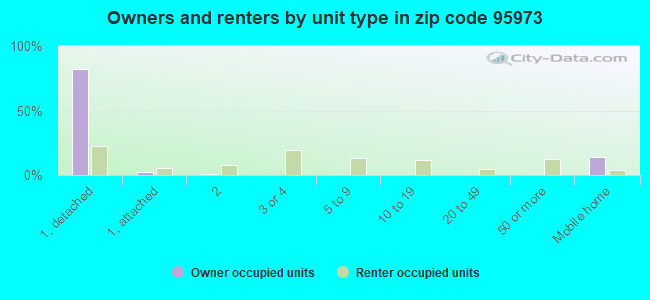
Houses and condos: 16,297 Renter-occupied apartments: 5,762
% of renters here:
37%
State:
44%
March 2022 cost of living index in zip code 95973: 96.0 (near average, U.S. average is 100)
Land area: 332.8 sq. mi. Water area: 1.9 sq. mi.
Population density: 114 people per square mile
(very low).
OSM Map
General Map
Google Map
MSN Map
OSM Map
General Map
Google Map
MSN Map
OSM Map
General Map
Google Map
MSN Map
OSM Map
General Map
Google Map
MSN Map
Please wait while loading the map...
Real estate property taxes paid for housing units in 2022:
This zip code:
0.7% ($3,771)
California:
0.7% ($4,831)
Median real estate property taxes paid for housing units with mortgages in 2022: $4,316 (0.8%) Median real estate property taxes paid for housing units with no mortgage in 2022: $2,644 (0.6%)
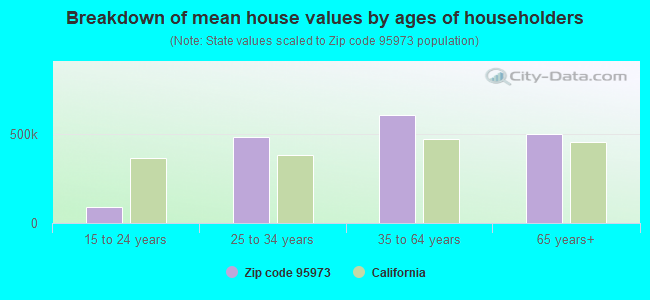
Estimated median house/condo value in 2022: $504,268
95973:
$504,268
California:
$715,900
According to our research of California and other state lists, there were 56 registered sex offenders living in 95973 zip code as of April 27, 2024. The ratio of all residents to sex offenders in zip code 95973 is 639 to 1. The ratio of registered sex offenders to all residents in this zip code is near the state average.
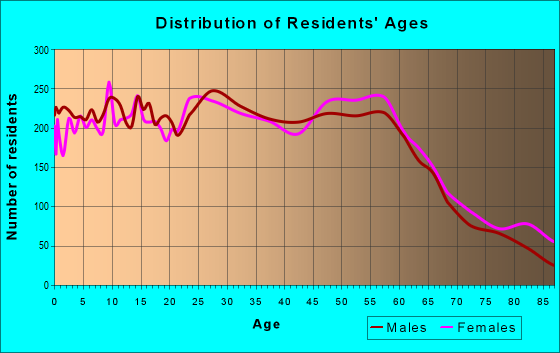
Median resident age:
This zip code:
38.1 years
California median age:
37.9 years
Average household size:
This zip code:
2.4 people
California:
2.8 people
Averages for the 2020 tax year for zip code 95973, filed in 2021:
Average Adjusted Gross Income (AGI) in 2020: $76,932 (Individual Income Tax Returns)
Here:
$76,932
State:
$95,910
Salary/wage: $62,855 (reported on 78.9% of returns)
Here:
$62,855
State:
$77,331
(% of AGI for various income ranges: 1264.1% for AGIs below $25k, 3819.2% for AGIs $25k-50k, 7004.7% for AGIs $50k-75k, 10100.8% for AGIs $75k-100k, 19621.8% for AGIs $100k-200k, 66674.6% for AGIs over 200k)
Taxable interest for individuals: $1,435 (reported on 40.1% of returns)
This zip code:
$1,435
California:
$2,294
(% of AGI for various income ranges: 20.3% for AGIs below $25k, 34.2% for AGIs $25k-50k, 51.2% for AGIs $50k-75k, 125.6% for AGIs $75k-100k, 180.4% for AGIs $100k-200k, 1224.6% for AGIs over 200k)
Ordinary dividends: $8,079 (reported on 21.1% of returns)
Here:
$8,079
State:
$10,949
(% of AGI for various income ranges: 42.0% for AGIs below $25k, 67.1% for AGIs $25k-50k, 105.5% for AGIs $50k-75k, 225.6% for AGIs $75k-100k, 371.4% for AGIs $100k-200k, 5888.2% for AGIs over 200k)
Net capital gain/loss in AGI: +$16,661 (reported on 20.2% of returns)
Here:
+$16,661
State:
+$49,306
(% of AGI for various income ranges: 10.9% for AGIs below $25k, 31.4% for AGIs $25k-50k, 102.0% for AGIs $50k-75k, 232.4% for AGIs $75k-100k, 666.2% for AGIs $100k-200k, 15305.0% for AGIs over 200k)
Profit/loss from business: +$24,131 (reported on 16.5% of returns)
Here:
+$24,131
State:
+$15,671
(% of AGI for various income ranges: 126.6% for AGIs below $25k, 204.4% for AGIs $25k-50k, 337.2% for AGIs $50k-75k, 635.7% for AGIs $75k-100k, 1256.3% for AGIs $100k-200k, 9913.6% for AGIs over 200k)
Taxable individual retirement arrangement distribution: $19,518 (reported on 9.0% of returns)
95973:
$19,518
California:
$23,505
(% of AGI for various income ranges: 55.3% for AGIs below $25k, 105.6% for AGIs $25k-50k, 232.1% for AGIs $50k-75k, 374.6% for AGIs $75k-100k, 676.9% for AGIs $100k-200k, 2710.0% for AGIs over 200k)
Self-employed (Keogh) retirement plans: $30,039 (reported on 1.0% of returns)
95973:
$30,039
California:
$30,163
(% of AGI for various income ranges: 7.8% for AGIs $25k-50k, 20.6% for AGIs $75k-100k, 68.4% for AGIs $100k-200k, 1386.1% for AGIs over 200k)
Total itemized deductions: $32,161 (reported on 12.2% of returns)
Here:
$32,161
State:
$39,517
(% of AGI for various income ranges: 77.3% for AGIs below $25k, 143.5% for AGIs $25k-50k, 439.7% for AGIs $50k-75k, 835.2% for AGIs $75k-100k, 1581.8% for AGIs $100k-200k, 7619.6% for AGIs over 200k)
Charity contributions: $8,144 (reported on 9.5% of returns)
Here:
$8,144
State:
$12,598
(% of AGI for various income ranges: 5.4% for AGIs below $25k, 11.7% for AGIs $25k-50k, 49.9% for AGIs $50k-75k, 92.0% for AGIs $75k-100k, 283.4% for AGIs $100k-200k, 2398.6% for AGIs over 200k)
Taxes paid: $8,238 (reported on 12.1% of returns)
95973:
$8,238
State:
$8,807
(% of AGI for various income ranges: 14.6% for AGIs below $25k, 25.1% for AGIs $25k-50k, 113.6% for AGIs $50k-75k, 233.9% for AGIs $75k-100k, 489.4% for AGIs $100k-200k, 1520.4% for AGIs over 200k)
Earned income credit: $1,884 (reported on 12.1% of returns)
Here:
$1,884
State:
$2,074
(% of AGI for various income ranges: 67.9% for AGIs below $25k, 60.3% for AGIs $25k-50k, 1.4% for AGIs $50k-75k)
Percentage of individuals using paid preparers for their 2020 taxes: 94.4%
Here:
94%
State:
92%
(% for various income ranges: 93.0% for AGIs below $25k, 94.5% for AGIs $25k-50k, 95.5% for AGIs $50k-75k, 94.4% for AGIs $75k-100k, 94.9% for AGIs $100k-200k, 97.0% for AGIs over 200k)
Averages for the 2012 tax year for zip code 95973, filed in 2013:
Average Adjusted Gross Income (AGI) in 2012: $58,651 (Individual Income Tax Returns)
Here:
$58,651
State:
$72,726
Salary/wage: $48,480 (reported on 80.5% of returns)
Here:
$48,480
State:
$59,079
(% of AGI for various income ranges: 72.6% for AGIs below $25k, 76.3% for AGIs $25k-50k, 70.3% for AGIs $50k-75k, 71.9% for AGIs $75k-100k, 72.6% for AGIs $100k-200k, 44.1% for AGIs over 200k)
Taxable interest for individuals: $1,466 (reported on 41.2% of returns)
This zip code:
$1,466
California:
$2,146
(% of AGI for various income ranges: 1.5% for AGIs below $25k, 0.8% for AGIs $25k-50k, 1.0% for AGIs $50k-75k, 0.8% for AGIs $75k-100k, 0.8% for AGIs $100k-200k, 1.5% for AGIs over 200k)
Ordinary dividends: $5,529 (reported on 20.2% of returns)
Here:
$5,529
State:
$9,308
(% of AGI for various income ranges: 2.0% for AGIs below $25k, 1.3% for AGIs $25k-50k, 1.4% for AGIs $50k-75k, 1.1% for AGIs $75k-100k, 1.4% for AGIs $100k-200k, 3.8% for AGIs over 200k)
Net capital gain/loss in AGI: +$6,273 (reported on 17.3% of returns)
Here:
+$6,273
State:
+$30,460
(% of AGI for various income ranges: 0.4% for AGIs $50k-75k, 0.8% for AGIs $75k-100k, 1.3% for AGIs $100k-200k, 6.2% for AGIs over 200k)
Profit/loss from business: +$23,626 (reported on 17.3% of returns)
Here:
+$23,626
State:
+$17,064
(% of AGI for various income ranges: 8.8% for AGIs below $25k, 4.9% for AGIs $25k-50k, 5.0% for AGIs $50k-75k, 4.9% for AGIs $75k-100k, 4.9% for AGIs $100k-200k, 13.1% for AGIs over 200k)
Taxable individual retirement arrangement distribution: $14,941 (reported on 9.7% of returns)
95973:
$14,941
California:
$19,557
(% of AGI for various income ranges: 2.7% for AGIs below $25k, 2.5% for AGIs $25k-50k, 3.1% for AGIs $50k-75k, 2.9% for AGIs $75k-100k, 2.5% for AGIs $100k-200k, 1.6% for AGIs over 200k)
Self-employment retirement plans: $25,000 (reported on 1.2% of returns)
95973:
$25,000
California:
$24,530
(% of AGI for various income ranges: 0.8% for AGIs $50k-75k, 0.4% for AGIs $100k-200k, 1.3% for AGIs over 200k)
Total itemized deductions: $24,321 (22% of AGI, reported on 35.4% of returns)
Here:
$24,321
State:
$34,004
Here:
22.2% of AGI
State:
22.7% of AGI
(% of AGI for various income ranges: 9.7% for AGIs below $25k, 10.5% for AGIs $25k-50k, 15.0% for AGIs $50k-75k, 16.3% for AGIs $75k-100k, 17.3% for AGIs $100k-200k, 14.8% for AGIs over 200k)
Charity contributions: $2,927 (reported on 29.2% of returns)
Here:
$2,927
State:
$4,659
(% of AGI for various income ranges: 0.6% for AGIs below $25k, 0.9% for AGIs $25k-50k, 1.3% for AGIs $50k-75k, 1.6% for AGIs $75k-100k, 1.7% for AGIs $100k-200k, 1.9% for AGIs over 200k)
Taxes paid: $9,283 (reported on 35.4% of returns)
95973:
$9,283
State:
$14,448
(% of AGI for various income ranges: 1.6% for AGIs below $25k, 2.7% for AGIs $25k-50k, 4.0% for AGIs $50k-75k, 5.3% for AGIs $75k-100k, 6.9% for AGIs $100k-200k, 8.8% for AGIs over 200k)
Earned income credit: $1,972 (reported on 17.4% of returns)
Here:
$1,972
State:
$2,286
(% of AGI for various income ranges: 5.5% for AGIs below $25k, 1.0% for AGIs $25k-50k)
Percentage of individuals using paid preparers for their 2012 taxes: 54.7%
Here:
55%
State:
64%
(% for various income ranges: 46.6% for AGIs below $25k, 53.1% for AGIs $25k-50k, 57.4% for AGIs $50k-75k, 63.5% for AGIs $75k-100k, 64.7% for AGIs $100k-200k, 82.6% for AGIs over 200k)
Averages for the 2004 tax year for zip code 95973, filed in 2005:
Average Adjusted Gross Income (AGI) in 2004: $46,745 (Individual Income Tax Returns)
Here:
$46,745
State:
$58,600
Salary/wage: $39,595 (reported on 81.1% of returns)
Here:
$39,595
State:
$49,455
(% of AGI for various income ranges: 179.1% for AGIs below $10k, 75.5% for AGIs $10k-25k, 77.6% for AGIs $25k-50k, 74.2% for AGIs $50k-75k, 76.1% for AGIs $75k-100k, 54.1% for AGIs over 100k)
Taxable interest for individuals: $1,776 (reported on 48.7% of returns)
This zip code:
$1,776
California:
$2,365
(% of AGI for various income ranges: 13.2% for AGIs below $10k, 2.5% for AGIs $10k-25k, 1.6% for AGIs $25k-50k, 1.8% for AGIs $50k-75k, 1.4% for AGIs $75k-100k, 1.7% for AGIs over 100k)
Taxable dividends: $2,490 (reported on 25.4% of returns)
Here:
$2,490
State:
$4,746
(% of AGI for various income ranges: 9.3% for AGIs below $10k, 1.5% for AGIs $10k-25k, 1.1% for AGIs $25k-50k, 1.3% for AGIs $50k-75k, 1.0% for AGIs $75k-100k, 1.4% for AGIs over 100k)
Net capital gain/loss: +$13,565 (reported on 22.3% of returns)
Here:
+$13,565
State:
+$23,418
(% of AGI for various income ranges: -6.2% for AGIs below $10k, 0.7% for AGIs $10k-25k, 0.6% for AGIs $25k-50k, 1.2% for AGIs $50k-75k, 1.8% for AGIs $75k-100k, 15.6% for AGIs over 100k)
Profit/loss from business: +$20,829 (reported on 17.8% of returns)
Here:
+$20,829
State:
+$16,826
(% of AGI for various income ranges: -1.3% for AGIs below $10k, 6.4% for AGIs $10k-25k, 5.4% for AGIs $25k-50k, 6.4% for AGIs $50k-75k, 6.2% for AGIs $75k-100k, 11.2% for AGIs over 100k)
IRA payment deduction: $3,129 (reported on 3.2% of returns)
95973:
$3,129
California:
$3,192
(% of AGI for various income ranges: 0.5% for AGIs below $10k, 0.2% for AGIs $10k-25k, 0.3% for AGIs $25k-50k, 0.2% for AGIs $50k-75k, 0.2% for AGIs $75k-100k, 0.2% for AGIs over 100k)
Self-employed pension: $17,247 (reported on 1.6% of returns)
Here:
$17,247
California:
$17,688
(% of AGI for various income ranges: 0.1% for AGIs $10k-25k, 0.1% for AGIs $25k-50k, 0.2% for AGIs $50k-75k, 0.4% for AGIs $75k-100k, 1.2% for AGIs over 100k)
Total itemized deductions: $21,150 (25% of AGI, reported on 37.6% of returns)
Here:
$21,150
State:
$28,113
Here:
24.6% of AGI
State:
25.3% of AGI
(% of AGI for various income ranges: 35.4% for AGIs below $10k, 10.3% for AGIs $10k-25k, 14.5% for AGIs $25k-50k, 19.2% for AGIs $50k-75k, 20.1% for AGIs $75k-100k, 17.2% for AGIs over 100k)
Charity contributions deductions: $2,914 (3% of AGI, reported on 32.7% of returns)
Here:
$2,914
State:
$3,923
Here:
3.2% of AGI
State:
3.3% of AGI
(% of AGI for various income ranges: 1.4% for AGIs below $10k, 0.8% for AGIs $10k-25k, 1.3% for AGIs $25k-50k, 2.0% for AGIs $50k-75k, 2.1% for AGIs $75k-100k, 2.7% for AGIs over 100k)
Total tax: $7,056 (reported on 77.5% of returns)
95973:
$7,056
State:
$10,761
(% of AGI for various income ranges: 6.5% for AGIs below $10k, 4.7% for AGIs $10k-25k, 7.2% for AGIs $25k-50k, 8.7% for AGIs $50k-75k, 10.1% for AGIs $75k-100k, 17.9% for AGIs over 100k)
Earned income credit: $1,510 (reported on 13.5% of returns)
Here:
$1,510
State:
$1,763
Percentage of individuals using paid preparers for their 2004 taxes: 57.8%
Here:
58%
State:
66%
(% for various income ranges: 48.5% for AGIs below $10k, 52.5% for AGIs $10k-25k, 56.1% for AGIs $25k-50k, 64.0% for AGIs $50k-75k, 66.7% for AGIs $75k-100k, 79.0% for AGIs over 100k)
Likely homosexual households (counted as self-reported same-sex unmarried-partner households)
Lesbian couples: 0.2% of all households
Gay men: 0.0% of all households
Household received Food Stamps/SNAP in the past 12 months: 1,200 Household did not receive Food Stamps/SNAP in the past 12 months: 14,010
Women who had a birth in the past 12 months: 498 (268 now married, 232 unmarried) Women who did not have a birth in the past 12 months: 8,966 (3,452 now married, 5,518 unmarried)
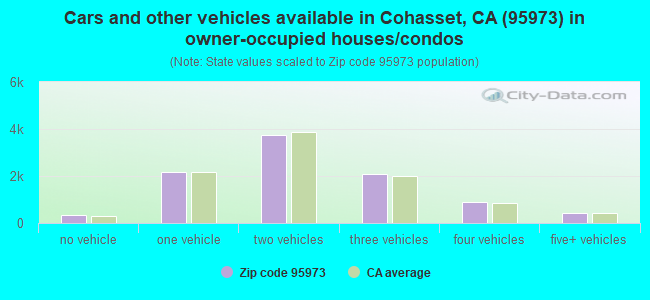
Housing units in zip code 95973 with a mortgage: 5,858 (438 second mortgage, 408 both second mortgage and home equity loan) Houses without a mortgage: 88
Median monthly owner costs for units with a mortgage: $2,216 Median monthly owner costs for units without a mortgage: $756
Residents with income below the poverty level in 2022:
This zip code:
11.5%
Whole state:
12.2%
Residents with income below 50% of the poverty level in 2022:
This zip code:
6.0%
Whole state:
6.2%
Median number of rooms in houses and condos:
Here:
6.1
State:
6.0
Median number of rooms in apartments:
Here:
4.0
State:
3.9
Notable locations in this zip code not listed on our city pages
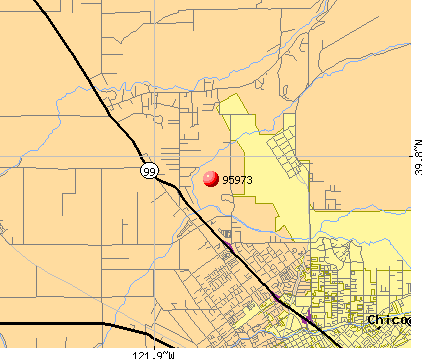
Notable locations in zip code 95973: Stephens Ranch (A), Old Spanish Corral (B), Baccala Cabin (C), Bell Ranch (D), Hobson Camp (E), Wilson Landing (F), Franks Cabin (G), Apperson Cow Camp (H), Bell Ranch (I), Scottys Boat Landing (J), Pine Creek Landing (K), Four Corners (L), Bidwell Municipal Golf Course (M), Cohasset Forest Fire Station (N), Enloe Rehabilitation Center (O), California Department of Forestry and Fire Protection Station 22 Cohasset (P), Chico Fire Department Station 6 (Q), Chico Fire Department Station 3 (R), Butte County Fire Department Station 41 (S), Chico Fire Department Station 5 (T). Display/hide their locations on the map
Streams, rivers, and creeks: Brush Creek (A), Harbean Slough (B), Dicus Slough (C), Wildcat Creek (D), Campbell Creek (E), Singer Creek (F), Rock Creek (G), Anderson Fork (H), Rattlesnake Creek (I). Display/hide their locations on the map
Parks in zip code 95973 include: Bidwell Park (1), Bidwell-Sacramento River State Park (2), Big Chico Creek Day Use Area (3). Display/hide their locations on the map
5,242 married couples with children.
2,556 single-parent households (694 men, 1,862 women).
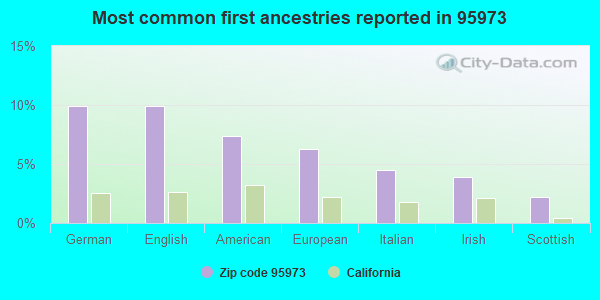
84.2% of residents of 95973 zip code speak English at home.
9.2% of residents speak Spanish at home (73% very well, 12% well, 14% not well, 2% not at all).
2.1% of residents speak other Indo-European language at home (86% very well, 11% well, 3% not well).
3.7% of residents speak Asian or Pacific Island language at home (61% very well, 15% well, 19% not well, 5% not at all).
0.1% of residents speak other language at home (89% very well, 11% well).
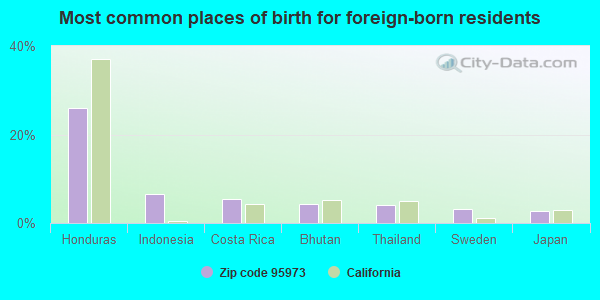
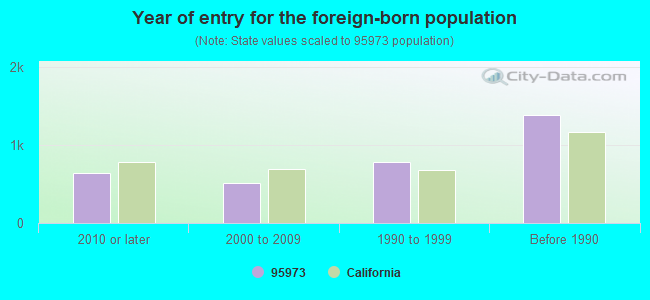
Foreign born population: 3,157 (8.3%) (56.0% of them are naturalized citizens)
Major facilities with environmental interests located in this zip code:
AERO UNION CORP (108 BOEING AVE in CHICO, CA)
STATE MASTER (California - Hazardous Waste Tracking) - HAZARDOU WASTE PROGRAM CRITERIA AND HAZARDOUS AIR POLLUTANT INVENTORY (Inventory of air pollution sources) Small Quantity Generators, between 100 kg and 1000 kg of hazardous waste/month (Resource Conservation and Recovery Act (tracking hazardous waste)) - notification Business SIC classification: TELEPHONE COMMUNICATIONS, EXCEPT RADIOTELEPHONE
AERO UNION CORP (747 FORTRESS ST in CHICO, CA)
STATE MASTER (California - Hazardous Waste Tracking) - HAZARDOU WASTE PROGRAM Small Quantity Generators, between 100 kg and 1000 kg of hazardous waste/month (Resource Conservation and Recovery Act (tracking hazardous waste)) - notification
AERO UNION CORP (1072 MARAUDER AVE in CHICO, CA)
Small Quantity Generators, between 100 kg and 1000 kg of hazardous waste/month (Resource Conservation and Recovery Act (tracking hazardous waste)) Business NAICS classification: AIRCRAFT MANUFACTURING.
ALLIANCE ENVIRONMENTAL SERVICES (34 GLENSHIRE LANE in CHICO, CA)
TRANSPORTER (Resource Conservation and Recovery Act (tracking hazardous waste)) - notification Organizations: WILLIAM IRWIN (CONTACT/OWNER)
360 NETWORKS (4746 TOKAY RANCH ROAD in CHICO, CA)
CRITERIA AND HAZARDOUS AIR POLLUTANT INVENTORY (Inventory of air pollution sources)
ALL STAR PAC, INC. (3377 ESPLANADE in CHICO, CA)
CRITERIA AND HAZARDOUS AIR POLLUTANT INVENTORY (Inventory of air pollution sources) Business SIC classification: RADIOTELEPHONE COMMUNICATIONS
GARNER LANE SITE / CHICO (3 MI NORTH OF CHICO ON THE EAS in CHICO, CA)
CRITERIA AND HAZARDOUS AIR POLLUTANT INVENTORY (Inventory of air pollution sources) Business SIC classification: REFUSE SYSTEMS Business NAICS classification: SOLID WASTE LANDFILL.
HUGHES HARDWOODS (13586 HWY 99 in CHICO, CA)
CRITERIA AND HAZARDOUS AIR POLLUTANT INVENTORY (Inventory of air pollution sources)
KEEFER CREEK ESTATES WATER CO. (LIMOUSIN & GUNTREN in CHICO, CA)
CRITERIA AND HAZARDOUS AIR POLLUTANT INVENTORY (Inventory of air pollution sources)
MARBLECRAFT PRODUCTS (6369 COHASSET RD in CHICO, CA)
CRITERIA AND HAZARDOUS AIR POLLUTANT INVENTORY (Inventory of air pollution sources) Business SIC classification: GASOLINE SERVICE STATIONS
CHICO FIRE STATION #5 (1777 MANZANITA AVE. in CHICO, CA)
CRITERIA AND HAZARDOUS AIR POLLUTANT INVENTORY (Inventory of air pollution sources) Business SIC classification: FIRE PROTECTION
CHICO MUNICIPAL AIRPORT (150 AIRPARK BLVD. in CHICO, CA)
CRITERIA AND HAZARDOUS AIR POLLUTANT INVENTORY (Inventory of air pollution sources) Business SIC classification: GENERAL MEDICAL AND SURGICAL HOSPITALS
NORTH STATE ELECTRIC & PUMP (6 FREIGHT LANE in CHICO, CA)
CRITERIA AND HAZARDOUS AIR POLLUTANT INVENTORY (Inventory of air pollution sources)
Housing units lacking complete plumbing facilities: 0.7% Housing units lacking complete kitchen facilities: 1.5%
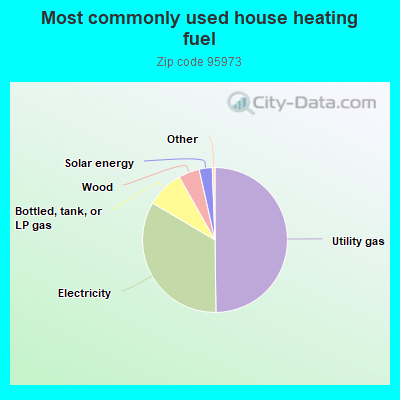
49.8%Utility gas
33.7%Electricity
8.3%Bottled, tank, or LP gas
4.7%Wood
2.9%Solar energy
Place of birth for U.S.-born residents:
This state: 28,077
Northeast: 818
Midwest: 1,537
South: 1,404
West: 2,736
47% of the 95973 zip code residents lived in the same house 5 years ago. Out of people who lived in different houses, 63% lived in this county. Out of people who lived in different counties, 50% lived in California.
85% of the 95973 zip code residents lived in the same house 1 year ago. Out of people who lived in different houses, 61% moved from this county. Out of people who lived in different houses, 23% moved from different county within same state. Out of people who lived in different houses, 12% moved from different state.
Private vs. public school enrollment:
Students in private schools in grades 1 to 8 (elementary and middle school): 277
Here:
7.7%
California:
10.5%
Students in private schools in grades 9 to 12 (high school): 50
Here:
2.7%
California:
8.5%
Students in private undergraduate colleges: 262
Here:
10.4%
California:
15.9%
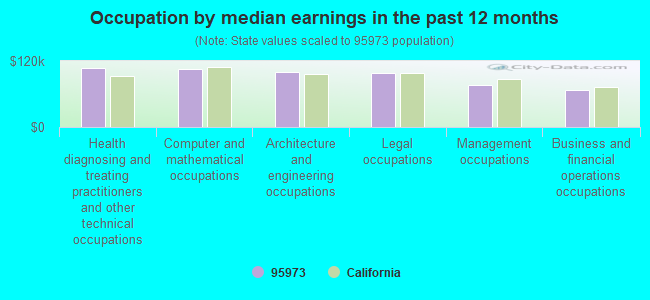
Occupation by median earnings in the past 12 months ($)
107,452Health diagnosing and treating practitioners and other technical occupations
105,864Computer and mathematical occupations
100,661Architecture and engineering occupations
98,285Legal occupations
77,051Management occupations
67,374Business and financial operations occupations
Companies with federal contracts located in this zip code (CHICO, CA):
SANTOS EXCAVATING INC (4642 RENKOW RD; small business) : $2,003,271 in 9 contractsfrom 2000 to 2006
Contracts for Maintenance, Repair or Alteration of Real Property -- Highways, Roads, Streets, Bridges, and Railways (includes resurfacing), Construction of Structures and Facilities -- Ammunition Storage Buildings, Construction of Structures and Facilities -- Parking Facilities Conservation, Maintenance, Repair or Alteration of Real Property -- Other Non-Building Facilities by Air Force, U.S. Army Corps of Engineers - civil program financing only Signed by year:2000: $42,711; 2001: $0; 2002: $0; 2003: $0; 2004: $0; 2005: $1,878,560; 2006: $82,000.
Biggest contracts:
$846,984 with Air Force for Maintenance, Repair or Alteration of Real Property -- Highways, Roads, Streets, Bridges, and Railways (includes resurfacing). Signed on 2005-09-30. Completion date: 2006-06-03.
$302,303 with Air Force for Construction of Structures and Facilities -- Ammunition Storage Buildings. Signed on 2005-09-22. Completion date: 2006-04-18.
$230,989 with Air Force for Maintenance, Repair or Alteration of Real Property -- Highways, Roads, Streets, Bridges, and Railways (includes resurfacing). Signed on 2005-09-30. Completion date: 2006-06-03.
$169,124 with Air Force for Construction of Structures and Facilities -- Parking Facilities Conservation. Signed on 2005-09-22. Completion date: 2006-01-30.
DELL MCDONNELL (337 SOUTHBURY LN; small business) : $1,935,822 in 40 contractsfrom 1999 to 2005
Contracts for Construction of Structures and Facilities -- Other Non-Building Facilities, Maintenance, Repair or Alteration of Real Property -- Miscellaneous Buildings, Maintenance, Repair or Alteration of Real Property -- Other Non-Building Facilities, Maintenance, Repair or Alteration of Real Property -- Sewage and Waste Facilities, and moreby U.S. Army Corps of Engineers - civil program financing only, Air Force, U.S. Coast Guard, National Park Service, and others Signed by year:2000: $125,209; 2001: $374,450; 2002: $449,030; 2003: $199,695; 2004: $553,865; 2005: $229,707; 2006: $0.
Biggest contracts:
$321,100 with U.S. Army Corps of Engineers - civil program financing only for Construction of Structures and Facilities -- Other Non-Building Facilities. Signed on 2002-08-02. Completion date: 2002-11-19.
$265,590 with Air Force for Maintenance, Repair or Alteration of Real Property -- Miscellaneous Buildings. Signed on 2001-06-05. Completion date: 2001-12-31.
$204,907 with U.S. Coast Guard for Maintenance, Repair or Alteration of Real Property -- Other Non-Building Facilities. Signed on 2005-02-14. Completion date: 2005-02-14.
$193,000, same as above.Signed on 2004-01-28. Effective on 2004-04-28. Completion date: 2004-05-28.
NORCAL FOOD EQUIPMENT INC (172 COMMERCIAL AVE; small business)
$55,183 with Air Force for Refrigeration Equipment. Signed on 2005-08-17. Completion date: 2005-10-17.
TILLGER, SHERRILL (2805 THE ESPLANADE; small business) : $20,147 in 2 contractsfrom 2004 to 2005
$19,984 with Army for Other Education and Training Services. Signed on 2004-08-06. Completion date: 2004-09-28.
$163, same as above.Signed on 2005-05-19. Completion date: 2004-09-28.
Top industries in this zip code by the number of employees in 2005:
Administrative and Support and Waste Management and Remediation Services: Temporary Help Services (100-249 employees: 2 establishments, 50-99 employees: 1 establishment, 20-49 employees: 1 establishment)
2003 - 2018 National Fire Incident Reporting System (NFIRS) incidents
Based on the data from the years 2003 - 2018 the average number of fires per year is 57. The highest number of reported fires - 107 took place in 2005, and the least - 2 in 2004. The data has a dropping trend.
When looking into fire subcategories, the most incidents belonged to: Outside Fires (50.3%), and Structure Fires (27.8%).
Fire incident types reported to NFIRS in Zip Code 95973
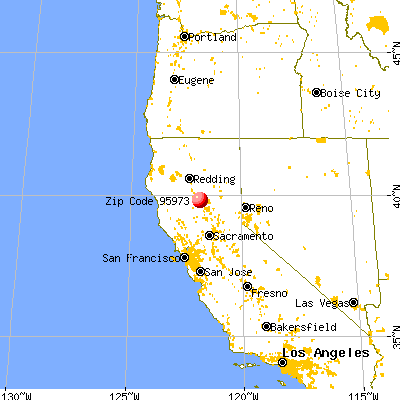


 Nearest zip codes: 95926, 96092, 95928, 95951, 95954, 95969.


 Based on the data from the years 2003 - 2018 the average number of fires per year is 57. The highest number of reported fires - 107 took place in 2005, and the least - 2 in 2004. The data has a dropping trend.
 When looking into fire subcategories, the most incidents belonged to: Outside Fires (50.3%), and Structure Fires (27.8%).