Estimated zip code population in 2022: 42,010 Zip code population in 2010: 37,725 Zip code population in 2000: 35,803
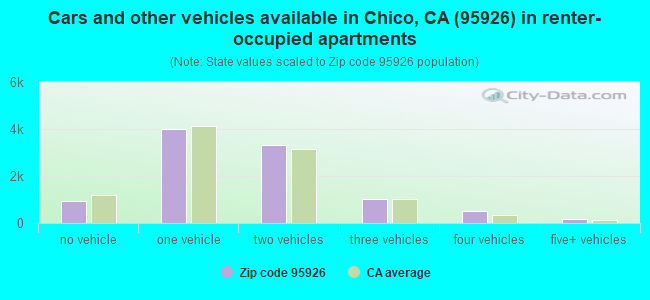
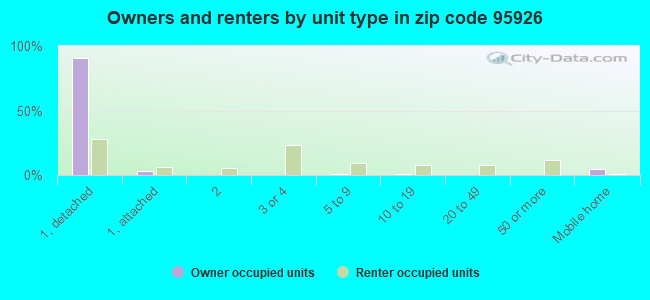
Houses and condos: 19,078 Renter-occupied apartments: 9,983
% of renters here:
58%
State:
44%
March 2022 cost of living index in zip code 95926: 98.1 (near average, U.S. average is 100)
Land area: 7.7 sq. mi. Water area: 0.0 sq. mi.
Population density: 5,491 people per square mile
(average).
OSM Map
General Map
Google Map
MSN Map
OSM Map
General Map
Google Map
MSN Map
OSM Map
General Map
Google Map
MSN Map
OSM Map
General Map
Google Map
MSN Map
Please wait while loading the map...
Real estate property taxes paid for housing units in 2022:
This zip code:
0.6% ($2,976)
California:
0.7% ($4,831)
Median real estate property taxes paid for housing units with mortgages in 2022: $3,207 (0.7%) Median real estate property taxes paid for housing units with no mortgage in 2022: $2,568 (0.6%)
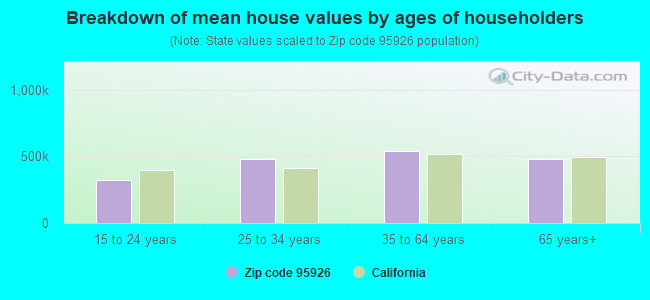
Estimated median house/condo value in 2022: $470,715
95926:
$470,715
California:
$715,900
According to our research of California and other state lists, there were 56 registered sex offenders living in 95926 zip code as of April 26, 2024. The ratio of all residents to sex offenders in zip code 95926 is 697 to 1. The ratio of registered sex offenders to all residents in this zip code is near the state average.
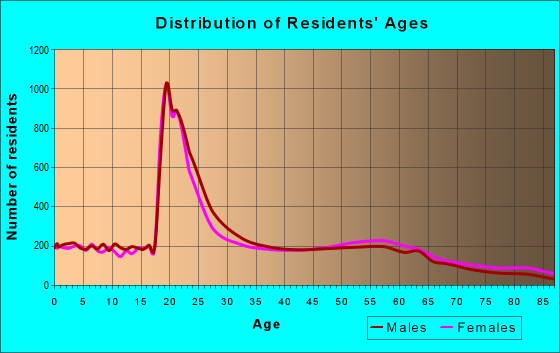
Median resident age:
This zip code:
27.5 years
California median age:
37.9 years
Average household size:
This zip code:
2.3 people
California:
2.8 people
Averages for the 2020 tax year for zip code 95926, filed in 2021:
Average Adjusted Gross Income (AGI) in 2020: $60,077 (Individual Income Tax Returns)
Here:
$60,077
State:
$95,910
Salary/wage: $47,141 (reported on 79.0% of returns)
Here:
$47,141
State:
$77,331
(% of AGI for various income ranges: 1226.8% for AGIs below $25k, 3780.5% for AGIs $25k-50k, 6636.3% for AGIs $50k-75k, 9686.8% for AGIs $75k-100k, 18531.7% for AGIs $100k-200k, 73907.5% for AGIs over 200k)
Taxable interest for individuals: $1,743 (reported on 32.4% of returns)
This zip code:
$1,743
California:
$2,294
(% of AGI for various income ranges: 12.8% for AGIs below $25k, 19.3% for AGIs $25k-50k, 69.5% for AGIs $50k-75k, 104.9% for AGIs $75k-100k, 193.8% for AGIs $100k-200k, 3720.0% for AGIs over 200k)
Ordinary dividends: $6,086 (reported on 18.9% of returns)
Here:
$6,086
State:
$10,949
(% of AGI for various income ranges: 22.4% for AGIs below $25k, 50.2% for AGIs $25k-50k, 131.1% for AGIs $50k-75k, 267.4% for AGIs $75k-100k, 555.4% for AGIs $100k-200k, 5757.5% for AGIs over 200k)
Net capital gain/loss in AGI: +$15,629 (reported on 18.4% of returns)
Here:
+$15,629
State:
+$49,306
(% of AGI for various income ranges: 12.5% for AGIs below $25k, 37.2% for AGIs $25k-50k, 151.8% for AGIs $50k-75k, 267.9% for AGIs $75k-100k, 892.6% for AGIs $100k-200k, 27465.0% for AGIs over 200k)
Profit/loss from business: +$17,833 (reported on 15.3% of returns)
Here:
+$17,833
State:
+$15,671
(% of AGI for various income ranges: 97.9% for AGIs below $25k, 201.9% for AGIs $25k-50k, 419.0% for AGIs $50k-75k, 617.2% for AGIs $75k-100k, 1204.5% for AGIs $100k-200k, 9719.2% for AGIs over 200k)
Taxable individual retirement arrangement distribution: $17,750 (reported on 8.3% of returns)
95926:
$17,750
California:
$23,505
(% of AGI for various income ranges: 39.5% for AGIs below $25k, 87.5% for AGIs $25k-50k, 211.9% for AGIs $50k-75k, 390.5% for AGIs $75k-100k, 814.9% for AGIs $100k-200k, 4538.3% for AGIs over 200k)
Self-employed (Keogh) retirement plans: $24,918 (reported on 0.7% of returns)
95926:
$24,918
California:
$30,163
(% of AGI for various income ranges: 27.3% for AGIs $50k-75k, 75.7% for AGIs $100k-200k, 1301.7% for AGIs over 200k)
Total itemized deductions: $29,467 (reported on 7.8% of returns)
Here:
$29,467
State:
$39,517
(% of AGI for various income ranges: 50.5% for AGIs below $25k, 103.0% for AGIs $25k-50k, 320.6% for AGIs $50k-75k, 701.3% for AGIs $75k-100k, 1310.2% for AGIs $100k-200k, 7820.0% for AGIs over 200k)
Charity contributions: $7,551 (reported on 6.0% of returns)
Here:
$7,551
State:
$12,598
(% of AGI for various income ranges: 1.7% for AGIs below $25k, 9.9% for AGIs $25k-50k, 25.2% for AGIs $50k-75k, 82.8% for AGIs $75k-100k, 245.2% for AGIs $100k-200k, 3005.0% for AGIs over 200k)
Taxes paid: $7,895 (reported on 7.7% of returns)
95926:
$7,895
State:
$8,807
(% of AGI for various income ranges: 7.1% for AGIs below $25k, 16.8% for AGIs $25k-50k, 77.3% for AGIs $50k-75k, 209.1% for AGIs $75k-100k, 413.6% for AGIs $100k-200k, 1872.5% for AGIs over 200k)
Earned income credit: $1,742 (reported on 14.3% of returns)
Here:
$1,742
State:
$2,074
(% of AGI for various income ranges: 54.2% for AGIs below $25k, 56.4% for AGIs $25k-50k, 1.6% for AGIs $50k-75k)
Percentage of individuals using paid preparers for their 2020 taxes: 94.7%
Here:
95%
State:
92%
(% for various income ranges: 94.1% for AGIs below $25k, 95.3% for AGIs $25k-50k, 95.2% for AGIs $50k-75k, 95.0% for AGIs $75k-100k, 94.7% for AGIs $100k-200k, 94.8% for AGIs over 200k)
Averages for the 2012 tax year for zip code 95926, filed in 2013:
Average Adjusted Gross Income (AGI) in 2012: $48,729 (Individual Income Tax Returns)
Here:
$48,729
State:
$72,726
Salary/wage: $38,483 (reported on 81.0% of returns)
Here:
$38,483
State:
$59,079
(% of AGI for various income ranges: 77.3% for AGIs below $25k, 75.5% for AGIs $25k-50k, 67.7% for AGIs $50k-75k, 68.7% for AGIs $75k-100k, 63.4% for AGIs $100k-200k, 35.0% for AGIs over 200k)
Taxable interest for individuals: $1,242 (reported on 36.2% of returns)
This zip code:
$1,242
California:
$2,146
(% of AGI for various income ranges: 1.0% for AGIs below $25k, 0.7% for AGIs $25k-50k, 0.8% for AGIs $50k-75k, 0.8% for AGIs $75k-100k, 0.9% for AGIs $100k-200k, 1.4% for AGIs over 200k)
Ordinary dividends: $4,607 (reported on 19.9% of returns)
Here:
$4,607
State:
$9,308
(% of AGI for various income ranges: 1.7% for AGIs below $25k, 1.5% for AGIs $25k-50k, 1.9% for AGIs $50k-75k, 1.7% for AGIs $75k-100k, 2.2% for AGIs $100k-200k, 2.0% for AGIs over 200k)
Net capital gain/loss in AGI: +$6,188 (reported on 16.4% of returns)
Here:
+$6,188
State:
+$30,460
(% of AGI for various income ranges: 0.3% for AGIs $25k-50k, 0.6% for AGIs $50k-75k, 0.9% for AGIs $75k-100k, 1.6% for AGIs $100k-200k, 8.8% for AGIs over 200k)
Profit/loss from business: +$19,275 (reported on 15.7% of returns)
Here:
+$19,275
State:
+$17,064
(% of AGI for various income ranges: 7.1% for AGIs below $25k, 5.3% for AGIs $25k-50k, 3.9% for AGIs $50k-75k, 4.5% for AGIs $75k-100k, 5.2% for AGIs $100k-200k, 12.3% for AGIs over 200k)
Taxable individual retirement arrangement distribution: $14,942 (reported on 10.3% of returns)
95926:
$14,942
California:
$19,557
(% of AGI for various income ranges: 2.7% for AGIs below $25k, 2.3% for AGIs $25k-50k, 3.0% for AGIs $50k-75k, 2.9% for AGIs $75k-100k, 3.7% for AGIs $100k-200k, 3.9% for AGIs over 200k)
Self-employment retirement plans: $20,921 (reported on 1.0% of returns)
95926:
$20,921
California:
$24,530
(% of AGI for various income ranges: 0.3% for AGIs $25k-50k, 0.2% for AGIs $75k-100k, 0.5% for AGIs $100k-200k, 1.4% for AGIs over 200k)
Total itemized deductions: $21,950 (22% of AGI, reported on 29.5% of returns)
Here:
$21,950
State:
$34,004
Here:
22.0% of AGI
State:
22.7% of AGI
(% of AGI for various income ranges: 7.7% for AGIs below $25k, 9.7% for AGIs $25k-50k, 14.3% for AGIs $50k-75k, 15.6% for AGIs $75k-100k, 16.0% for AGIs $100k-200k, 13.1% for AGIs over 200k)
Charity contributions: $3,406 (reported on 24.6% of returns)
Here:
$3,406
State:
$4,659
(% of AGI for various income ranges: 0.5% for AGIs below $25k, 0.9% for AGIs $25k-50k, 1.3% for AGIs $50k-75k, 2.2% for AGIs $75k-100k, 2.4% for AGIs $100k-200k, 2.3% for AGIs over 200k)
Taxes paid: $7,558 (reported on 29.5% of returns)
95926:
$7,558
State:
$14,448
(% of AGI for various income ranges: 1.3% for AGIs below $25k, 2.0% for AGIs $25k-50k, 3.8% for AGIs $50k-75k, 4.7% for AGIs $75k-100k, 6.3% for AGIs $100k-200k, 7.4% for AGIs over 200k)
Earned income credit: $1,811 (reported on 18.4% of returns)
Here:
$1,811
State:
$2,286
(% of AGI for various income ranges: 4.8% for AGIs below $25k, 0.9% for AGIs $25k-50k)
Percentage of individuals using paid preparers for their 2012 taxes: 50.3%
Here:
50%
State:
64%
(% for various income ranges: 41.8% for AGIs below $25k, 50.6% for AGIs $25k-50k, 56.6% for AGIs $50k-75k, 61.2% for AGIs $75k-100k, 65.5% for AGIs $100k-200k, 84.6% for AGIs over 200k)
Averages for the 2004 tax year for zip code 95926, filed in 2005:
Average Adjusted Gross Income (AGI) in 2004: $39,371 (Individual Income Tax Returns)
Here:
$39,371
State:
$58,600
Salary/wage: $32,356 (reported on 82.8% of returns)
Here:
$32,356
State:
$49,455
(% of AGI for various income ranges: 115.6% for AGIs below $10k, 78.2% for AGIs $10k-25k, 76.1% for AGIs $25k-50k, 73.2% for AGIs $50k-75k, 73.0% for AGIs $75k-100k, 51.4% for AGIs over 100k)
Taxable interest for individuals: $1,780 (reported on 42.4% of returns)
This zip code:
$1,780
California:
$2,365
(% of AGI for various income ranges: 4.6% for AGIs below $10k, 2.0% for AGIs $10k-25k, 2.0% for AGIs $25k-50k, 1.7% for AGIs $50k-75k, 1.4% for AGIs $75k-100k, 2.0% for AGIs over 100k)
Taxable dividends: $2,742 (reported on 24.7% of returns)
Here:
$2,742
State:
$4,746
(% of AGI for various income ranges: 4.1% for AGIs below $10k, 1.9% for AGIs $10k-25k, 1.5% for AGIs $25k-50k, 1.3% for AGIs $50k-75k, 1.1% for AGIs $75k-100k, 2.1% for AGIs over 100k)
Net capital gain/loss: +$8,574 (reported on 20.7% of returns)
Here:
+$8,574
State:
+$23,418
(% of AGI for various income ranges: -1.4% for AGIs below $10k, 0.4% for AGIs $10k-25k, 0.8% for AGIs $25k-50k, 1.7% for AGIs $50k-75k, 1.9% for AGIs $75k-100k, 11.1% for AGIs over 100k)
Profit/loss from business: +$18,110 (reported on 15.8% of returns)
Here:
+$18,110
State:
+$16,826
(% of AGI for various income ranges: 3.0% for AGIs below $10k, 5.5% for AGIs $10k-25k, 5.0% for AGIs $25k-50k, 5.3% for AGIs $50k-75k, 5.5% for AGIs $75k-100k, 11.3% for AGIs over 100k)
IRA payment deduction: $3,065 (reported on 3.0% of returns)
95926:
$3,065
California:
$3,192
(% of AGI for various income ranges: 0.3% for AGIs below $10k, 0.3% for AGIs $10k-25k, 0.3% for AGIs $25k-50k, 0.2% for AGIs $50k-75k, 0.2% for AGIs $75k-100k, 0.2% for AGIs over 100k)
Self-employed pension: $15,010 (reported on 1.4% of returns)
Here:
$15,010
California:
$17,688
(% of AGI for various income ranges: 0.1% for AGIs $25k-50k, 0.3% for AGIs $50k-75k, 0.5% for AGIs $75k-100k, 1.1% for AGIs over 100k)
Total itemized deductions: $19,043 (24% of AGI, reported on 31.0% of returns)
Here:
$19,043
State:
$28,113
Here:
23.8% of AGI
State:
25.3% of AGI
(% of AGI for various income ranges: 11.1% for AGIs below $10k, 8.4% for AGIs $10k-25k, 13.8% for AGIs $25k-50k, 17.0% for AGIs $50k-75k, 18.2% for AGIs $75k-100k, 15.8% for AGIs over 100k)
Charity contributions deductions: $2,696 (3% of AGI, reported on 27.3% of returns)
Here:
$2,696
State:
$3,923
Here:
3.2% of AGI
State:
3.3% of AGI
(% of AGI for various income ranges: 0.5% for AGIs below $10k, 0.8% for AGIs $10k-25k, 1.3% for AGIs $25k-50k, 1.8% for AGIs $50k-75k, 2.1% for AGIs $75k-100k, 2.6% for AGIs over 100k)
Total tax: $6,112 (reported on 74.2% of returns)
95926:
$6,112
State:
$10,761
(% of AGI for various income ranges: 3.0% for AGIs below $10k, 4.7% for AGIs $10k-25k, 7.5% for AGIs $25k-50k, 9.4% for AGIs $50k-75k, 10.8% for AGIs $75k-100k, 18.3% for AGIs over 100k)
Earned income credit: $1,386 (reported on 14.3% of returns)
Here:
$1,386
State:
$1,763
Percentage of individuals using paid preparers for their 2004 taxes: 51.8%
Here:
52%
State:
66%
(% for various income ranges: 38.0% for AGIs below $10k, 48.5% for AGIs $10k-25k, 54.2% for AGIs $25k-50k, 62.7% for AGIs $50k-75k, 64.6% for AGIs $75k-100k, 76.2% for AGIs over 100k)
Likely homosexual households (counted as self-reported same-sex unmarried-partner households)
Lesbian couples: 0.2% of all households
Gay men: 0.3% of all households
Household received Food Stamps/SNAP in the past 12 months: 2,830 Household did not receive Food Stamps/SNAP in the past 12 months: 14,602
Women who had a birth in the past 12 months: 363 (255 now married, 108 unmarried) Women who did not have a birth in the past 12 months: 11,230 (2,456 now married, 8,856 unmarried)
Housing units in zip code 95926 with a mortgage: 4,673 (546 second mortgage, 29 home equity loan, 344 both second mortgage and home equity loan) Houses without a mortgage: 168
Median monthly owner costs for units with a mortgage: $2,073 Median monthly owner costs for units without a mortgage: $605
Residents with income below the poverty level in 2022:
This zip code:
26.1%
Whole state:
12.2%
Residents with income below 50% of the poverty level in 2022:
This zip code:
10.6%
Whole state:
6.2%
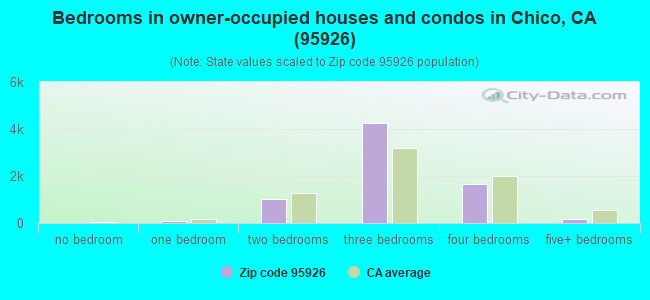
Median number of rooms in houses and condos:
Here:
6.2
State:
6.0
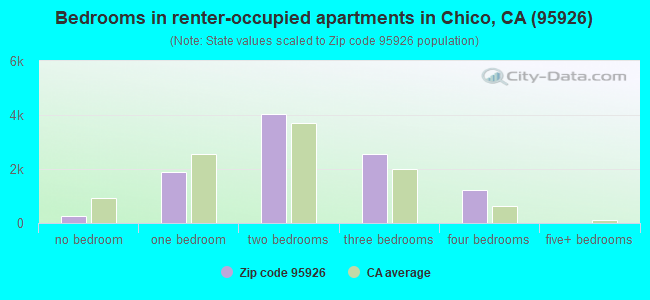
Median number of rooms in apartments:
Here:
4.1
State:
3.9
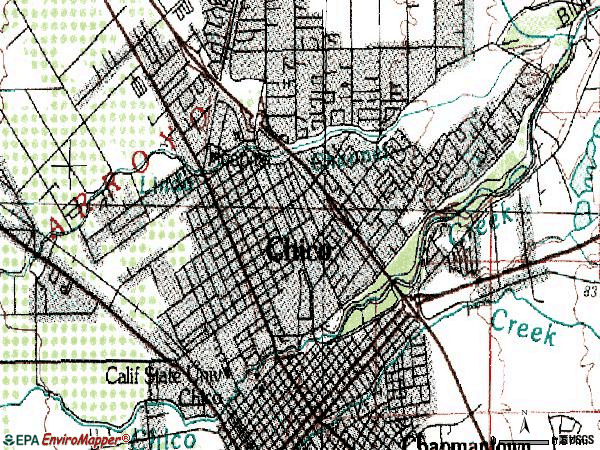
Notable locations in this zip code not listed on our city pages
Notable locations in zip code 95926: Hooker Oak (A), Veterans Memorial Building (B), Chico Fire Department Station 2 (C), Chico Branch Butte County Library (D), Bidwell Mansion (E), First Responder Emergency Medical Services Station 32 (F), First Responder Emergency Medical Services Station 31 (G), Butte County Behavioral Health and Inpatient Services (H). Display/hide their locations on the map
Churches in zip code 95926 include: Chico Gospel Hall (A), Church of Christ (B), The Church of Jesus Christ of Latter Day Saints (C), First Assembly of God Church (D), Four Square Church (E), Free Methodist Church (F), Grace Brethren Church (G), The Esplanade Baptist Church (H). Display/hide their locations on the map
4,044 married couples with children.
2,584 single-parent households (796 men, 1,788 women).
83.1% of residents of 95926 zip code speak English at home.
9.3% of residents speak Spanish at home (77% very well, 13% well, 7% not well, 3% not at all).
2.5% of residents speak other Indo-European language at home (83% very well, 13% well, 2% not well, 2% not at all).
3.9% of residents speak Asian or Pacific Island language at home (51% very well, 20% well, 27% not well, 2% not at all).
0.5% of residents speak other language at home (98% very well, 2% well).
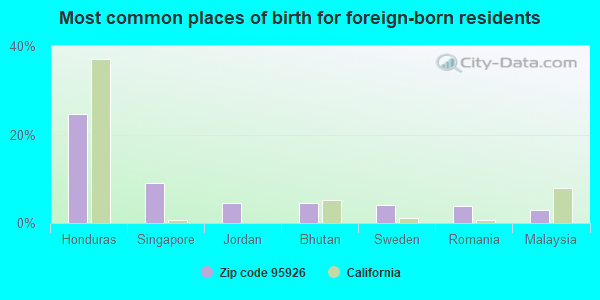
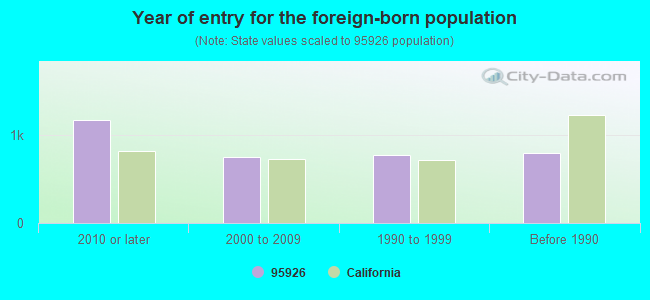
Foreign born population: 2,848 (6.8%) (49.1% of them are naturalized citizens)
Major facilities with environmental interests located in this zip code:
LOUISIANA PACIFIC CORP (16TH ST in CHICO, CA)
SUPERFUND (Superfund database) STATE MASTER (California - Hazardous Waste Tracking) - HAZARDOU WASTE PROGRAM Large Quantity Generators, more that 1000 kg of hazardous waste/month (Resource Conservation and Recovery Act (tracking hazardous waste))
AERO UNION CORP (165 RYAN AVE in CHICO, CA)
STATE MASTER (California - Hazardous Waste Tracking) - HAZARDOU WASTE PROGRAM CRITERIA AND HAZARDOUS AIR POLLUTANT INVENTORY (Inventory of air pollution sources) Small Quantity Generators, between 100 kg and 1000 kg of hazardous waste/month (Resource Conservation and Recovery Act (tracking hazardous waste)) - notification Business SIC classification: TELEPHONE COMMUNICATIONS, EXCEPT RADIOTELEPHONE Organizations: DALE NEWTON (CONTACT/OWNER)
CHICO CLEANERS (641 WALNUT ST STE B in CHICO, CA)
STATE MASTER (California - Hazardous Waste Tracking) - HAZARDOU WASTE PROGRAM CRITERIA AND HAZARDOUS AIR POLLUTANT INVENTORY (Inventory of air pollution sources) Small Quantity Generators, between 100 kg and 1000 kg of hazardous waste/month (Resource Conservation and Recovery Act (tracking hazardous waste)) - notification Business SIC classification: DRYCLEANING PLANTS, EXCEPT RUG CLEANING Organizations: LANCE L MARSHALL (CONTACT/OWNER)
CHUCK PATTERSON TOYOTA DODGE MAZDA (200 EAST AVE in CHICO, CA)
STATE MASTER (California - Hazardous Waste Tracking) - HAZARDOU WASTE PROGRAM CRITERIA AND HAZARDOUS AIR POLLUTANT INVENTORY (Inventory of air pollution sources) Small Quantity Generators, between 100 kg and 1000 kg of hazardous waste/month (Resource Conservation and Recovery Act (tracking hazardous waste)) Business SIC classification: TOP, BODY, AND UPHOLSTERY REPAIR SHOPS AND PAINT SHOPS Alternative names: CHUCK PATTERSON AUTO
ED WITTMEIER HONDA (1334 PARK AVE in CHICO, CA)
(Resource Conservation and Recovery Act (tracking hazardous waste)) Organizations: ED WHITTMEIER (CONTACT/OWNER)
ED WITTMEIER FORD LINC MERC (1240 PARK AVE in CHICO, CA)
(Resource Conservation and Recovery Act (tracking hazardous waste))
CHICO NISSON INC (575 MANZANITA in CHICO, CA)
STATE MASTER (California - Hazardous Waste Tracking) - HAZARDOU WASTE PROGRAM Small Quantity Generators, between 100 kg and 1000 kg of hazardous waste/month (Resource Conservation and Recovery Act (tracking hazardous waste)) - notification Organizations: BOWEN RAYMOND (CONTACT/OWNER)
Alternative names: CHICO NISSAN INC
MANGROVE MEDICAL LAB & X RAY (1040 MANGROVE AVE in CHICO, CA)
STATE MASTER (California - Hazardous Waste Tracking) - HAZARDOU WASTE PROGRAM Small Quantity Generators, between 100 kg and 1000 kg of hazardous waste/month (Resource Conservation and Recovery Act (tracking hazardous waste)) - notification Business NAICS classification: OFFICES OF PHYSICIANS, MENTAL HEALTH SPECIALISTS. Organizations: MANGROVE MEDICAL GROUP (CONTACT/OWNER)
FIRST GEAR TRANS (175 E 9TH AVE in CHICO, CA)
Small Quantity Generators, between 100 kg and 1000 kg of hazardous waste/month (Resource Conservation and Recovery Act (tracking hazardous waste)) - notification STATE MASTER (California - Used Oil Recycling System ) - USED OIL RECYCLING Business NAICS classification: AUTOMOTIVE TRANSMISSION REPAIR. Organizations: PRENTICE MARK (CONTACT/OWNER)
A C INDUSTRIAL SERVICES CORP (1111 MARAUDER ST in CHICO, CA)
STATE MASTER (California - Hazardous Waste Tracking) - HAZARDOU WASTE PROGRAM TRANSPORTER (Resource Conservation and Recovery Act (tracking hazardous waste)) Organizations: CHARLES C AND FAY D HAYS (CONTACT/OWNER)
KORET OF CALIFORNIA (1100 MARAUDER ST in CHICO, CA)
STATE MASTER (California - Hazardous Waste Tracking) - HAZARDOU WASTE PROGRAM Small Quantity Generators, between 100 kg and 1000 kg of hazardous waste/month (Resource Conservation and Recovery Act (tracking hazardous waste)) - notification Organizations: KORET INC (CONTACT/OWNER)
C AND M AUTOMOTIVE (1388 LONGFELLOW AVE in CHICO, CA)
STATE MASTER (California - Hazardous Waste Tracking) - HAZARDOU WASTE PROGRAM Small Quantity Generators, between 100 kg and 1000 kg of hazardous waste/month (Resource Conservation and Recovery Act (tracking hazardous waste)) - notification Organizations: DAVID LAYFIELD AND TERRY KOSLOFSKY (CONTACT/OWNER)
NORD ELEMENTARY (5554 CALIFORNIA ST. in CHICO, CA)
(National Center for Education Statistics) - STATE ID-6003057 Organizations: CHICO UNIFIED (SCHOOL DISTRICT)
Housing units lacking complete plumbing facilities: 0.3% Housing units lacking complete kitchen facilities: 1.1%
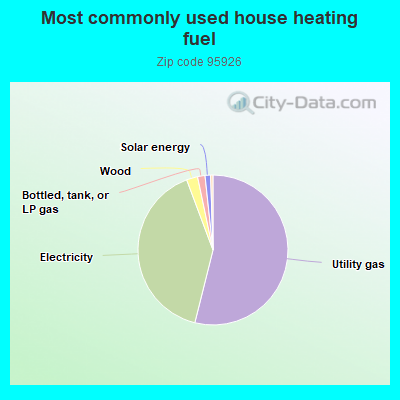
53.9%Utility gas
40.4%Electricity
2.4%Wood
1.6%Bottled, tank, or LP gas
1.2%Solar energy
Population in 1990: 55,269.
Place of birth for U.S.-born residents:
This state: 32,244
Northeast: 1,263
Midwest: 1,424
South: 1,557
West: 2,055
40% of the 95926 zip code residents lived in the same house 5 years ago. Out of people who lived in different houses, 49% lived in this county. Out of people who lived in different counties, 50% lived in California.
84% of the 95926 zip code residents lived in the same house 1 year ago. Out of people who lived in different houses, 60% moved from this county. Out of people who lived in different houses, 27% moved from different county within same state. Out of people who lived in different houses, 7% moved from different state. Out of people who lived in different houses, 2% moved from abroad.
Private vs. public school enrollment:
Students in private schools in grades 1 to 8 (elementary and middle school): 162
Here:
5.2%
California:
10.5%
Students in private schools in grades 9 to 12 (high school): 107
Here:
5.2%
California:
8.5%
Students in private undergraduate colleges: 548
Here:
6.4%
California:
15.9%
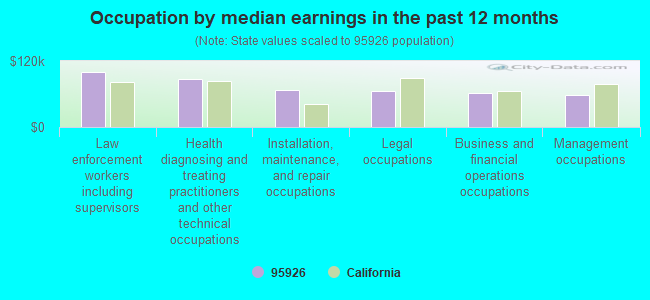
Occupation by median earnings in the past 12 months ($)
99,517Law enforcement workers including supervisors
87,915Health diagnosing and treating practitioners and other technical occupations
67,904Installation, maintenance, and repair occupations
65,101Legal occupations
61,828Business and financial operations occupations
58,350Management occupations
Companies with federal contracts located in this zip code (CHICO, CA):
NOR CAL MOBILITY INCORPORATED (1300 NORD AVENUE; small business) 25 employees, $3500000 revenue. : $471,018 in 10 contractsfrom 2000 to 2006
Contracts for Passenger Motor Vehicles, Medical and Surgical Instruments, Equipment, and Supplies, Hospital Furniture, Equipment, Utensils, and Supplies, Maintenance, Repair and Rebuilding of Equipment -- Medical, Dental, and Veterinary Equipment and Supplies by NASA, Department of Veterans Affairs Signed by year:2000: $96,000; 2001: $0; 2002: $0; 2003: $0; 2004: $0; 2005: $367,942; 2006: $7,076.
Biggest contracts:
$96,000 with NASA for Passenger Motor Vehicles. Signed on 2000-07-15. Completion date: 2000-10-15.
$89,865 with Department of Veterans Affairs for Medical and Surgical Instruments, Equipment, and Supplies. Signed on 2005-09-28. Completion date: 2005-09-30.
$89,202 with Department of Veterans Affairs for Hospital Furniture, Equipment, Utensils, and Supplies. Taking place in NV. Signed on 2005-07-07. Completion date: 2005-07-31.
$83,875 with Department of Veterans Affairs for Hospital Furniture, Equipment, Utensils, and Supplies. Signed on 2005-07-01. Completion date: 2005-07-31.
P WILLEY (892 VALLOMBROSA AVE; small business) : $69,250 in 5 contractsfrom 2000 to 2004
Contracts for Blood Derivatives, Pathology Services, Other Professional Services, Scientific Data Studies by Army, Navy Signed by year:2000: $57,750; 2001: $0; 2002: $0; 2003: $11,499; 2004: $1; 2005: $0; 2006: $0.
Biggest contracts:
$57,750 with Army for Blood Derivatives. Signed on 2000-12-28. Completion date: 2001-09-30.
$11,000 with Army for Pathology Services. Taking place in HI. Signed on 2003-07-16. Completion date: 2003-09-30.
$499, same as above.Signed on 2003-04-23. Completion date: 2003-06-30.
$1 with Navy for Other Professional Services. Taking place in HI. Signed on 2004-10-29. Completion date: 2005-10-31.
MARIOS PEST & WEED (1485 HOOKEROAK AVE; small business) : $42,098 in 12 contractsfrom 2003 to 2006
Contracts for Landscaping/Groundskeeping Services by Army, U.S. Army Corps of Engineers - civil program financing only Signed by year:2000: $0; 2001: $0; 2002: $0; 2003: $18,648; 2004: -$6,972; 2005: $18,648; 2006: $11,774.
Biggest contracts:
$9,324 with Army for Landscaping/Groundskeeping Services. Signed on 2005-02-09. Completion date: 2004-09-30.
$9,324 with U.S. Army Corps of Engineers - civil program financing only for Landscaping/Groundskeeping Services. Signed on 2005-02-09. Completion date: 2004-09-30.
$9,324, same as above.Signed on 2003-12-09. Completion date: 2004-09-30.
$9,324 with Army for Landscaping/Groundskeeping Services. Signed on 2003-12-09. Completion date: 2004-09-30.
REIMER PEST & WEED CONTROL (4 DAHLIA WAY; small business) : $24,840 in 6 contractsfrom 2003 to 2005
Contracts for Landscaping/Groundskeeping Services by Army, U.S. Army Corps of Engineers - civil program financing only Signed by year:2000: $0; 2001: $0; 2002: $0; 2003: $12,420; 2004: $0; 2005: $12,420; 2006: $0.
Biggest contracts:
$6,210 with Army for Landscaping/Groundskeeping Services. Signed on 2005-03-10. Completion date: 2004-09-30.
$6,210 with U.S. Army Corps of Engineers - civil program financing only for Landscaping/Groundskeeping Services. Signed on 2005-03-10. Completion date: 2004-09-30.
$6,210 with Army for Landscaping/Groundskeeping Services. Signed on 2003-12-09. Completion date: 2004-09-30.
$6,210 with U.S. Army Corps of Engineers - civil program financing only for Landscaping/Groundskeeping Services. Signed on 2003-12-09. Completion date: 2004-09-30.
CLEANRITE INC (1200 W EAST AVE; small business)
$10,313 with Air Force for Maintenance, Repair or Alteration of Real Property -- Troop Housing Facilities. Signed on 2004-11-18. Completion date: 2004-11-22.
JACOB, JAMES E (1362 MAGNOLIA AVENUE; small business) : $4,550 in 5 contractsfrom 2005 to 2006
Contracts for Educational Services, Other Education and Training Services by Army Signed by year:2000: $0; 2001: $0; 2002: $0; 2003: $0; 2004: $0; 2005: $650; 2006: $3,900.
Biggest contracts:
$1,950 with Army for Educational Services. Taking place in NY. Signed on 2006-02-02. Completion date: 2006-01-10.
$650 with Army for Other Education and Training Services. Taking place in NY. Signed on 2005-12-21. Completion date: 2005-11-30.
$650 with Army for Other Education and Training Services. Taking place in VA. Signed on 2006-05-23. Completion date: 2006-05-17.
$650, same as above.Signed on 2006-03-28. Completion date: 2006-03-23.
Top industries in this zip code by the number of employees in 2005:
Health Care and Social Assistance: General Medical and Surgical Hospitals (over 1000 employees: 1 establishment, 50-99 employees: 1 establishment)
Health Care and Social Assistance: Offices of Physicians (except Mental Health Specialists) (100-249: 1, 50-99: 1, 20-49: 8, 10-19: 11, 5-9: 32, 1-4: 62)
2003 - 2018 National Fire Incident Reporting System (NFIRS) incidents
Based on the data from the years 2003 - 2018 the average number of fire incidents per year is 269. The highest number of reported fire incidents - 487 took place in 2007, and the least - 2 in 2004. The data has an increasing trend.
When looking into fire subcategories, the most reports belonged to: Outside Fires (57.5%), and Structure Fires (25.9%).
Fire incident types reported to NFIRS in Zip Code 95926


 Nearest zip codes: 95928, 95973, 95938, 95951, 95969, 95943.


 Based on the data from the years 2003 - 2018 the average number of fire incidents per year is 269. The highest number of reported fire incidents - 487 took place in 2007, and the least - 2 in 2004. The data has an increasing trend.
 When looking into fire subcategories, the most reports belonged to: Outside Fires (57.5%), and Structure Fires (25.9%).