Chico, California Submit your own pictures of this city and show them to the world
OSM Map
General Map
Google Map
MSN Map
OSM Map
General Map
Google Map
MSN Map
OSM Map
General Map
Google Map
MSN Map
OSM Map
General Map
Google Map
MSN Map
Please wait while loading the map...
Population in 2022: 101,299 (100% urban, 0% rural). Population change since 2000: +69.0%Males: 49,857 Females: 51,442
March 2022 cost of living index in Chico: 97.7 (near average, U.S. average is 100) Percentage of residents living in poverty in 2022: 21.8%for White Non-Hispanic residents , 53.8% for Black residents , 25.3% for Hispanic or Latino residents , 17.6% for American Indian residents , 29.1% for Native Hawaiian and other Pacific Islander residents , 26.7% for other race residents , 23.1% for two or more races residents )
Profiles of local businesses
Business Search - 14 Million verified businesses
Data:
Median household income ($)
Median household income (% change since 2000)
Household income diversity
Ratio of average income to average house value (%)
Ratio of average income to average rent
Median household income ($) - White
Median household income ($) - Black or African American
Median household income ($) - Asian
Median household income ($) - Hispanic or Latino
Median household income ($) - American Indian and Alaska Native
Median household income ($) - Multirace
Median household income ($) - Other Race
Median household income for houses/condos with a mortgage ($)
Median household income for apartments without a mortgage ($)
Races - White alone (%)
Races - White alone (% change since 2000)
Races - Black alone (%)
Races - Black alone (% change since 2000)
Races - American Indian alone (%)
Races - American Indian alone (% change since 2000)
Races - Asian alone (%)
Races - Asian alone (% change since 2000)
Races - Hispanic (%)
Races - Hispanic (% change since 2000)
Races - Native Hawaiian and Other Pacific Islander alone (%)
Races - Native Hawaiian and Other Pacific Islander alone (% change since 2000)
Races - Two or more races (%)
Races - Two or more races (% change since 2000)
Races - Other race alone (%)
Races - Other race alone (% change since 2000)
Racial diversity
Unemployment (%)
Unemployment (% change since 2000)
Unemployment (%) - White
Unemployment (%) - Black or African American
Unemployment (%) - Asian
Unemployment (%) - Hispanic or Latino
Unemployment (%) - American Indian and Alaska Native
Unemployment (%) - Multirace
Unemployment (%) - Other Race
Population density (people per square mile)
Population - Males (%)
Population - Females (%)
Population - Males (%) - White
Population - Males (%) - Black or African American
Population - Males (%) - Asian
Population - Males (%) - Hispanic or Latino
Population - Males (%) - American Indian and Alaska Native
Population - Males (%) - Multirace
Population - Males (%) - Other Race
Population - Females (%) - White
Population - Females (%) - Black or African American
Population - Females (%) - Asian
Population - Females (%) - Hispanic or Latino
Population - Females (%) - American Indian and Alaska Native
Population - Females (%) - Multirace
Population - Females (%) - Other Race
Coronavirus confirmed cases (Apr 27, 2024)
Deaths caused by coronavirus (Apr 27, 2024)
Coronavirus confirmed cases (per 100k population) (Apr 27, 2024)
Deaths caused by coronavirus (per 100k population) (Apr 27, 2024)
Daily increase in number of cases (Apr 27, 2024)
Weekly increase in number of cases (Apr 27, 2024)
Cases doubled (in days) (Apr 27, 2024)
Hospitalized patients (Apr 18, 2022)
Negative test results (Apr 18, 2022)
Total test results (Apr 18, 2022)
COVID Vaccine doses distributed (per 100k population) (Sep 19, 2023)
COVID Vaccine doses administered (per 100k population) (Sep 19, 2023)
COVID Vaccine doses distributed (Sep 19, 2023)
COVID Vaccine doses administered (Sep 19, 2023)
Likely homosexual households (%)
Likely homosexual households (% change since 2000)
Likely homosexual households - Lesbian couples (%)
Likely homosexual households - Lesbian couples (% change since 2000)
Likely homosexual households - Gay men (%)
Likely homosexual households - Gay men (% change since 2000)
Cost of living index
Median gross rent ($)
Median contract rent ($)
Median monthly housing costs ($)
Median house or condo value ($)
Median house or condo value ($ change since 2000)
Mean house or condo value by units in structure - 1, detached ($)
Mean house or condo value by units in structure - 1, attached ($)
Mean house or condo value by units in structure - 2 ($)
Mean house or condo value by units in structure by units in structure - 3 or 4 ($)
Mean house or condo value by units in structure - 5 or more ($)
Mean house or condo value by units in structure - Boat, RV, van, etc. ($)
Mean house or condo value by units in structure - Mobile home ($)
Median house or condo value ($) - White
Median house or condo value ($) - Black or African American
Median house or condo value ($) - Asian
Median house or condo value ($) - Hispanic or Latino
Median house or condo value ($) - American Indian and Alaska Native
Median house or condo value ($) - Multirace
Median house or condo value ($) - Other Race
Median resident age
Resident age diversity
Median resident age - Males
Median resident age - Females
Median resident age - White
Median resident age - Black or African American
Median resident age - Asian
Median resident age - Hispanic or Latino
Median resident age - American Indian and Alaska Native
Median resident age - Multirace
Median resident age - Other Race
Median resident age - Males - White
Median resident age - Males - Black or African American
Median resident age - Males - Asian
Median resident age - Males - Hispanic or Latino
Median resident age - Males - American Indian and Alaska Native
Median resident age - Males - Multirace
Median resident age - Males - Other Race
Median resident age - Females - White
Median resident age - Females - Black or African American
Median resident age - Females - Asian
Median resident age - Females - Hispanic or Latino
Median resident age - Females - American Indian and Alaska Native
Median resident age - Females - Multirace
Median resident age - Females - Other Race
Commute - mean travel time to work (minutes)
Travel time to work - Less than 5 minutes (%)
Travel time to work - Less than 5 minutes (% change since 2000)
Travel time to work - 5 to 9 minutes (%)
Travel time to work - 5 to 9 minutes (% change since 2000)
Travel time to work - 10 to 19 minutes (%)
Travel time to work - 10 to 19 minutes (% change since 2000)
Travel time to work - 20 to 29 minutes (%)
Travel time to work - 20 to 29 minutes (% change since 2000)
Travel time to work - 30 to 39 minutes (%)
Travel time to work - 30 to 39 minutes (% change since 2000)
Travel time to work - 40 to 59 minutes (%)
Travel time to work - 40 to 59 minutes (% change since 2000)
Travel time to work - 60 to 89 minutes (%)
Travel time to work - 60 to 89 minutes (% change since 2000)
Travel time to work - 90 or more minutes (%)
Travel time to work - 90 or more minutes (% change since 2000)
Marital status - Never married (%)
Marital status - Now married (%)
Marital status - Separated (%)
Marital status - Widowed (%)
Marital status - Divorced (%)
Median family income ($)
Median family income (% change since 2000)
Median non-family income ($)
Median non-family income (% change since 2000)
Median per capita income ($)
Median per capita income (% change since 2000)
Median family income ($) - White
Median family income ($) - Black or African American
Median family income ($) - Asian
Median family income ($) - Hispanic or Latino
Median family income ($) - American Indian and Alaska Native
Median family income ($) - Multirace
Median family income ($) - Other Race
Median year house/condo built
Median year apartment built
Year house built - Built 2005 or later (%)
Year house built - Built 2000 to 2004 (%)
Year house built - Built 1990 to 1999 (%)
Year house built - Built 1980 to 1989 (%)
Year house built - Built 1970 to 1979 (%)
Year house built - Built 1960 to 1969 (%)
Year house built - Built 1950 to 1959 (%)
Year house built - Built 1940 to 1949 (%)
Year house built - Built 1939 or earlier (%)
Average household size
Household density (households per square mile)
Average household size - White
Average household size - Black or African American
Average household size - Asian
Average household size - Hispanic or Latino
Average household size - American Indian and Alaska Native
Average household size - Multirace
Average household size - Other Race
Occupied housing units (%)
Vacant housing units (%)
Owner occupied housing units (%)
Renter occupied housing units (%)
Vacancy status - For rent (%)
Vacancy status - For sale only (%)
Vacancy status - Rented or sold, not occupied (%)
Vacancy status - For seasonal, recreational, or occasional use (%)
Vacancy status - For migrant workers (%)
Vacancy status - Other vacant (%)
Residents with income below the poverty level (%)
Residents with income below 50% of the poverty level (%)
Children below poverty level (%)
Poor families by family type - Married-couple family (%)
Poor families by family type - Male, no wife present (%)
Poor families by family type - Female, no husband present (%)
Poverty status for native-born residents (%)
Poverty status for foreign-born residents (%)
Poverty among high school graduates not in families (%)
Poverty among people who did not graduate high school not in families (%)
Residents with income below the poverty level (%) - White
Residents with income below the poverty level (%) - Black or African American
Residents with income below the poverty level (%) - Asian
Residents with income below the poverty level (%) - Hispanic or Latino
Residents with income below the poverty level (%) - American Indian and Alaska Native
Residents with income below the poverty level (%) - Multirace
Residents with income below the poverty level (%) - Other Race
Air pollution - Air Quality Index (AQI)
Air pollution - CO
Air pollution - NO2
Air pollution - SO2
Air pollution - Ozone
Air pollution - PM10
Air pollution - PM25
Air pollution - Pb
Crime - Murders per 100,000 population
Crime - Rapes per 100,000 population
Crime - Robberies per 100,000 population
Crime - Assaults per 100,000 population
Crime - Burglaries per 100,000 population
Crime - Thefts per 100,000 population
Crime - Auto thefts per 100,000 population
Crime - Arson per 100,000 population
Crime - City-data.com crime index
Crime - Violent crime index
Crime - Property crime index
Crime - Murders per 100,000 population (5 year average)
Crime - Rapes per 100,000 population (5 year average)
Crime - Robberies per 100,000 population (5 year average)
Crime - Assaults per 100,000 population (5 year average)
Crime - Burglaries per 100,000 population (5 year average)
Crime - Thefts per 100,000 population (5 year average)
Crime - Auto thefts per 100,000 population (5 year average)
Crime - Arson per 100,000 population (5 year average)
Crime - City-data.com crime index (5 year average)
Crime - Violent crime index (5 year average)
Crime - Property crime index (5 year average)
1996 Presidential Elections Results (%) - Democratic Party (Clinton)
1996 Presidential Elections Results (%) - Republican Party (Dole)
1996 Presidential Elections Results (%) - Other
2000 Presidential Elections Results (%) - Democratic Party (Gore)
2000 Presidential Elections Results (%) - Republican Party (Bush)
2000 Presidential Elections Results (%) - Other
2004 Presidential Elections Results (%) - Democratic Party (Kerry)
2004 Presidential Elections Results (%) - Republican Party (Bush)
2004 Presidential Elections Results (%) - Other
2008 Presidential Elections Results (%) - Democratic Party (Obama)
2008 Presidential Elections Results (%) - Republican Party (McCain)
2008 Presidential Elections Results (%) - Other
2012 Presidential Elections Results (%) - Democratic Party (Obama)
2012 Presidential Elections Results (%) - Republican Party (Romney)
2012 Presidential Elections Results (%) - Other
2016 Presidential Elections Results (%) - Democratic Party (Clinton)
2016 Presidential Elections Results (%) - Republican Party (Trump)
2016 Presidential Elections Results (%) - Other
2020 Presidential Elections Results (%) - Democratic Party (Biden)
2020 Presidential Elections Results (%) - Republican Party (Trump)
2020 Presidential Elections Results (%) - Other
Ancestries Reported - Arab (%)
Ancestries Reported - Czech (%)
Ancestries Reported - Danish (%)
Ancestries Reported - Dutch (%)
Ancestries Reported - English (%)
Ancestries Reported - French (%)
Ancestries Reported - French Canadian (%)
Ancestries Reported - German (%)
Ancestries Reported - Greek (%)
Ancestries Reported - Hungarian (%)
Ancestries Reported - Irish (%)
Ancestries Reported - Italian (%)
Ancestries Reported - Lithuanian (%)
Ancestries Reported - Norwegian (%)
Ancestries Reported - Polish (%)
Ancestries Reported - Portuguese (%)
Ancestries Reported - Russian (%)
Ancestries Reported - Scotch-Irish (%)
Ancestries Reported - Scottish (%)
Ancestries Reported - Slovak (%)
Ancestries Reported - Subsaharan African (%)
Ancestries Reported - Swedish (%)
Ancestries Reported - Swiss (%)
Ancestries Reported - Ukrainian (%)
Ancestries Reported - United States (%)
Ancestries Reported - Welsh (%)
Ancestries Reported - West Indian (%)
Ancestries Reported - Other (%)
Educational Attainment - No schooling completed (%)
Educational Attainment - Less than high school (%)
Educational Attainment - High school or equivalent (%)
Educational Attainment - Less than 1 year of college (%)
Educational Attainment - 1 or more years of college (%)
Educational Attainment - Associate degree (%)
Educational Attainment - Bachelor's degree (%)
Educational Attainment - Master's degree (%)
Educational Attainment - Professional school degree (%)
Educational Attainment - Doctorate degree (%)
School Enrollment - Nursery, preschool (%)
School Enrollment - Kindergarten (%)
School Enrollment - Grade 1 to 4 (%)
School Enrollment - Grade 5 to 8 (%)
School Enrollment - Grade 9 to 12 (%)
School Enrollment - College undergrad (%)
School Enrollment - Graduate or professional (%)
School Enrollment - Not enrolled in school (%)
School enrollment - Public schools (%)
School enrollment - Private schools (%)
School enrollment - Not enrolled (%)
Median number of rooms in houses and condos
Median number of rooms in apartments
Housing units lacking complete plumbing facilities (%)
Housing units lacking complete kitchen facilities (%)
Density of houses
Urban houses (%)
Rural houses (%)
Households with people 60 years and over (%)
Households with people 65 years and over (%)
Households with people 75 years and over (%)
Households with one or more nonrelatives (%)
Households with no nonrelatives (%)
Population in households (%)
Family households (%)
Nonfamily households (%)
Population in families (%)
Family households with own children (%)
Median number of bedrooms in owner occupied houses
Mean number of bedrooms in owner occupied houses
Median number of bedrooms in renter occupied houses
Mean number of bedrooms in renter occupied houses
Median number of vehichles in owner occupied houses
Mean number of vehichles in owner occupied houses
Median number of vehichles in renter occupied houses
Mean number of vehichles in renter occupied houses
Mortgage status - with mortgage (%)
Mortgage status - with second mortgage (%)
Mortgage status - with home equity loan (%)
Mortgage status - with both second mortgage and home equity loan (%)
Mortgage status - without a mortgage (%)
Average family size
Average family size - White
Average family size - Black or African American
Average family size - Asian
Average family size - Hispanic or Latino
Average family size - American Indian and Alaska Native
Average family size - Multirace
Average family size - Other Race
Geographical mobility - Same house 1 year ago (%)
Geographical mobility - Moved within same county (%)
Geographical mobility - Moved from different county within same state (%)
Geographical mobility - Moved from different state (%)
Geographical mobility - Moved from abroad (%)
Place of birth - Born in state of residence (%)
Place of birth - Born in other state (%)
Place of birth - Native, outside of US (%)
Place of birth - Foreign born (%)
Housing units in structures - 1, detached (%)
Housing units in structures - 1, attached (%)
Housing units in structures - 2 (%)
Housing units in structures - 3 or 4 (%)
Housing units in structures - 5 to 9 (%)
Housing units in structures - 10 to 19 (%)
Housing units in structures - 20 to 49 (%)
Housing units in structures - 50 or more (%)
Housing units in structures - Mobile home (%)
Housing units in structures - Boat, RV, van, etc. (%)
House/condo owner moved in on average (years ago)
Renter moved in on average (years ago)
Year householder moved into unit - Moved in 1999 to March 2000 (%)
Year householder moved into unit - Moved in 1995 to 1998 (%)
Year householder moved into unit - Moved in 1990 to 1994 (%)
Year householder moved into unit - Moved in 1980 to 1989 (%)
Year householder moved into unit - Moved in 1970 to 1979 (%)
Year householder moved into unit - Moved in 1969 or earlier (%)
Means of transportation to work - Drove car alone (%)
Means of transportation to work - Carpooled (%)
Means of transportation to work - Public transportation (%)
Means of transportation to work - Bus or trolley bus (%)
Means of transportation to work - Streetcar or trolley car (%)
Means of transportation to work - Subway or elevated (%)
Means of transportation to work - Railroad (%)
Means of transportation to work - Ferryboat (%)
Means of transportation to work - Taxicab (%)
Means of transportation to work - Motorcycle (%)
Means of transportation to work - Bicycle (%)
Means of transportation to work - Walked (%)
Means of transportation to work - Other means (%)
Working at home (%)
Industry diversity
Most Common Industries - Agriculture, forestry, fishing and hunting, and mining (%)
Most Common Industries - Agriculture, forestry, fishing and hunting (%)
Most Common Industries - Mining, quarrying, and oil and gas extraction (%)
Most Common Industries - Construction (%)
Most Common Industries - Manufacturing (%)
Most Common Industries - Wholesale trade (%)
Most Common Industries - Retail trade (%)
Most Common Industries - Transportation and warehousing, and utilities (%)
Most Common Industries - Transportation and warehousing (%)
Most Common Industries - Utilities (%)
Most Common Industries - Information (%)
Most Common Industries - Finance and insurance, and real estate and rental and leasing (%)
Most Common Industries - Finance and insurance (%)
Most Common Industries - Real estate and rental and leasing (%)
Most Common Industries - Professional, scientific, and management, and administrative and waste management services (%)
Most Common Industries - Professional, scientific, and technical services (%)
Most Common Industries - Management of companies and enterprises (%)
Most Common Industries - Administrative and support and waste management services (%)
Most Common Industries - Educational services, and health care and social assistance (%)
Most Common Industries - Educational services (%)
Most Common Industries - Health care and social assistance (%)
Most Common Industries - Arts, entertainment, and recreation, and accommodation and food services (%)
Most Common Industries - Arts, entertainment, and recreation (%)
Most Common Industries - Accommodation and food services (%)
Most Common Industries - Other services, except public administration (%)
Most Common Industries - Public administration (%)
Occupation diversity
Most Common Occupations - Management, business, science, and arts occupations (%)
Most Common Occupations - Management, business, and financial occupations (%)
Most Common Occupations - Management occupations (%)
Most Common Occupations - Business and financial operations occupations (%)
Most Common Occupations - Computer, engineering, and science occupations (%)
Most Common Occupations - Computer and mathematical occupations (%)
Most Common Occupations - Architecture and engineering occupations (%)
Most Common Occupations - Life, physical, and social science occupations (%)
Most Common Occupations - Education, legal, community service, arts, and media occupations (%)
Most Common Occupations - Community and social service occupations (%)
Most Common Occupations - Legal occupations (%)
Most Common Occupations - Education, training, and library occupations (%)
Most Common Occupations - Arts, design, entertainment, sports, and media occupations (%)
Most Common Occupations - Healthcare practitioners and technical occupations (%)
Most Common Occupations - Health diagnosing and treating practitioners and other technical occupations (%)
Most Common Occupations - Health technologists and technicians (%)
Most Common Occupations - Service occupations (%)
Most Common Occupations - Healthcare support occupations (%)
Most Common Occupations - Protective service occupations (%)
Most Common Occupations - Fire fighting and prevention, and other protective service workers including supervisors (%)
Most Common Occupations - Law enforcement workers including supervisors (%)
Most Common Occupations - Food preparation and serving related occupations (%)
Most Common Occupations - Building and grounds cleaning and maintenance occupations (%)
Most Common Occupations - Personal care and service occupations (%)
Most Common Occupations - Sales and office occupations (%)
Most Common Occupations - Sales and related occupations (%)
Most Common Occupations - Office and administrative support occupations (%)
Most Common Occupations - Natural resources, construction, and maintenance occupations (%)
Most Common Occupations - Farming, fishing, and forestry occupations (%)
Most Common Occupations - Construction and extraction occupations (%)
Most Common Occupations - Installation, maintenance, and repair occupations (%)
Most Common Occupations - Production, transportation, and material moving occupations (%)
Most Common Occupations - Production occupations (%)
Most Common Occupations - Transportation occupations (%)
Most Common Occupations - Material moving occupations (%)
People in Group quarters - Institutionalized population (%)
People in Group quarters - Correctional institutions (%)
People in Group quarters - Federal prisons and detention centers (%)
People in Group quarters - Halfway houses (%)
People in Group quarters - Local jails and other confinement facilities (including police lockups) (%)
People in Group quarters - Military disciplinary barracks (%)
People in Group quarters - State prisons (%)
People in Group quarters - Other types of correctional institutions (%)
People in Group quarters - Nursing homes (%)
People in Group quarters - Hospitals/wards, hospices, and schools for the handicapped (%)
People in Group quarters - Hospitals/wards and hospices for chronically ill (%)
People in Group quarters - Hospices or homes for chronically ill (%)
People in Group quarters - Military hospitals or wards for chronically ill (%)
People in Group quarters - Other hospitals or wards for chronically ill (%)
People in Group quarters - Hospitals or wards for drug/alcohol abuse (%)
People in Group quarters - Mental (Psychiatric) hospitals or wards (%)
People in Group quarters - Schools, hospitals, or wards for the mentally retarded (%)
People in Group quarters - Schools, hospitals, or wards for the physically handicapped (%)
People in Group quarters - Institutions for the deaf (%)
People in Group quarters - Institutions for the blind (%)
People in Group quarters - Orthopedic wards and institutions for the physically handicapped (%)
People in Group quarters - Wards in general hospitals for patients who have no usual home elsewhere (%)
People in Group quarters - Wards in military hospitals for patients who have no usual home elsewhere (%)
People in Group quarters - Juvenile institutions (%)
People in Group quarters - Long-term care (%)
People in Group quarters - Homes for abused, dependent, and neglected children (%)
People in Group quarters - Residential treatment centers for emotionally disturbed children (%)
People in Group quarters - Training schools for juvenile delinquents (%)
People in Group quarters - Short-term care, detention or diagnostic centers for delinquent children (%)
People in Group quarters - Type of juvenile institution unknown (%)
People in Group quarters - Noninstitutionalized population (%)
People in Group quarters - College dormitories (includes college quarters off campus) (%)
People in Group quarters - Military quarters (%)
People in Group quarters - On base (%)
People in Group quarters - Barracks, unaccompanied personnel housing (UPH), (Enlisted/Officer), ;and similar group living quarters for military personnel (%)
People in Group quarters - Transient quarters for temporary residents (%)
People in Group quarters - Military ships (%)
People in Group quarters - Group homes (%)
People in Group quarters - Homes or halfway houses for drug/alcohol abuse (%)
People in Group quarters - Homes for the mentally ill (%)
People in Group quarters - Homes for the mentally retarded (%)
People in Group quarters - Homes for the physically handicapped (%)
People in Group quarters - Other group homes (%)
People in Group quarters - Religious group quarters (%)
People in Group quarters - Dormitories (%)
People in Group quarters - Agriculture workers' dormitories on farms (%)
People in Group quarters - Job Corps and vocational training facilities (%)
People in Group quarters - Other workers' dormitories (%)
People in Group quarters - Crews of maritime vessels (%)
People in Group quarters - Other nonhousehold living situations (%)
People in Group quarters - Other noninstitutional group quarters (%)
Residents speaking English at home (%)
Residents speaking English at home - Born in the United States (%)
Residents speaking English at home - Native, born elsewhere (%)
Residents speaking English at home - Foreign born (%)
Residents speaking Spanish at home (%)
Residents speaking Spanish at home - Born in the United States (%)
Residents speaking Spanish at home - Native, born elsewhere (%)
Residents speaking Spanish at home - Foreign born (%)
Residents speaking other language at home (%)
Residents speaking other language at home - Born in the United States (%)
Residents speaking other language at home - Native, born elsewhere (%)
Residents speaking other language at home - Foreign born (%)
Class of Workers - Employee of private company (%)
Class of Workers - Self-employed in own incorporated business (%)
Class of Workers - Private not-for-profit wage and salary workers (%)
Class of Workers - Local government workers (%)
Class of Workers - State government workers (%)
Class of Workers - Federal government workers (%)
Class of Workers - Self-employed workers in own not incorporated business and Unpaid family workers (%)
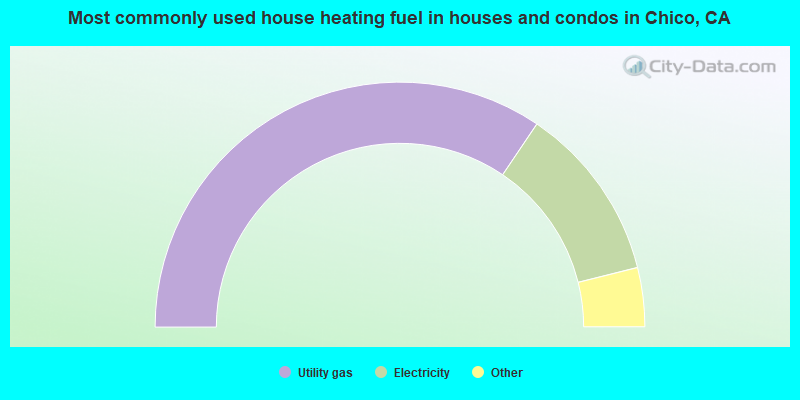
House heating fuel used in houses and condos - Utility gas (%)
House heating fuel used in houses and condos - Bottled, tank, or LP gas (%)
House heating fuel used in houses and condos - Electricity (%)
House heating fuel used in houses and condos - Fuel oil, kerosene, etc. (%)
House heating fuel used in houses and condos - Coal or coke (%)
House heating fuel used in houses and condos - Wood (%)
House heating fuel used in houses and condos - Solar energy (%)
House heating fuel used in houses and condos - Other fuel (%)
House heating fuel used in houses and condos - No fuel used (%)
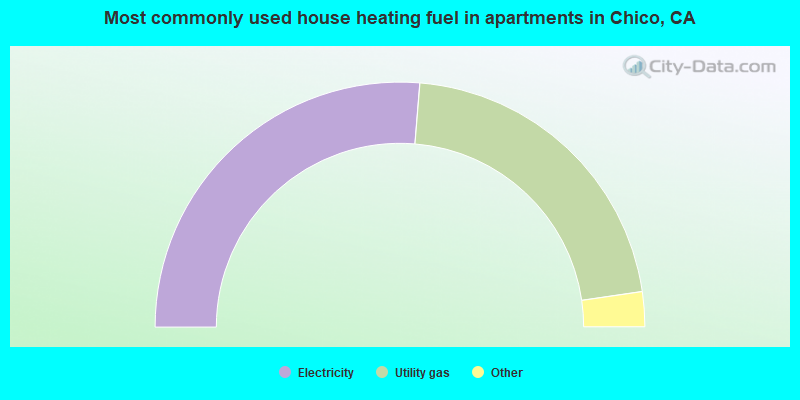
House heating fuel used in apartments - Utility gas (%)
House heating fuel used in apartments - Bottled, tank, or LP gas (%)
House heating fuel used in apartments - Electricity (%)
House heating fuel used in apartments - Fuel oil, kerosene, etc. (%)
House heating fuel used in apartments - Coal or coke (%)
House heating fuel used in apartments - Wood (%)
House heating fuel used in apartments - Solar energy (%)
House heating fuel used in apartments - Other fuel (%)
House heating fuel used in apartments - No fuel used (%)
Armed forces status - In Armed Forces (%)
Armed forces status - Civilian (%)
Armed forces status - Civilian - Veteran (%)
Armed forces status - Civilian - Nonveteran (%)
Fatal accidents locations in years 2005-2021
Fatal accidents locations in 2005
Fatal accidents locations in 2006
Fatal accidents locations in 2007
Fatal accidents locations in 2008
Fatal accidents locations in 2009
Fatal accidents locations in 2010
Fatal accidents locations in 2011
Fatal accidents locations in 2012
Fatal accidents locations in 2013
Fatal accidents locations in 2014
Fatal accidents locations in 2015
Fatal accidents locations in 2016
Fatal accidents locations in 2017
Fatal accidents locations in 2018
Fatal accidents locations in 2019
Fatal accidents locations in 2020
Fatal accidents locations in 2021
Alcohol use - People drinking some alcohol every month (%)
Alcohol use - People not drinking at all (%)
Alcohol use - Average days/month drinking alcohol
Alcohol use - Average drinks/week
Alcohol use - Average days/year people drink much
Audiometry - Average condition of hearing (%)
Audiometry - People that can hear a whisper from across a quiet room (%)
Audiometry - People that can hear normal voice from across a quiet room (%)
Audiometry - Ears ringing, roaring, buzzing (%)
Audiometry - Had a job exposure to loud noise (%)
Audiometry - Had off-work exposure to loud noise (%)
Blood Pressure & Cholesterol - Has high blood pressure (%)
Blood Pressure & Cholesterol - Checking blood pressure at home (%)
Blood Pressure & Cholesterol - Frequently checking blood cholesterol (%)
Blood Pressure & Cholesterol - Has high cholesterol level (%)
Consumer Behavior - Money monthly spent on food at supermarket/grocery store
Consumer Behavior - Money monthly spent on food at other stores
Consumer Behavior - Money monthly spent on eating out
Consumer Behavior - Money monthly spent on carryout/delivered foods
Consumer Behavior - Income spent on food at supermarket/grocery store (%)
Consumer Behavior - Income spent on food at other stores (%)
Consumer Behavior - Income spent on eating out (%)
Consumer Behavior - Income spent on carryout/delivered foods (%)
Current Health Status - General health condition (%)
Current Health Status - Blood donors (%)
Current Health Status - Has blood ever tested for HIV virus (%)
Current Health Status - Left-handed people (%)
Dermatology - People using sunscreen (%)
Diabetes - Diabetics (%)
Diabetes - Had a blood test for high blood sugar (%)
Diabetes - People taking insulin (%)
Diet Behavior & Nutrition - Diet health (%)
Diet Behavior & Nutrition - Milk product consumption (# of products/month)
Diet Behavior & Nutrition - Meals not home prepared (#/week)
Diet Behavior & Nutrition - Meals from fast food or pizza place (#/week)
Diet Behavior & Nutrition - Ready-to-eat foods (#/month)
Diet Behavior & Nutrition - Frozen meals/pizza (#/month)
Drug Use - People that ever used marijuana or hashish (%)
Drug Use - Ever used hard drugs (%)
Drug Use - Ever used any form of cocaine (%)
Drug Use - Ever used heroin (%)
Drug Use - Ever used methamphetamine (%)
Health Insurance - People covered by health insurance (%)
Kidney Conditions-Urology - Avg. # of times urinating at night
Medical Conditions - People with asthma (%)
Medical Conditions - People with anemia (%)
Medical Conditions - People with psoriasis (%)
Medical Conditions - People with overweight (%)
Medical Conditions - Elderly people having difficulties in thinking or remembering (%)
Medical Conditions - People who ever received blood transfusion (%)
Medical Conditions - People having trouble seeing even with glass/contacts (%)
Medical Conditions - People with arthritis (%)
Medical Conditions - People with gout (%)
Medical Conditions - People with congestive heart failure (%)
Medical Conditions - People with coronary heart disease (%)
Medical Conditions - People with angina pectoris (%)
Medical Conditions - People who ever had heart attack (%)
Medical Conditions - People who ever had stroke (%)
Medical Conditions - People with emphysema (%)
Medical Conditions - People with thyroid problem (%)
Medical Conditions - People with chronic bronchitis (%)
Medical Conditions - People with any liver condition (%)
Medical Conditions - People who ever had cancer or malignancy (%)
Mental Health - People who have little interest in doing things (%)
Mental Health - People feeling down, depressed, or hopeless (%)
Mental Health - People who have trouble sleeping or sleeping too much (%)
Mental Health - People feeling tired or having little energy (%)
Mental Health - People with poor appetite or overeating (%)
Mental Health - People feeling bad about themself (%)
Mental Health - People who have trouble concentrating on things (%)
Mental Health - People moving or speaking slowly or too fast (%)
Mental Health - People having thoughts they would be better off dead (%)
Oral Health - Average years since last visit a dentist
Oral Health - People embarrassed because of mouth (%)
Oral Health - People with gum disease (%)
Oral Health - General health of teeth and gums (%)
Oral Health - Average days a week using dental floss/device
Oral Health - Average days a week using mouthwash for dental problem
Oral Health - Average number of teeth
Pesticide Use - Households using pesticides to control insects (%)
Pesticide Use - Households using pesticides to kill weeds (%)
Physical Activity - People doing vigorous-intensity work activities (%)
Physical Activity - People doing moderate-intensity work activities (%)
Physical Activity - People walking or bicycling (%)
Physical Activity - People doing vigorous-intensity recreational activities (%)
Physical Activity - People doing moderate-intensity recreational activities (%)
Physical Activity - Average hours a day doing sedentary activities
Physical Activity - Average hours a day watching TV or videos
Physical Activity - Average hours a day using computer
Physical Functioning - People having limitations keeping them from working (%)
Physical Functioning - People limited in amount of work they can do (%)
Physical Functioning - People that need special equipment to walk (%)
Physical Functioning - People experiencing confusion/memory problems (%)
Physical Functioning - People requiring special healthcare equipment (%)
Prescription Medications - Average number of prescription medicines taking
Preventive Aspirin Use - Adults 40+ taking low-dose aspirin (%)
Reproductive Health - Vaginal deliveries (%)
Reproductive Health - Cesarean deliveries (%)
Reproductive Health - Deliveries resulted in a live birth (%)
Reproductive Health - Pregnancies resulted in a delivery (%)
Reproductive Health - Women breastfeeding newborns (%)
Reproductive Health - Women that had a hysterectomy (%)
Reproductive Health - Women that had both ovaries removed (%)
Reproductive Health - Women that have ever taken birth control pills (%)
Reproductive Health - Women taking birth control pills (%)
Reproductive Health - Women that have ever used Depo-Provera or injectables (%)
Reproductive Health - Women that have ever used female hormones (%)
Sexual Behavior - People 18+ that ever had sex (vaginal, anal, or oral) (%)
Sexual Behavior - Males 18+ that ever had vaginal sex with a woman (%)
Sexual Behavior - Males 18+ that ever performed oral sex on a woman (%)
Sexual Behavior - Males 18+ that ever had anal sex with a woman (%)
Sexual Behavior - Males 18+ that ever had any sex with a man (%)
Sexual Behavior - Females 18+ that ever had vaginal sex with a man (%)
Sexual Behavior - Females 18+ that ever performed oral sex on a man (%)
Sexual Behavior - Females 18+ that ever had anal sex with a man (%)
Sexual Behavior - Females 18+ that ever had any kind of sex with a woman (%)
Sexual Behavior - Average age people first had sex
Sexual Behavior - Average number of female sex partners in lifetime (males 18+)
Sexual Behavior - Average number of female vaginal sex partners in lifetime (males 18+)
Sexual Behavior - Average age people first performed oral sex on a woman (18+)
Sexual Behavior - Average number of woman performed oral sex on in lifetime (18+)
Sexual Behavior - Average number of male sex partners in lifetime (males 18+)
Sexual Behavior - Average number of male anal sex partners in lifetime (males 18+)
Sexual Behavior - Average age people first performed oral sex on a man (18+)
Sexual Behavior - Average number of male oral sex partners in lifetime (18+)
Sexual Behavior - People using protection when performing oral sex (%)
Sexual Behavior - Average number of times people have vaginal or anal sex a year
Sexual Behavior - People having sex without condom (%)
Sexual Behavior - Average number of male sex partners in lifetime (females 18+)
Sexual Behavior - Average number of male vaginal sex partners in lifetime (females 18+)
Sexual Behavior - Average number of female sex partners in lifetime (females 18+)
Sexual Behavior - Circumcised males 18+ (%)
Sleep Disorders - Average hours sleeping at night
Sleep Disorders - People that has trouble sleeping (%)
Smoking-Cigarette Use - People smoking cigarettes (%)
Taste & Smell - People 40+ having problems with smell (%)
Taste & Smell - People 40+ having problems with taste (%)
Taste & Smell - People 40+ that ever had wisdom teeth removed (%)
Taste & Smell - People 40+ that ever had tonsils teeth removed (%)
Taste & Smell - People 40+ that ever had a loss of consciousness because of a head injury (%)
Taste & Smell - People 40+ that ever had a broken nose or other serious injury to face or skull (%)
Taste & Smell - People 40+ that ever had two or more sinus infections (%)
Weight - Average height (inches)
Weight - Average weight (pounds)
Weight - Average BMI
Weight - People that are obese (%)
Weight - People that ever were obese (%)
Weight - People trying to lose weight (%)
66,551 65.7% White alone 18,387 18.2% Hispanic 6,967 6.9% Asian alone 6,182 6.1% Two or more races 1,722 1.7% Black alone 825 0.8% Native Hawaiian and Other 432 0.4% American Indian alone 238 0.2% Other race alone
The City-Data.com crime index weighs serious crimes and violent crimes more heavily. Higher means more crime, U.S. average is 246.1. It adjusts for the number of visitors and daily workers commuting into cities.
- means the value is smaller than the state average.
- means the value is about the same as the state average.
- means the value is bigger than the state average.
- means the value is much bigger than the state average.
Crime rate in Chico detailed stats: murders, rapes, robberies, assaults, burglaries, thefts, arson Officers per 1,000 residents here:
0.91California average:
2.30
Latest news from Chico, CA collected exclusively by city-data.com from local newspapers, TV, and radio stations
Ancestries: American (7.9%), German (7.2%), European (6.5%), English (6.3%), Irish (4.2%), Italian (3.3%).
Current Local Time:
Land area: 27.7 square miles.
Population density: 3,651 people per square mile (average).
8,043 residents are foreign born (3.3% Latin America , 3.0% Asia , 1.0% Europe ).
This city:
8.1%California:
26.5%
Median real estate property taxes paid for housing units with mortgages in 2022: $3,732 (0.8%)Median real estate property taxes paid for housing units with no mortgage in 2022: $2,339 (0.5%)
Nearest city with pop. 200,000+: Sacramento, CA
Nearest city with pop. 1,000,000+: Los Angeles, CA
Nearest cities:
Latitude: 39.74 N, Longitude: 121.84 W
Chico nicknames or aliases (official or unofficial):
City of Roses, City of Trees, Almond Capital of the World, Where Everything GrowsDaytime population change due to commuting: +2,057 (+2.0%)Workers who live and work in this city: 37,982 (72.6%)
Chico tourist attractions:
Single-family new house construction building permits:
2022: 249 buildings , average cost: $212,9002021: 240 buildings , average cost: $215,3002020: 299 buildings , average cost: $216,5002019: 293 buildings , average cost: $188,3002018: 341 buildings , average cost: $224,6002017: 273 buildings , average cost: $204,3002016: 282 buildings , average cost: $206,4002015: 256 buildings , average cost: $202,2002014: 201 buildings , average cost: $198,4002013: 227 buildings , average cost: $211,3002012: 126 buildings , average cost: $203,5002011: 88 buildings , average cost: $200,4002010: 67 buildings , average cost: $183,3002009: 127 buildings , average cost: $208,8002008: 169 buildings , average cost: $186,4002007: 261 buildings , average cost: $187,7002006: 437 buildings , average cost: $155,7002005: 430 buildings , average cost: $160,9002004: 491 buildings , average cost: $152,9002003: 624 buildings , average cost: $134,8002002: 474 buildings , average cost: $126,7002001: 464 buildings , average cost: $137,9002000: 339 buildings , average cost: $139,6001999: 546 buildings , average cost: $121,9001998: 442 buildings , average cost: $119,6001997: 281 buildings , average cost: $108,800Unemployment in December 2023:
Most common occupations in Chico, CA (%)
Both Males Females
Cooks and food preparation workers (8.4%)
Other management occupations, except farmers and farm managers (4.9%)
Retail sales workers, except cashiers (4.6%)
Building and grounds cleaning and maintenance occupations (4.4%)
Cashiers (3.7%)
Secretaries and administrative assistants (3.5%)
Computer specialists (3.1%)
Cooks and food preparation workers (7.7%)
Building and grounds cleaning and maintenance occupations (6.5%)
Retail sales workers, except cashiers (5.3%)
Other management occupations, except farmers and farm managers (4.9%)
Computer specialists (4.9%)
Electrical equipment mechanics and other installation, maintenance, and repair workers, including supervisors (2.9%)
Top executives (2.8%)
Cooks and food preparation workers (9.1%)
Secretaries and administrative assistants (5.7%)
Cashiers (4.9%)
Other management occupations, except farmers and farm managers (4.9%)
Registered nurses (4.5%)
Waiters and waitresses (4.3%)
Retail sales workers, except cashiers (4.0%)
Earthquake activity:
Chico-area historical earthquake activity is significantly above California state average. It is 6543% greater than the overall U.S. average. On 4/18/1906 at 13:12:21, a magnitude 7.9 (7.9 UK, Class: Major, Intensity: VIII - XII) earthquake occurred 135.7 miles away from Chico center, causing $524,000,000 total damage On 1/31/1922 at 13:17:28, a magnitude 7.6 (7.6 UK) earthquake occurred 207.2 miles away from Chico center On 4/25/1992 at 18:06:04, a magnitude 7.2 (6.3 MB, 7.1 MS, 7.2 MW, 7.1 MW, Depth: 9.4 mi) earthquake occurred 125.5 miles away from the city center, causing $75,000,000 total damage On 10/3/1915 at 06:52:48, a magnitude 7.6 (7.6 UK) earthquake occurred 235.2 miles away from Chico center On 11/8/1980 at 10:27:34, a magnitude 7.2 (6.2 MB, 7.2 MS, 7.2 MW, 7.0 ML) earthquake occurred 160.7 miles away from Chico center On 1/22/1923 at 09:04:18, a magnitude 7.2 (7.2 UK) earthquake occurred 191.6 miles away from Chico center Magnitude types: body-wave magnitude (MB), local magnitude (ML), surface-wave magnitude (MS), moment magnitude (MW) Natural disasters: The number of natural disasters in Butte County (25) is a lot greater than the US average (15).Major Disasters (Presidential) Declared: 11Emergencies Declared: 4Floods: 12, Fires: 9, Winter Storms: 6, Storms: 5, Landslides: 4, Mudslides: 4, Drought: 1, Freeze: 1, Heavy Rain: 1, Hurricane: 1, Tornado: 1, Other: 1 (Note: some incidents may be assigned to more than one category). Main business address for: TRICO BANCSHARES / STATE COMMERCIAL BANKS ), LANDACORP INC SERVICES-BUSINESS SERVICES, NEC ).
Hospitals in Chico: CHICO COMMUNITY HOSPITAL (provides emergency services, 560 COHASSET RD) ENLOE MEDICAL CENTER (Voluntary non-profit - Private, provides emergency services, 1531 ESPLANADE) N T ENLOE MEMORIAL HOSP HOSPICE (1390 E LASSEN AVE) NOVA DEV CENTERS - ARCH WAY (1494 ARCH WAY) NOVA DEV CNTR-KELSEY HOUSE (13961 KELSEY DRIVE) NOVA DEVELOP CTR-TOM POLK (65 TOM POLK CIRCLE) Nursing Homes in Chico: CALIFORNIA PARK REHABILITATION HOSPITAL (2850 SIERRA SUNRISE TERRACE) CHICO COMM REHABILITATION HOSP D/P SNF (340 W EAST AVE) ENLOE MED CTR DP SNF (560 COHASSET ROAD) NORTH VALLEY NURSING AND REHAB CENTER (1645 ESPLANADE) RIVERSIDE CONV HOSP CHICO (375 COHASSET RD) TWIN OAKS POST ACUTE REHAB (1200 SPRINGFIELD DRIVE) WINDSOR CHICO CARE CENTER (188 COHASSET LANE) WINDSOR CHICO CREEK CARE AND REHABILITATION (587 RIO LINDO AVENUE) Dialysis Facilities in Chico: CHICO DIALYSIS CENTER (530 COHASSET ROAD) RAI CERES AVENUE, CHICO (3011 CERES AVENUE #125) SOUTH CHICO DIALYSIS CENTER (2345 FOREST AVENUE) Home Health Centers in Chico: BUTTE HOME HEALTH AND HOSPICE (10 CONSTITUTION DRIVE) ENLOE MEDICAL CENTER HOME HEALTH AGENCY (1390 E LASSEN AVE) HOME HEALTH CARE MANAGEMENT INC (1398 RIDGEWOOD DR) Airports and heliports located in Chico: Chico Municipal Airport (CIC) Runways: , Commercial Ops: 54, Air Taxi Ops: 10,937, Itinerant Ops: 19,231, Local Ops: 7,685, Military Ops: 12,253)Ranchaero Airport (CL56) Runways: , Itinerant Ops: 1,000, Local Ops: 4,000)Butte Creek Hog Ranch Airport (CL90) Runways: Johnsen Airport (4CA7) Runways: Enloe Hospital Heliport (CL37) See details about Airports and heliports located in Chico, CA Amtrak station: CHICO (W. 5TH & ORANGE STS.)
.
Services: partially wheelchair accessible, enclosed waiting area, public restrooms, public payphones, free short-term parking, free long-term parking, call for taxi service, intercity bus service, public transit connection.
College/University in Chico: California State University-Chico Full-time enrollment: 14,838; Location: First and Normal Sts; Public; Website: www.csuchico.edu; Offers Master's degree )
Other colleges/universities with over 2000 students near Chico:
Butte College (about 12 miles; Oroville, CA ; Full-time enrollment: 8,649)
Yuba College (about 46 miles; Marysville, CA ; FT enrollment: 4,737)
Shasta College (about 67 miles; Redding, CA ; FT enrollment: 5,645)
Sierra College (about 74 miles; Rocklin, CA ; FT enrollment: 11,488)
Universal Technical Institute of Northern California Inc (about 78 miles; Sacramento, CA ; FT enrollment: 3,193)
University of Phoenix-Sacramento Valley Campus (about 80 miles; Sacramento, CA ; FT enrollment: 2,855)
American River College (about 80 miles; Sacramento, CA ; FT enrollment: 20,452)
Biggest public high schools in Chico: PLEASANT VALLEY HIGH Students: 1,387, Location: 1475 E. AVE., Grades: 9-12)CHICO HIGH Students: 1,246, Location: 901 ESPLANADE, Grades: 9-12)CORE BUTTE CHARTER Students: 263, Location: 260 COHASSET RD., STE. 120, Grades: KG-12, Charter school )FAIR VIEW HIGH (CONTINUATION) Students: 100, Location: 290 EAST AVE., Grades: 9-12)OAKDALE Students: 43, Location: 290 EAST AVE., Grades: KG-12)ACADEMY FOR CHANGE Students: 31, Location: 290 EAST AVE., Grades: 7-12)LOMA VISTA Students: 11, Location: 2404 MARIGOLD AVE., Grades: KG-12)INSPIRE SCHOOL OF ARTS AND SCIENCES Location: 901 THE ESPLANADE, Grades: 9-12, Charter school )CENTER FOR ALTERNATIVE LEARNING Location: 290 E. AVE., Grades: 6-12)
PIVOT CHARTER SCHOOL NORTH VALLEY Location: 2550 LAKEW. DR., STE. 30, Grades: KG-12, Charter school )
Private high schools in Chico: CHAMPION CHRISTIAN SCHOOL Students: 75, Location: 1184 EAST AVE, Grades: 7-12)
PLEASANT VALLEY BAPTIST SCHOOL Students: 48, Location: 13539 GARNER LN, Grades: KG-12)
ROSE SCOTT LEARNING COMMUNITY Students: 19, Location: 850 PALMETTO AVENUE, Grades: 1-11)
Biggest public elementary/middle schools in Chico: BIDWELL JUNIOR HIGH Students: 715, Location: 2376 N. AVE., Grades: 7-8)MARSH (HARRY M.) JUNIOR HIGH Students: 588, Location: 2253 HUMBOLDT RD., Grades: 7-8)CHICO JUNIOR HIGH Students: 563, Location: 280 MEMORIAL WAY, Grades: 7-8)EMMA WILSON ELEMENTARY Students: 471, Location: 1530 W. EIGHTH AVE., Grades: KG-6)MCMANUS (JOHN A.) ELEMENTARY Students: 434, Location: 988 E. AVE., Grades: KG-6)SIERRA VIEW ELEMENTARY Students: 411, Location: 1598 HOOKER OAK AVE., Grades: KG-6)MARIGOLD ELEMENTARY Students: 391, Location: 2446 MARIGOLD AVE., Grades: KG-6)LITTLE CHICO CREEK ELEMENTARY Students: 390, Location: 2090 AMANDA WAY, Grades: KG-6)CHICO COUNTRY DAY Students: 347, Location: 102 W. 11TH ST., Grades: KG-8, Charter school )NEAL DOW ELEMENTARY Students: 317, Location: 1420 NEAL DOW AVE., Grades: KG-6)Private elementary/middle schools in Chico: CHICO CHRISTIAN SCHOOL Students: 491, Location: 2801 NOTRE DAME BLVD, Grades: PK-8)
NOTRE DAME SCHOOL Students: 205, Location: 435 HAZEL ST, Grades: KG-8)
KING'S CHRISTIAN SCHOOLTHE-AG Students: 100, Location: 1137 ARBUTUS AVE, Grades: PK-6)
CHICO OAKS ADVENTIST SCHOOL Students: 97, Location: 1859 HOOKER OAK AVE, Grades: KG-8)
See full list of schools located in Chico
Notable locations in Chico: (A) , Hooker Oak (B) , United States Department of Agriculture Plant Introduction Garden (C) , Canyon Oaks Golf Course (D) , Bidwell Municipal Golf Course (E) , Veterans Memorial Building (F) , Meriam Library (G) , Chico Fire Department Station 2 (H) , Chico Fire Department Station 1 (I) , Craig Hall (J) , Chico Museum (K) , Chico City Hall (L) , Chico Branch Butte County Library (M) , Chapman Neighborhood Center (N) , Bidwell Mansion (O) , First Responder Emergency Medical Services Station 32 (P) , First Responder Emergency Medical Services Station 31 (Q) , First Responder Emergency Medical Services Station 33 (R) , Enloe Rehabilitation Center (S) , Butte County Behavioral Health and Inpatient Services (T) . Display/hide their locations on the map
Shopping Center: (1) . Display/hide its location on the map
Main business address in Chico include: (A) , LANDACORP INC (B) . Display/hide their locations on the map
Churches in Chico include: (A) , Bidwell Memorial Presbyterian Church (B) , Calvary Southern Baptist Church (C) , Chico Gospel Hall (D) , Church of Christ (E) , Church of God (F) , The Church of Jesus Christ of Latter Day Saints (G) , Church of the Brethren (H) , First Assembly of God Church (I) . Display/hide their locations on the map
Cemetery: (1) . Display/hide its location on the map
Lake: (A) . Display/hide its location on the map
Streams, rivers, and creeks: (A) . Display/hide its location on the map
Parks in Chico include: (1) , Bidwell Park (2) , Bidwell River Park (3) , Depot Park (4) , Oak Way Park (5) , Silver Dollar Fairgrounds (6) , Twentieth Street Park (7) . Display/hide their locations on the map
Tourist attractions: (1) , Chico Creek Nature Center (Cultural Attractions- Events- & Facilities; 1968 East 8th Street) (2) , Almond Grove Mobile Home Park (Amusement & Theme Parks; 567 East Lassen Avenue Spc 704) (3) . Display/hide their approximate locations on the map
Hotels: (1) , Bed & Breakfast Espanade Bed & Breakfast (620 Esplanade) (2) , Budget Motel (2566 Esplanade) (3) , Budget Inn of Chico (1717 Park Avenue) (4) . Display/hide their approximate locations on the map
Courts: (1) , Butte County - Courts-Superior Court Of California-County Of Butt- Chico Courthouse- Tra (655 Oleander) (2) , United States Government Offices - Social Security Administration- Office Loca (2035 Forest Avenue) (3) , Butte County - Superior Court Of California-Butte County- Chico Courthouse- Civil-Small Cl (655 Oleander Avenue) (4) . Display/hide their approximate locations on the map
Birthplace of: Niki Tsongas - Politician, Aaron Rodgers - 2005 NFL player (Green Bay Packers, born : Dec 2, 1983), Clay Dalrymple - Baseball player, Kyle Lohse - 2005 Major League Baseball player (Minnesota Twins, born : Oct 4, 1978), Muddy Waters (American football) - Football coach, Pat Gillick - Baseball player, Evan MacLane - Baseball player, Justin Marler - Writer, Arleigh Williams - Football player, Donovan Scott - Actor.
Butte County has a predicted average indoor radon screening level less than 2 pCi/L (pico curies per liter) - Low Potential Drinking water stations with addresses in Chico and their reported violations in the past:
BUTTE CREEK ESTATES MUTUAL WATER CO (Population served: 399, Groundwater):
Past monitoring violations:
Monitoring and Reporting (DBP) - Between JAN-2012 and DEC-2012, Contaminant: TTHM. Follow-up actions: St Violation/Reminder Notice (JAN-10-2013), St Compliance achieved (JAN-10-2013)
Initial Tap Sampling for Pb and Cu - In JAN-10-2010, Contaminant: Lead and Copper Rule. Follow-up actions: St Compliance achieved (JAN-01-2010)
Initial Tap Sampling for Pb and Cu - In JAN-10-2010, Contaminant: Lead and Copper Rule
Initial Tap Sampling for Pb and Cu - In JUL-01-1993, Contaminant: Lead and Copper Rule. Follow-up actions: Fed Compliance achieved (SEP-30-2005)
2 regular monitoring violations
Population served: 250, Groundwater):
Past monitoring violations:
Initial Tap Sampling for Pb and Cu - In JUL-01-1993, Contaminant: Lead and Copper Rule. Follow-up actions: Fed Compliance achieved (SEP-30-2005)
3 routine major monitoring violations
6 regular monitoring violations
Population served: 100, Groundwater):
Past monitoring violations:
Initial Tap Sampling for Pb and Cu - In JUL-01-1993, Contaminant: Lead and Copper Rule. Follow-up actions: Fed Compliance achieved (SEP-30-2005)
2 routine major monitoring violations
2 regular monitoring violations
Address: 328 SOUTHGATE AVE Population served: 99, Groundwater):
Past monitoring violations:
Initial Tap Sampling for Pb and Cu - In JUL-01-1993, Contaminant: Lead and Copper Rule. Follow-up actions: Fed Compliance achieved (SEP-30-2005)
One regular monitoring violation
Population served: 80, Groundwater):
Past health violations:
MCL, Monthly (TCR) - In JUN-2008, Contaminant: Coliform. Follow-up actions: St Public Notif issued (JUN-13-2008), St Compliance achieved (JUN-17-2008), St Public Notif received (JUL-21-2008)
MCL, Monthly (TCR) - In JUN-2008, Contaminant: Coliform. Follow-up actions: St Public Notif issued (JUN-13-2008), St Compliance achieved (JUN-17-2008), St Public Notif received (JUL-21-2008)
MCL, Monthly (TCR) - In JUL-2005, Contaminant: Coliform. Follow-up actions: St Public Notif requested (JUL-26-2005), St Compliance achieved (AUG-08-2005)
MCL, Monthly (TCR) - In MAY-2005, Contaminant: Coliform. Follow-up actions: St Public Notif requested (MAY-23-2005), St Compliance achieved (AUG-08-2005)
Past monitoring violations:
Monitoring, Repeat Major (TCR) - In JUN-2005, Contaminant: Coliform (TCR). Follow-up actions: St Public Notif requested (JUL-26-2005), St Compliance achieved (AUG-08-2005)
2 minor monitoring violations
Population served: 75, Groundwater):
Past monitoring violations:
3 routine major monitoring violations
Population served: 60, Groundwater):
Past monitoring violations:
3 routine major monitoring violations
Population served: 50, Groundwater):
Past health violations:
MCL, Monthly (TCR) - In AUG-2011, Contaminant: Coliform. Follow-up actions: St AO (w/o penalty) issued (SEP-20-2011)
Drinking water stations with addresses in Chico that have no violations reported:
CAL-WATER SERVICE CO.-CHICO (Population served: 97,274, Primary Water Source Type: Groundwater)
CAL-WATER SERVICE CO.-MARYSVILLE (Population served: 12,017, Primary Water Source Type: Groundwater)
CAL-WATER SERVICE CO.-OROVILLE (Population served: 9,427, Primary Water Source Type: Surface water)
CAL-WATER SERVICE CO.-WILLOWS (Population served: 7,035, Primary Water Source Type: Groundwater)
PG&E ROCKY POINT CG, LAKE ALMANOR (Population served: 300, Primary Water Source Type: Groundwater)
PG&E HASKINS VLY CG, BUCKS LK. (Population served: 150, Primary Water Source Type: Groundwater)
PG&E PONDEROSA FLAT CG, LK ALM (Population served: 150, Primary Water Source Type: Groundwater)
ARBUCKLE WATER COMPANY (Population served: 136, Primary Water Source Type: Groundwater)
CAMPHORA APARTMENTS (Population served: 126, Primary Water Source Type: Groundwater)
WEST END WATER ASSOCIATION (Population served: 60, Primary Water Source Type: Groundwater)
Average household size: This city:
2.4 peopleCalifornia:
2.9 people
Percentage of family households: This city:
50.1%Whole state:
68.7%
Percentage of households with unmarried partners: This city:
8.9%Whole state:
7.2%
Likely homosexual households (counted as self-reported same-sex unmarried-partner households)
Lesbian couples: 0.6% of all households Gay men: 0.3% of all households
People in group quarters in Chico in 2010:
1,763 people in college/university student housing
577 people in nursing facilities/skilled-nursing facilities
321 people in emergency and transitional shelters (with sleeping facilities) for people experiencing homelessness
224 people in other noninstitutional facilities
171 people in group homes intended for adults
56 people in residential treatment centers for adults
56 people in workers' group living quarters and job corps centers
5 people in group homes for juveniles (non-correctional)
5 people in residential treatment centers for juveniles (non-correctional)
People in group quarters in Chico in 2000:
1,971 people in college dormitories (includes college quarters off campus)
486 people in nursing homes
353 people in other noninstitutional group quarters
123 people in homes or halfway houses for drug/alcohol abuse
69 people in homes for the physically handicapped
26 people in homes for the mentally retarded
19 people in other group homes
11 people in hospitals/wards and hospices for chronically ill
11 people in hospices or homes for chronically ill
3 people in homes for the mentally ill
2 people in religious group quarters
Banks with most branches in Chico (2011 data):
Tri Counties Bank: 9 branches. Info updated 2011/09/26: Bank assets: $2,554.4 mil, Deposits: $2,191.2 mil, local headquarters , positive income , Commercial Lending Specialization, 71 total offices , Holding Company: Trico Bancshares
Wells Fargo Bank, National Association: Chico Skyway Branch, North Chico Branch, Chico East Branch, Chico Main Branch. Info updated 2011/04/05: Bank assets: $1,161,490.0 mil, Deposits: $905,653.0 mil, headquarters in Sioux Falls, SD, positive income , 6395 total offices , Holding Company: Wells Fargo & Company
Bank of America, National Association: North Valley Plaza Branch, South Chico Branch, Chico Main Branch. Info updated 2009/11/18: Bank assets: $1,451,969.3 mil, Deposits: $1,077,176.8 mil, headquarters in Charlotte, NC, positive income , 5782 total offices , Holding Company: Bank Of America Corporation
Rabobank, National Association: North Chico Branch, Central Chico Branch, South Chico Branch. Info updated 2011/01/27: Bank assets: $11,745.0 mil, Deposits: $8,446.0 mil, headquarters in Roseville, CA, positive income , Agricultural Specialization, 124 total offices , Holding Company: Cooperatieve Centrale Raiffeisen-Boerenleenbank B.A., "rabobank Nederland
Umpqua Bank: Chico-Esplanade Branch, Chico Cbc, Chico Main Branch. Info updated 2011/09/02: Bank assets: $11,556.7 mil, Deposits: $9,325.3 mil, headquarters in Roseburg, OR, positive income , Commercial Lending Specialization, 193 total offices , Holding Company: Umpqua Holdings Corporation
JPMorgan Chase Bank, National Association: 801 East Avenue Branch at 801 East Avenue, Suite 245, branch established on 1998/10/03; 200 Broadway Branch at 200 Broadway Street, branch established on 1919/01/01. Info updated 2011/11/10: Bank assets: $1,811,678.0 mil, Deposits: $1,190,738.0 mil, headquarters in Columbus, OH, positive income , International Specialization, 5577 total offices , Holding Company: Jpmorgan Chase & Co.
U.S. Bank National Association: Chico Esplanade Branch at 2385 Esplanade, branch established on 2004/10/18; Chico Branch at 260 East Second Street, branch established on 1994/12/12. Info updated 2012/01/30: Bank assets: $330,470.8 mil, Deposits: $236,091.5 mil, headquarters in Cincinnati, OH, positive income , 3121 total offices , Holding Company: U.S. Bancorp
Golden Valley Bank: at 190 Cohasset Road, Suite 170, branch established on 2006/04/24. Info updated 2006/04/26: Bank assets: $110.7 mil, Deposits: $93.2 mil, local headquarters , positive income , Commercial Lending Specialization, 1 total offices
Northern California National Bank: at 1717 Mangrove Avenue, Suite 100, branch established on 2006/03/28. Info updated 2006/03/31: Bank assets: $110.5 mil, Deposits: $89.1 mil, local headquarters , positive income , 1 total offices
For population 15 years and over in Chico:
Never married: 49.1%Now married: 33.8%Separated: 1.3%Widowed: 5.0%Divorced: 10.7% For population 25 years and over in Chico:
High school or higher: 94.8%Bachelor's degree or higher: 45.4%Graduate or professional degree: 16.8%Unemployed: 9.5%Mean travel time to work (commute): 16.0 minutes
Education Gini index (Inequality in education) Here:
10.2California average:
15.5
Religion statistics for Chico, CA (based on Butte County data)
Religion Adherents Congregations Catholic 34,101 7 Evangelical Protestant 22,822 129 Other 11,031 36 Mainline Protestant 6,272 24 Black Protestant 475 4 Orthodox 280 2 None 145,019 -
Source: Clifford Grammich, Kirk Hadaway, Richard Houseal, Dale E.Jones, Alexei Krindatch, Richie Stanley and Richard H.Taylor. 2012. 2010 U.S.Religion Census: Religious Congregations & Membership Study. Association of Statisticians of American Religious Bodies. Jones, Dale E., et al. 2002. Congregations and Membership in the United States 2000. Nashville, TN: Glenmary Research Center. Graphs represent county-level data
Food Environment Statistics: Number of grocery stores : 50This county :
2.29 / 10,000 pop.State :
2.14 / 10,000 pop.
Number of supercenters and club stores : 2Butte County :
0.09 / 10,000 pop.State :
0.04 / 10,000 pop.
Number of convenience stores (no gas) : 18Butte County :
0.82 / 10,000 pop.California :
0.62 / 10,000 pop.
Number of convenience stores (with gas) : 49Here :
2.25 / 10,000 pop.State :
1.49 / 10,000 pop.
Number of full-service restaurants : 133Here :
6.10 / 10,000 pop.California :
7.42 / 10,000 pop.
Adult diabetes rate : Butte County :
9.0%State :
7.3%
Adult obesity rate : Butte County :
25.1%California :
21.3%
Low-income preschool obesity rate : Here :
12.3%California :
17.9%
Health and Nutrition: Healthy diet rate : Chico:
49.2%California:
49.4%
Average overall health of teeth and gums : Here:
49.3%California:
48.0%
Average BMI : This city:
27.8California:
28.1
People feeling badly about themselves : This city:
19.9%California:
20.2%
People not drinking alcohol at all : Chico:
10.4%California:
11.2%
Average hours sleeping at night : Overweight people : This city:
29.5%California:
31.5%
General health condition : Chico:
58.9%California:
56.4%
Average condition of hearing : More about Health and Nutrition of Chico, CA Residents
Local government employment and payroll (March 2022)
Function
Full-time employees
Monthly full-time payroll
Average yearly full-time wage
Part-time employees
Monthly part-time payroll
Police Protection - Officers
106 $987,174 $111,756 0 $0 Firefighters
62 $633,927 $122,696 3 $401 Police - Other
43 $215,745 $60,208 11 $38,882 Other and Unallocable
42 $271,760 $77,646 2 $6,687 Streets and Highways
32 $212,882 $79,831 1 $1,495 Financial Administration
22 $131,616 $71,791 0 $0 Other Government Administration
20 $166,224 $99,734 7 $823 Sewerage
18 $125,012 $83,341 0 $0 Parks and Recreation
12 $55,072 $55,072 1 $3,206 Natural Resources
6 $30,170 $60,340 0 $0 Housing and Community Development (Local)
3 $20,166 $80,664 0 $0 Airports
2 $13,694 $82,164 0 $0 Fire - Other
2 $10,441 $62,646 0 $0 Solid Waste Management
1 $9,445 $113,340 0 $0
Totals for Government
371 $2,883,327 $93,261 25 $51,494
Chico government finances - Expenditure in 2017 (per resident):
Construction - Regular Highways: $15,965,000 ($157.60)
Housing and Community Development: $10,391,000 ($102.58)Central Staff Services: $1,407,000 ($13.89)Local Fire Protection: $539,000 ($5.32)Police Protection: $321,000 ($3.17)Parks and Recreation: $115,000 ($1.14)Air Transportation: $8,000 ($0.08)Current Operations - Police Protection: $23,371,000 ($230.71)
Local Fire Protection: $14,257,000 ($140.74)Central Staff Services: $6,239,000 ($61.59)Sewerage: $5,889,000 ($58.13)Regular Highways: $5,863,000 ($57.88)Protective Inspection and Regulation - Other: $2,686,000 ($26.52)Financial Administration: $2,327,000 ($22.97)Parks and Recreation: $2,321,000 ($22.91)Transit Utilities: $2,293,000 ($22.64)Air Transportation: $1,902,000 ($18.78)Housing and Community Development: $1,621,000 ($16.00)Health - Other: $1,204,000 ($11.89)Parking Facilities: $665,000 ($6.56)General - Other: $23,000 ($0.23)General - Interest on Debt: $5,458,000 ($53.88)
Intergovernmental to Local - Other - General - Other: $176,000 ($1.74)
Other Capital Outlay - Central Staff Services: $46,000 ($0.45)
Air Transportation: $10,000 ($0.10)Sewerage: $6,000 ($0.06)Total Salaries and Wages: $225,000 ($2.22)
Chico government finances - Revenue in 2017 (per resident):
Charges - Sewerage: $14,737,000 ($145.48)
Other: $4,505,000 ($44.47)Parks and Recreation: $2,013,000 ($19.87)Parking Facilities: $1,182,000 ($11.67)Air Transportation: $542,000 ($5.35)Federal Intergovernmental - Air Transportation: $3,252,000 ($32.10)
Other: $2,565,000 ($25.32)Housing and Community Development: $452,000 ($4.46)Local Intergovernmental - Other: $2,914,000 ($28.77)
Housing and Community Development: $1,900,000 ($18.76)Transit Utilities: $1,000 ($0.01)Miscellaneous - Interest Earnings: $1,349,000 ($13.32)
Fines and Forfeits: $846,000 ($8.35)General Revenue - Other: $449,000 ($4.43)Rents: $186,000 ($1.84)Donations From Private Sources: $116,000 ($1.15)Revenue - Transit Utilities: $18,000 ($0.18)
State Intergovernmental - Highways: $1,982,000 ($19.57)
Sewerage: $1,942,000 ($19.17)Other: $1,434,000 ($14.16)General Local Government Support: $143,000 ($1.41)Tax - Property: $25,169,000 ($248.46)
General Sales and Gross Receipts: $24,144,000 ($238.34)Public Utilities Sales: $8,648,000 ($85.37)Other License: $7,126,000 ($70.35)Other Selective Sales: $2,712,000 ($26.77)Documentary and Stock Transfer: $386,000 ($3.81)Occupation and Business License - Other: $298,000 ($2.94)
Chico government finances - Debt in 2017 (per resident):
Long Term Debt - Beginning Outstanding - Unspecified Public Purpose: $136,454,000 ($1347.04)
Outstanding Unspecified Public Purpose: $128,353,000 ($1267.07)Retired Unspecified Public Purpose: $8,573,000 ($84.63)Issue, Unspecified Public Purpose: $473,000 ($4.67)
Chico government finances - Cash and Securities in 2017 (per resident):
Bond Funds - Cash and Securities: $34,256,000 ($338.17)
Other Funds - Cash and Securities: $108,631,000 ($1072.38)
Sinking Funds - Cash and Securities: $15,596,000 ($153.96)
Businesses in Chico, CA
Name Count Name Count
7-Eleven 4 Kmart 1 AMF Bowling 1 Kohl's 1 AT&T 3 Kroger 1 Aeropostale 1 La-Z-Boy 1 American Eagle Outfitters 1 Lane Furniture 2 Applebee's 1 LensCrafters 1 Arby's 1 Little Caesars Pizza 2 AutoZone 2 Lowe's 1 Avenue 1 Marriott 2 BMW 1 MasterBrand Cabinets 1 Barnes & Noble 1 McDonald's 4 Baskin-Robbins 3 Men's Wearhouse 1 Bath & Body Works 1 Motel 6 1 Bed Bath & Beyond 1 Motherhood Maternity 1 Ben & Jerry's 1 New Balance 2 Best Western 1 New York & Co 1 Budget Car Rental 1 Nike 10 Burger King 3 Nissan 1 CVS 3 Office Depot 1 Carl\s Jr. 2 Old Navy 1 Chevrolet 1 Olive Garden 1 Chico's 1 Outback 1 Circle K 2 Outback Steakhouse 1 Cold Stone Creamery 1 Pac Sun 1 Costco 1 Panda Express 1 Curves 1 Payless 2 Dairy Queen 2 Penske 1 Days Inn 1 Pier 1 Imports 1 Dennys 1 Quiznos 1 Discount Tire 1 RadioShack 2 Domino's Pizza 1 Red Lobster 1 Famous Footwear 1 Rite Aid 2 Fashion Bug 1 Sears 4 FedEx 15 Spencer Gifts 1 Finish Line 1 Sprint Nextel 2 Foot Locker 1 Starbucks 6 Ford 1 Subaru 1 Forever 21 1 Super 8 1 Fredericks Of Hollywood 1 T-Mobile 4 GNC 3 T.J.Maxx 1 GameStop 3 Taco Bell 3 Gap 1 Target 1 H&R Block 2 Toyota 1 Holiday Inn 1 Toys"R"Us 1 Hollister Co. 1 Trader Joe's 1 Home Depot 1 True Value 1 HomeTown Buffet 1 U-Haul 4 Honda 1 UPS 20 Hot Topic 1 Vans 5 IHOP 1 Verizon Wireless 2 JCPenney 1 Victoria's Secret 1 Jack In The Box 3 Volkswagen 1 Jamba Juice 2 Vons 3 Jones New York 2 Walgreens 3 Journeys 1 Walmart 1 Justice 1 Wendy's 1 KFC 2 Wet Seal 1 Kincaid 1
Strongest AM radio stations in Chico:
KPAY (1290 AM; 5 kW; CHICO, CA; Owner: CAPSTAR TX LIMITED PARTNERSHIP)
KKXX (930 AM; 1 kW; PARADISE, CA; Owner: BUTTE BROADCASTING COMPANY, INC.)
KFBK (1530 AM; 50 kW; SACRAMENTO, CA; Owner: AMFM RADIO LICENSES, L.L.C.)
KFIA (710 AM; 25 kW; CARMICHAEL, CA; Owner: VISTA BROADCASTING INC.)
KKOH (780 AM; 50 kW; RENO, NV; Owner: CITADEL BROADCASTING COMPANY)
KCBS (740 AM; 50 kW; SAN FRANCISCO, CA; Owner: INFINITY BROADCASTING OPERATIONS, INC.)
KHTK (1140 AM; 50 kW; SACRAMENTO, CA; Owner: INFINITY RADIO SUBSIDIARY OPERATIONS INC.)
KSTE (650 AM; 25 kW; RANCHO CORDOVA, CA; Owner: AMFM RADIO LICENSES, L.L.C.)
KTRB (860 AM; 50 kW; MODESTO, CA; Owner: PAPPAS RADIO OF CALIFORNIA, A CALIFORNIA LIMITED PARTNERSHIP)
KCBC (770 AM; 50 kW; RIVERBANK, CA; Owner: KIERTRON, INC.)
KNBR (680 AM; 50 kW; SAN FRANCISCO, CA; Owner: KNBR LICO, INC.)
KGO (810 AM; 50 kW; SAN FRANCISCO, CA; Owner: KGO-AM RADIO, INC.)
KTCT (1050 AM; 50 kW; SAN MATEO, CA; Owner: SUSQUEHANNA RADIO CORP.)
Strongest FM radio stations in Chico:
KYIX (104.9 FM; SOUTH OROVILLE, CA; Owner: BUTTE BROADCASTING COMPANY, INC.)
KLVC (88.3 FM; MAGALIA, CA; Owner: EDUCATIONAL MEDIA FOUNDATION)
K216CF (91.1 FM; CHICO, CA; Owner: YOUR CHRISTIAN COMPANION NETWORK, INC.)
KMXI (95.1 FM; CHICO, CA; Owner: CAPSTAR TX LIMITED PARTNERSHIP)
KZAP (96.7 FM; PARADISE, CA; Owner: REGENT LICENSEE OF CHICO, INC.)
KHSL-FM (103.5 FM; PARADISE, CA; Owner: CAPSTAR TX LIMITED PARTNERSHIP)
K258AQ (99.5 FM; YANKEE HILL, CA; Owner: CALVARY CHAPEL OF TWIN FALLS, INC.)
KFMF (93.9 FM; CHICO, CA; Owner: REGENT LICENSEE OF CHICO, INC)
KCHO (91.7 FM; CHICO, CA; Owner: UNIV. FOUNDATION/CA. ST. UNIV. CHICO)
KHAP (89.1 FM; CHICO, CA; Owner: FAMILY STATIONS, INC.)
KLRS (92.7 FM; CHICO, CA; Owner: RESULTS RADIO LICENSEE, LLC)
KZFR (90.1 FM; CHICO, CA; Owner: GOLDEN VALLEY COMMUNITY BROADCASTERS)
KRCX-FM (99.9 FM; MARYSVILLE, CA; Owner: ENTRAVISION HOLDINGS, LLC)
KHHZ (97.7 FM; OROVILLE, CA; Owner: CLEAR CHANNEL BROADCASTING LICENSES, INC.)
KMJE (101.5 FM; GRIDLEY, CA; Owner: RESULTS RADIO LICENSEE, LLC)
K213BZ (90.5 FM; RICHVALE, CA; Owner: FAMILY STATIONS, INC.)
KKCY (103.1 FM; COLUSA, CA; Owner: RESULTS RADIO LICENSEE, LLC)
K300AD (107.9 FM; CHICO, CA; Owner: REGENT LICENSEE OF CHICO, INC)
KHGQ (100.3 FM; QUINCY, CA; Owner: KEILY MILLER)
K205EJ (88.9 FM; CHESTER, CA; Owner: CALVARY CHAPEL OF TWIN FALLS, INC.)
TV broadcast stations around Chico:
KCVU (Channel 30; PARADISE, CA; Owner: SAINTE PARTNERS II, L.P.)
KNVN (Channel 24; CHICO, CA; Owner: CHICO LICENSE, L.L.C.)
K53FT (Channel 53; CHICO, CA; Owner: TRINITY BROADCASTING NETWORK)
K02OA (Channel 2; CHICO, CA; Owner: FAMILY STATIONS, INC.)
KHSL-TV (Channel 12; CHICO, CA; Owner: CATAMOUNT BROADCASTING OF CHICO-REDDING, INC.)
KKPM-CA (Channel 28; CHICO, CA; Owner: PAUL STRIEBY & MATT TUTER)
KZVU-LP (Channel 22; CHICO, CA; Owner: SAINTE PARTNERS II, L.P.)
National Bridge Inventory (NBI) Statistics 128 Number of bridges1,240ft / 378m Total length $4,908,000 Total costs1,457,388 Total average daily traffic103,273 Total average daily truck traffic
New bridges - historical statistics
3 1900-1909 5 1910-1919 6 1920-1929 9 1930-1939 6 1940-1949 12 1950-1959 64 1960-1969 6 1970-1979 8 1980-1989 6 1990-1999 3 2000-2009
See full National Bridge Inventory statistics for Chico, CA
Home Mortgage Disclosure Act Aggregated Statistics For Year 2009(Based on 8 full and 11 partial tracts) A) FHA, FSA/RHS & VA B) Conventional C) Refinancings D) Home Improvement Loans E) Loans on Dwellings For 5+ Families F) Non-occupant Loans on G) Loans On Manufactured Number Average Value Number Average Value Number Average Value Number Average Value Number Average Value Number Average Value Number Average Value
LOANS ORIGINATED 186 $230,540 266 $191,689 1,111 $204,677 37 $149,397 4 $2,016,858 170 $177,583 7 $96,339 APPLICATIONS APPROVED, NOT ACCEPTED 5 $199,348 17 $225,542 91 $221,565 16 $63,021 0 $0 17 $188,032 6 $41,967 APPLICATIONS DENIED 31 $199,655 46 $196,934 323 $223,103 33 $59,509 0 $0 60 $194,108 10 $41,022 APPLICATIONS WITHDRAWN 19 $229,065 29 $189,100 274 $216,967 8 $113,919 0 $0 36 $175,431 2 $105,370 FILES CLOSED FOR INCOMPLETENESS 8 $189,842 7 $239,267 57 $217,427 2 $274,530 0 $0 7 $140,294 0 $0
Aggregated Statistics For Year 2008(Based on 8 full and 11 partial tracts) A) FHA, FSA/RHS & VA B) Conventional C) Refinancings D) Home Improvement Loans E) Loans on Dwellings For 5+ Families F) Non-occupant Loans on G) Loans On Manufactured Number Average Value Number Average Value Number Average Value Number Average Value Number Average Value Number Average Value Number Average Value
LOANS ORIGINATED 96 $243,604 380 $207,486 534 $207,373 41 $83,103 7 $1,381,184 169 $189,685 8 $38,802 APPLICATIONS APPROVED, NOT ACCEPTED 6 $244,900 50 $212,262 86 $240,664 12 $44,743 1 $250,000 30 $207,252 6 $56,325 APPLICATIONS DENIED 11 $199,642 82 $257,069 290 $232,743 49 $118,248 0 $0 69 $219,340 13 $84,702 APPLICATIONS WITHDRAWN 12 $222,536 52 $250,282 177 $244,390 11 $179,486 0 $0 40 $206,612 1 $44,100 FILES CLOSED FOR INCOMPLETENESS 3 $258,513 16 $240,150 35 $253,195 3 $68,460 0 $0 11 $263,175 0 $0
Aggregated Statistics For Year 2007(Based on 8 full and 11 partial tracts) A) FHA, FSA/RHS & VA B) Conventional C) Refinancings D) Home Improvement Loans E) Loans on Dwellings For 5+ Families F) Non-occupant Loans on G) Loans On Manufactured Number Average Value Number Average Value Number Average Value Number Average Value Number Average Value Number Average Value Number Average Value
LOANS ORIGINATED 20 $282,332 702 $208,908 734 $204,646 111 $124,900 20 $1,158,656 295 $197,260 11 $136,288 APPLICATIONS APPROVED, NOT ACCEPTED 0 $0 73 $222,059 163 $218,957 17 $112,014 0 $0 35 $199,580 8 $73,549 APPLICATIONS DENIED 4 $227,270 188 $233,387 435 $230,267 71 $116,603 3 $370,710 107 $225,657 22 $64,619 APPLICATIONS WITHDRAWN 3 $278,290 74 $208,371 217 $244,050 19 $147,200 2 $836,700 48 $213,544 2 $53,010 FILES CLOSED FOR INCOMPLETENESS 1 $250,000 40 $234,748 63 $257,150 4 $285,020 0 $0 14 $234,812 0 $0
Aggregated Statistics For Year 2006(Based on 8 full and 11 partial tracts) A) FHA, FSA/RHS & VA B) Conventional C) Refinancings D) Home Improvement Loans E) Loans on Dwellings For 5+ Families F) Non-occupant Loans on G) Loans On Manufactured Number Average Value Number Average Value Number Average Value Number Average Value Number Average Value Number Average Value Number Average Value
LOANS ORIGINATED 8 $245,524 921 $204,673 1,097 $208,155 154 $92,296 14 $1,189,827 431 $202,889 6 $111,965 APPLICATIONS APPROVED, NOT ACCEPTED 0 $0 132 $186,650 173 $214,913 36 $117,335 2 $261,140 68 $210,366 3 $58,997 APPLICATIONS DENIED 2 $205,585 239 $213,431 429 $231,156 69 $100,274 1 $573,840 110 $284,651 11 $107,389 APPLICATIONS WITHDRAWN 2 $266,750 141 $223,884 416 $212,152 30 $176,540 2 $174,350 53 $214,468 1 $179,040 FILES CLOSED FOR INCOMPLETENESS 0 $0 25 $229,782 70 $235,648 8 $150,408 0 $0 23 $214,222 0 $0
Aggregated Statistics For Year 2005(Based on 8 full and 11 partial tracts) A) FHA, FSA/RHS & VA B) Conventional C) Refinancings D) Home Improvement Loans E) Loans on Dwellings For 5+ Families F) Non-occupant Loans on G) Loans On Manufactured Number Average Value Number Average Value Number Average Value Number Average Value Number Average Value Number Average Value Number Average Value
LOANS ORIGINATED 1 $175,000 1,141 $211,441 1,423 $202,612 188 $112,551 16 $1,001,451 530 $202,496 9 $110,722 APPLICATIONS APPROVED, NOT ACCEPTED 0 $0 142 $200,154 186 $199,690 30 $112,822 1 $406,470 55 $188,846 8 $86,968 APPLICATIONS DENIED 3 $132,913 223 $191,927 417 $211,046 84 $78,041 3 $520,533 97 $208,980 14 $72,160 APPLICATIONS WITHDRAWN 2 $143,500 146 $190,898 439 $207,310 38 $138,683 2 $871,370 84 $194,517 4 $129,607 FILES CLOSED FOR INCOMPLETENESS 0 $0 20 $220,838 114 $212,611 9 $153,302 0 $0 11 $167,955 0 $0
Aggregated Statistics For Year 2004(Based on 8 full and 11 partial tracts) A) FHA, FSA/RHS & VA B) Conventional C) Refinancings D) Home Improvement Loans E) Loans on Dwellings For 5+ Families F) Non-occupant Loans on G) Loans On Manufactured Number Average Value Number Average Value Number Average Value Number Average Value Number Average Value Number Average Value Number Average Value
LOANS ORIGINATED 14 $177,088 1,269 $194,839 1,631 $170,245 176 $99,465 15 $716,670 620 $181,259 10 $68,407 APPLICATIONS APPROVED, NOT ACCEPTED 0 $0 132 $184,269 211 $166,569 42 $86,683 1 $463,130 69 $161,426 10 $79,920 APPLICATIONS DENIED 0 $0 178 $179,733 422 $158,162 85 $58,830 0 $0 108 $174,679 22 $60,986 APPLICATIONS WITHDRAWN 0 $0 114 $188,882 421 $173,620 28 $125,305 1 $597,000 59 $180,111 2 $60,985 FILES CLOSED FOR INCOMPLETENESS 0 $0 29 $179,576 122 $184,453 11 $93,265 1 $368,000 17 $191,519 1 $186,030
Aggregated Statistics For Year 2003(Based on 8 full and 11 partial tracts) A) FHA, FSA/RHS & VA B) Conventional C) Refinancings D) Home Improvement Loans E) Loans on Dwellings For 5+ Families F) Non-occupant Loans on Number Average Value Number Average Value Number Average Value Number Average Value Number Average Value Number Average Value
LOANS ORIGINATED 25 $149,274 1,110 $168,650 3,412 $142,875 96 $43,503 26 $1,178,943 771 $140,756 APPLICATIONS APPROVED, NOT ACCEPTED 1 $109,740 106 $164,704 319 $145,617 37 $31,418 1 $3,205,840 73 $143,580 APPLICATIONS DENIED 1 $157,000 123 $153,201 513 $140,916 49 $34,553 3 $826,000 104 $141,644 APPLICATIONS WITHDRAWN 3 $89,217 125 $166,779 549 $142,256 9 $76,686 0 $0 98 $134,823 FILES CLOSED FOR INCOMPLETENESS 1 $158,000 21 $182,708 92 $155,593 6 $79,595 1 $320,540 15 $137,396
Aggregated Statistics For Year 2002(Based on 4 full and 6 partial tracts) A) FHA, FSA/RHS & VA B) Conventional C) Refinancings D) Home Improvement Loans E) Loans on Dwellings For 5+ Families F) Non-occupant Loans on Number Average Value Number Average Value Number Average Value Number Average Value Number Average Value Number Average Value
LOANS ORIGINATED 17 $130,138 606 $146,686 1,361 $134,067 40 $37,398 6 $1,458,482 306 $120,518 APPLICATIONS APPROVED, NOT ACCEPTED 1 $136,790 51 $144,821 119 $135,507 20 $37,407 0 $0 24 $131,863 APPLICATIONS DENIED 5 $110,942 72 $113,449 204 $114,833 40 $28,897 0 $0 51 $113,932 APPLICATIONS WITHDRAWN 5 $136,530 71 $145,219 193 $121,777 8 $36,978 0 $0 31 $117,102 FILES CLOSED FOR INCOMPLETENESS 1 $71,350 19 $141,934 42 $130,524 1 $40,750 0 $0 8 $91,385
Aggregated Statistics For Year 2001(Based on 4 full and 6 partial tracts) A) FHA, FSA/RHS & VA B) Conventional C) Refinancings D) Home Improvement Loans E) Loans on Dwellings For 5+ Families F) Non-occupant Loans on Number Average Value Number Average Value Number Average Value Number Average Value Number Average Value Number Average Value
LOANS ORIGINATED 41 $120,782 606 $120,279 1,130 $125,394 54 $22,586 3 $774,510 290 $110,425 APPLICATIONS APPROVED, NOT ACCEPTED 2 $86,850 52 $108,783 106 $113,468 11 $35,904 0 $0 26 $106,987 APPLICATIONS DENIED 4 $123,755 61 $97,817 185 $109,563 36 $19,032 0 $0 24 $97,776 APPLICATIONS WITHDRAWN 8 $114,382 61 $117,982 152 $107,010 11 $30,396 0 $0 32 $122,377 FILES CLOSED FOR INCOMPLETENESS 0 $0 12 $128,288 49 $118,020 2 $18,240 0 $0 11 $112,713
Aggregated Statistics For Year 2000(Based on 4 full and 6 partial tracts) A) FHA, FSA/RHS & VA B) Conventional C) Refinancings D) Home Improvement Loans E) Loans on Dwellings For 5+ Families F) Non-occupant Loans on Number Average Value Number Average Value Number Average Value Number Average Value Number Average Value Number Average Value
LOANS ORIGINATED 77 $106,459 526 $108,262 235 $96,218 54 $24,959 10 $713,418 122 $99,376 APPLICATIONS APPROVED, NOT ACCEPTED 5 $102,364 47 $97,550 36 $94,613 28 $23,056 1 $3,316,370 11 $87,123 APPLICATIONS DENIED 11 $108,986 108 $79,644 137 $83,843 40 $19,739 0 $0 20 $93,168 APPLICATIONS WITHDRAWN 6 $97,207 49 $108,616 87 $69,214 8 $28,425 0 $0 10 $67,470 FILES CLOSED FOR INCOMPLETENESS 2 $81,270 9 $105,363 20 $101,160 2 $36,475 0 $0 3 $128,833
Aggregated Statistics For Year 1999(Based on 6 full and 8 partial tracts) A) FHA, FSA/RHS & VA B) Conventional C) Refinancings D) Home Improvement Loans E) Loans on Dwellings For 5+ Families F) Non-occupant Loans on Number Average Value Number Average Value Number Average Value Number Average Value Number Average Value Number Average Value
LOANS ORIGINATED 168 $103,517 777 $105,930 725 $94,582 79 $24,013 19 $194,572 251 $84,754 APPLICATIONS APPROVED, NOT ACCEPTED 6 $103,643 64 $93,878 119 $101,213 34 $16,520 2 $85,995 23 $87,230 APPLICATIONS DENIED 15 $96,837 142 $91,307 278 $82,818 58 $19,975 4 $242,355 36 $84,350 APPLICATIONS WITHDRAWN 14 $99,223 90 $114,081 220 $95,826 12 $30,613 3 $481,753 22 $109,697 FILES CLOSED FOR INCOMPLETENESS 3 $93,727 15 $123,155 49 $100,441 2 $95,550 3 $3,871,000 3 $82,573
Detailed mortgage data for all 17 tracts in Chico, CA
Private Mortgage Insurance Companies Aggregated Statistics For Year 2009(Based on 7 full and 9 partial tracts) A) Conventional B) Refinancings C) Non-occupant Loans on Number Average Value Number Average Value Number Average Value
LOANS ORIGINATED 25 $253,401 25 $266,172 1 $250,000 APPLICATIONS APPROVED, NOT ACCEPTED 6 $287,142 8 $255,994 0 $0 APPLICATIONS DENIED 3 $224,210 5 $251,098 0 $0 APPLICATIONS WITHDRAWN 1 $355,420 1 $208,530 0 $0 FILES CLOSED FOR INCOMPLETENESS 0 $0 0 $0 0 $0
Aggregated Statistics For Year 2008(Based on 8 full and 11 partial tracts) A) Conventional B) Refinancings C) Non-occupant Loans on Number Average Value Number Average Value Number Average Value
LOANS ORIGINATED 80 $267,731 32 $285,639 8 $238,438 APPLICATIONS APPROVED, NOT ACCEPTED 48 $295,790 15 $283,765 10 $240,911 APPLICATIONS DENIED 4 $231,670 6 $253,705 3 $265,333 APPLICATIONS WITHDRAWN 3 $352,247 1 $396,860 0 $0 FILES CLOSED FOR INCOMPLETENESS 0 $0 0 $0 0 $0
Aggregated Statistics For Year 2007(Based on 8 full and 11 partial tracts) A) Conventional B) Refinancings C) Non-occupant Loans on Number Average Value Number Average Value Number Average Value
LOANS ORIGINATED 112 $270,743 36 $296,835 17 $239,149 APPLICATIONS APPROVED, NOT ACCEPTED 10 $275,049 14 $336,078 3 $339,440 APPLICATIONS DENIED 3 $299,763 2 $406,000 0 $0 APPLICATIONS WITHDRAWN 0 $0 1 $421,140 0 $0 FILES CLOSED FOR INCOMPLETENESS 0 $0 0 $0 0 $0
Aggregated Statistics For Year 2006(Based on 8 full and 10 partial tracts) A) Conventional B) Refinancings C) Non-occupant Loans on Number Average Value Number Average Value Number Average Value
LOANS ORIGINATED 20 $270,828 20 $304,193 3 $160,017 APPLICATIONS APPROVED, NOT ACCEPTED 5 $254,380 3 $322,823 0 $0 APPLICATIONS DENIED 0 $0 1 $324,000 0 $0 APPLICATIONS WITHDRAWN 0 $0 1 $259,110 0 $0 FILES CLOSED FOR INCOMPLETENESS 0 $0 1 $324,000 0 $0
Aggregated Statistics For Year 2005(Based on 8 full and 11 partial tracts) A) Conventional B) Refinancings C) Non-occupant Loans on Number Average Value Number Average Value Number Average Value
LOANS ORIGINATED 41 $266,899 24 $232,897 14 $261,126 APPLICATIONS APPROVED, NOT ACCEPTED 7 $255,604 6 $242,590 3 $229,427 APPLICATIONS DENIED 0 $0 0 $0 0 $0 APPLICATIONS WITHDRAWN 2 $252,725 1 $369,730 2 $207,145 FILES CLOSED FOR INCOMPLETENESS 0 $0 0 $0 0 $0
Aggregated Statistics For Year 2004(Based on 8 full and 11 partial tracts) A) Conventional B) Refinancings C) Non-occupant Loans on Number Average Value Number Average Value Number Average Value
LOANS ORIGINATED 111 $229,502 28 $219,512 25 $196,596 APPLICATIONS APPROVED, NOT ACCEPTED 25 $211,729 12 $196,503 6 $200,927 APPLICATIONS DENIED 1 $210,000 0 $0 0 $0 APPLICATIONS WITHDRAWN 3 $194,033 2 $205,370 2 $201,050 FILES CLOSED FOR INCOMPLETENESS 0 $0 0 $0 0 $0
Aggregated Statistics For Year 2003(Based on 8 full and 11 partial tracts) A) Conventional B) Refinancings C) Non-occupant Loans on Number Average Value Number Average Value Number Average Value
LOANS ORIGINATED 199 $189,967 84 $169,882 33 $174,487 APPLICATIONS APPROVED, NOT ACCEPTED 36 $171,133 28 $179,462 8 $152,756 APPLICATIONS DENIED 4 $208,650 3 $186,930 2 $184,300 APPLICATIONS WITHDRAWN 9 $175,861 5 $155,112 1 $159,720 FILES CLOSED FOR INCOMPLETENESS 1 $167,000 0 $0 0 $0
Aggregated Statistics For Year 2002(Based on 4 full and 6 partial tracts) A) Conventional B) Refinancings C) Non-occupant Loans on Number Average Value Number Average Value Number Average Value
LOANS ORIGINATED 128 $165,318 52 $150,315 22 $129,000 APPLICATIONS APPROVED, NOT ACCEPTED 20 $138,354 14 $167,078 5 $101,332 APPLICATIONS DENIED 1 $165,650 2 $186,850 0 $0 APPLICATIONS WITHDRAWN 3 $147,060 1 $121,760 1 $183,960 FILES CLOSED FOR INCOMPLETENESS 0 $0 1 $131,000 0 $0
Aggregated Statistics For Year 2001(Based on 4 full and 6 partial tracts) A) Conventional B) Refinancings C) Non-occupant Loans on Number Average Value Number Average Value Number Average Value
LOANS ORIGINATED 157 $140,417 72 $146,397 31 $111,036 APPLICATIONS APPROVED, NOT ACCEPTED 17 $142,810 22 $140,779 4 $122,388 APPLICATIONS DENIED 5 $138,552 0 $0 4 $139,965 APPLICATIONS WITHDRAWN 2 $100,500 2 $169,280 1 $131,000 FILES CLOSED FOR INCOMPLETENESS 1 $119,460 1 $62,360 0 $0
Aggregated Statistics For Year 2000(Based on 4 full and 6 partial tracts) A) Conventional B) Refinancings C) Non-occupant Loans on Number Average Value Number Average Value Number Average Value
LOANS ORIGINATED 166 $117,811 22 $130,093 17 $92,353 APPLICATIONS APPROVED, NOT ACCEPTED 21 $123,295 3 $129,347 3 $88,397 APPLICATIONS DENIED 3 $70,590 1 $95,500 0 $0 APPLICATIONS WITHDRAWN 4 $115,412 2 $120,000 0 $0 FILES CLOSED FOR INCOMPLETENESS 1 $42,500 0 $0 1 $42,500
Aggregated Statistics For Year 1999(Based on 6 full and 8 partial tracts) A) Conventional B) Refinancings C) Non-occupant Loans on Number Average Value Number Average Value Number Average Value
LOANS ORIGINATED 228 $120,503 64 $123,097 24 $102,515 APPLICATIONS APPROVED, NOT ACCEPTED 27 $107,684 17 $137,884 3 $120,523 APPLICATIONS DENIED 8 $126,456 5 $140,086 1 $134,190 APPLICATIONS WITHDRAWN 2 $136,820 3 $147,630 0 $0 FILES CLOSED FOR INCOMPLETENESS 4 $143,452 3 $130,443 1 $53,740
Fire-safe hotels and motels in Chico, California:
Best Western Heritage Inn, Chico, 25 Heritage Ln, Chico, California 95926 Phone: (530) 894-8600, Fax: (530) 894-8600
Oxford Suites, 2035 Business Ln, Chico, California 95928 Phone: (530) 899-9090, Fax: (530) 899-9476
Americas Best Value Inn, 740 Broadway St, Chico, California 95928 Phone: (530) 343-3286
Ramada Plaza, 685 Manazanita Ct, Chico, California 95926 Phone: (530) 345-2491, Fax: (530) 893-3040
Courtyard By Marriott, 2481 Carmichael Dr, Chico, California 95928 Phone: (530) 894-6699, Fax: (530) 894-6696
Residence Inn By Marriott Chico, 2485 Carmichael Dr, Chico, California 95928 Phone: (530) 894-5500, Fax: (530) 894-5511
Heritage Inn Express, Chico, 725 S Broadway, Chico, California 95928 Phone: (530) 343-4527, Fax: (530) 343-4940
Safari Garden Motel, 2352 Esplanade, Chico, California 95926 Phone: (530) 343-3201, Fax: (530) 343-2364
4 other hotels and motels
All 12 fire-safe hotels and motels in Chico, California
Most common first names in Chico, CA among deceased individuals Name Count Lived (average)
Mary 385 81.6 years John 378 76.3 years William 372 75.3 years Robert 329 73.6 years James 308 73.1 years George 238 78.1 years Charles 227 76.2 years Helen 199 81.6 years Dorothy 197 80.4 years Ruth 171 81.2 years
Most common last names in Chico, CA among deceased individuals Last name Count Lived (average)
Smith 216 77.5 years Johnson 140 76.7 years Jones 135 77.2 years Brown 122 78.8 years Miller 108 76.1 years Anderson 90 76.2 years Davis 88 74.2 years Williams 74 75.1 years Moore 69 76.1 years Martin 67 74.8 years
Chico compared to California state average:
Median house value below state average. Black race population percentage below state average. Foreign-born population percentage below state average. Length of stay since moving in significantly below state average. Number of college students significantly above state average. Percentage of population with a bachelor's degree or higher above state average.
#3 on the list of "Top 101 cities with largest percentage of workers with very short commute times (9 minutes or less) (population 50,000+)"
#24 on the list of "Top 101 cities with largest percentage of females in occupations: fire fighting and prevention workers including supervisors (population 50,000+)"
#26 on the list of "Top 101 larger cities with the highest increase in household income from 2000 (population 50,000+)"
#27 on the list of "Top 101 cities with largest percentage of females in occupations: community and social service occupations (population 50,000+)"
#27 on the list of "Top 100 cities with shortest commuting times (pop. 50,000+)"
#40 on the list of "Top 101 cities with the highest number of arson incidents per 100,000 residents, excludes tourist destinations and others with a lot of outsiders visiting based on city industries data (population 50,000+)"
#40 on the list of "Top 101 cities with the highest average snowfall in a year (population 50,000+)"
#45 on the list of "Top 101 cities with the most people born in the same U.S. state as the city (population 50,000+)"
#49 on the list of "Top 100 cities with strongest arts, entertainment, recreation, accommodation and food services industries (pop. 50,000+)"
#54 on the list of "Top 100 cities with highest percentage of college students (pop. 50,000+)"
#56 on the list of "Top 101 cities with largest percentage of males in occupations: farming, fishing, and forestry occupations (population 50,000+)"
#58 on the list of "Top 101 cities with largest percentage of males in industries: information (population 50,000+)"
#62 on the list of "Top 101 cities with the most people taking a bicycle to work (population 5,000+)"
#72 on the list of "Top 100 cities with youngest residents (pop. 50,000+)"
#73 on the list of "Top 101 cities with largest percentage of males in industries: agriculture, forestry, fishing and hunting (population 50,000+)"
#76 on the list of "Top 101 cities with the lowest minimum monthly morning or afternoon humidity (population 50,000+)"
#79 on the list of "Top 101 cities with the highest maximum monthly sunshine amount (population 50,000+)"
#80 on the list of "Top 101 cities with the largest differences between morning and afternoon humidity (population 50,000+)"
#80 on the list of "Top 101 cities with the largest humidity differences during a year (population 50,000+)"
#81 on the list of "Top 101 cities with the lowest number of police officers per 1000 residents (population 50,000+)"
#12 on the list of "Top 101 counties with the lowest lead air pollution readings in 2012 (µg/m3 )"
#15 on the list of "Top 101 counties with the highest carbon monoxide air pollution readings in 2012 (ppm)"
#17 on the list of "Top 101 counties with the highest lead air pollution readings in 2012 (µg/m3 )"
#18 on the list of "Top 101 counties with highest percentage of residents voting for 3rd party candidates in the 2012 Presidential Election (pop. 50,000+)"
#37 on the list of "Top 101 counties with the lowest percentage of residents relocating to foreign countries in 2011"
Top Patent Applicants
Nathan Aronson (15)
Clifford Alan Zitlaw (10)
John Strisower (8)
Daniel M. Veidlinger (7)
Gregory M. Sanger (7)
Julie Anne Heath (5)
Daniel Marc Veidlinger (5)
Michael R. Rubio (4)
Zafir Anjum (3)
Scott Laine (3)
Total of 189 patent applications in 2008-2024.
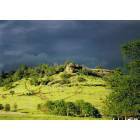


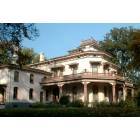
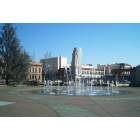
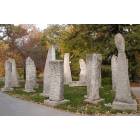
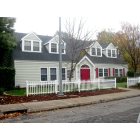
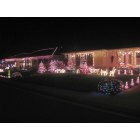

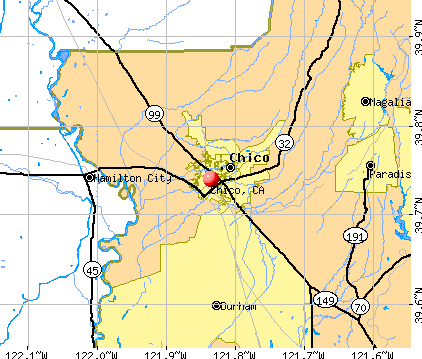


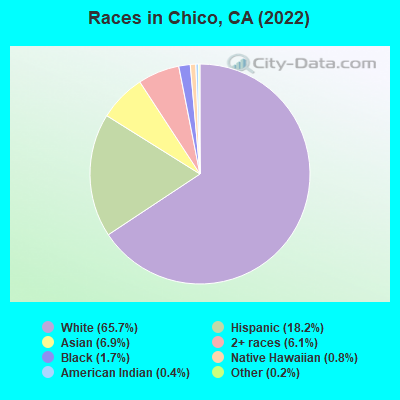
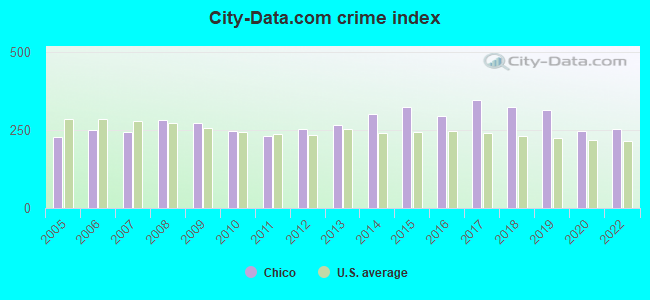
 Recent articles from our blog. Our writers, many of them Ph.D. graduates or candidates, create easy-to-read articles on a wide variety of topics.

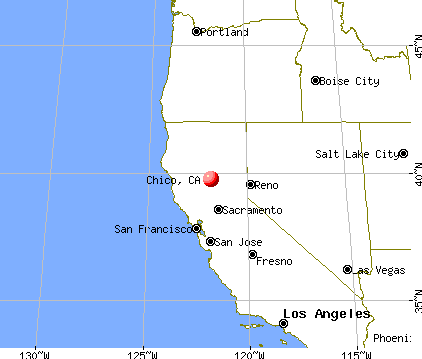
 (84.2 miles
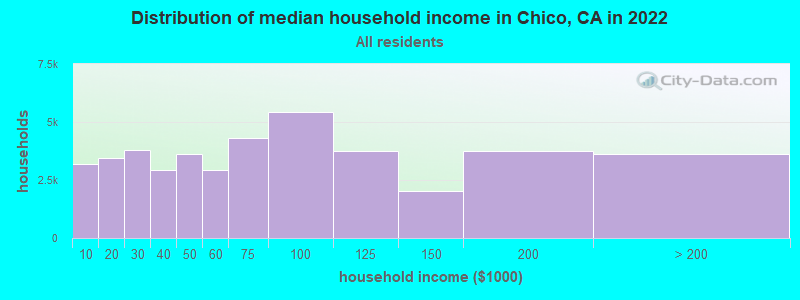
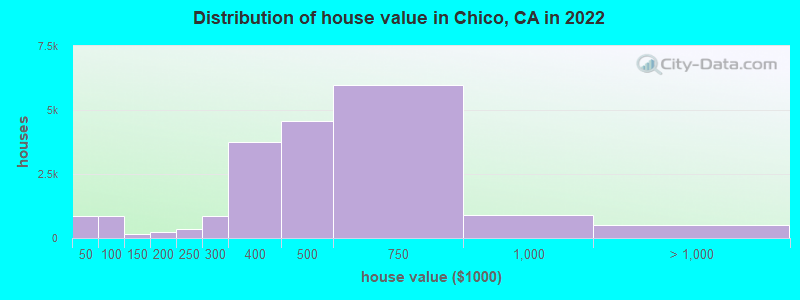
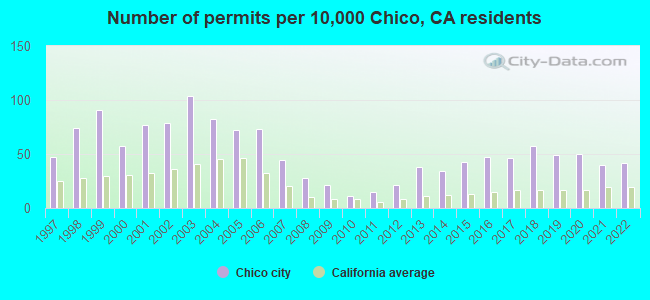
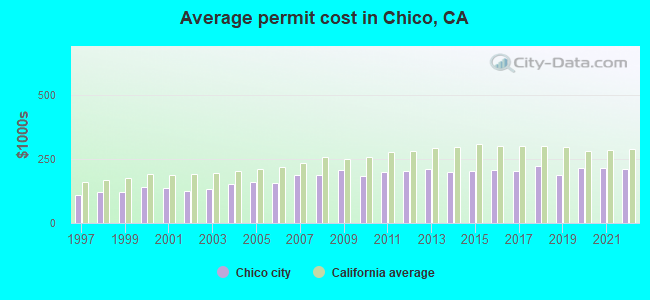
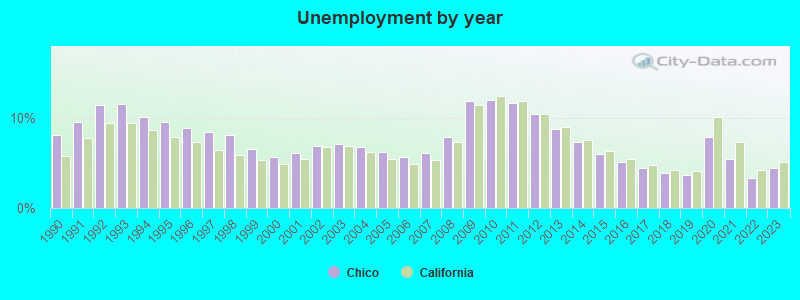
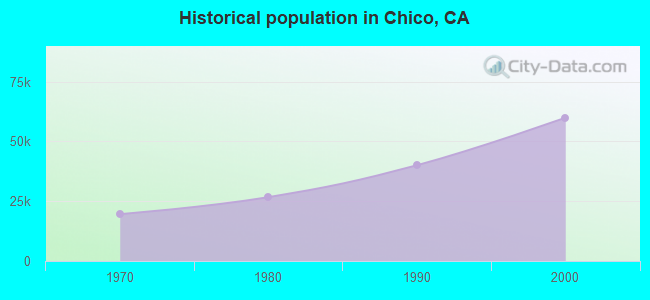
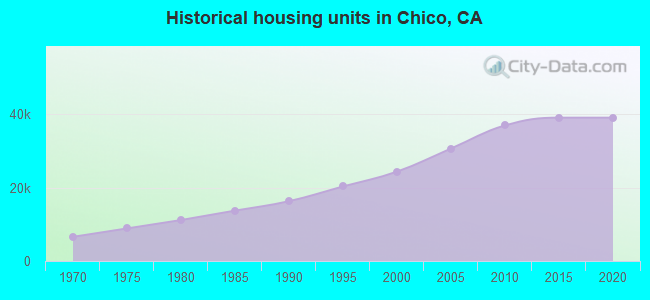
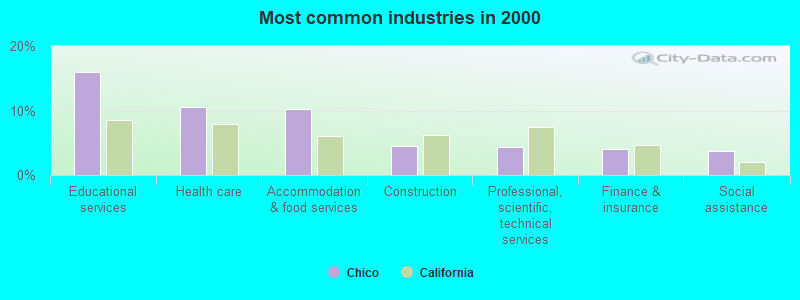
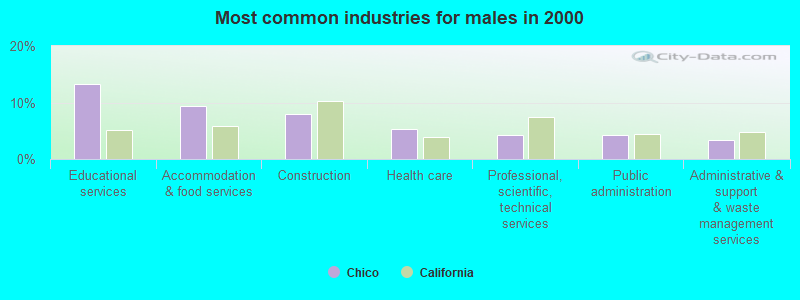
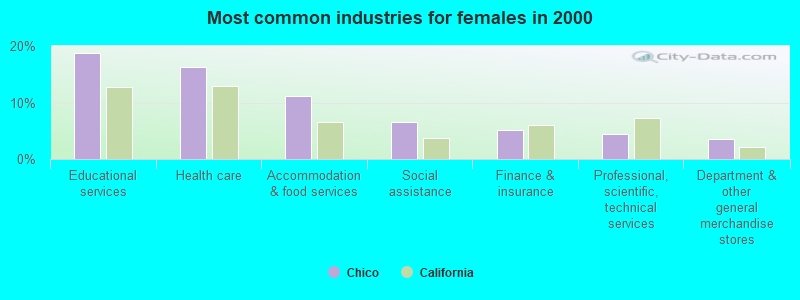
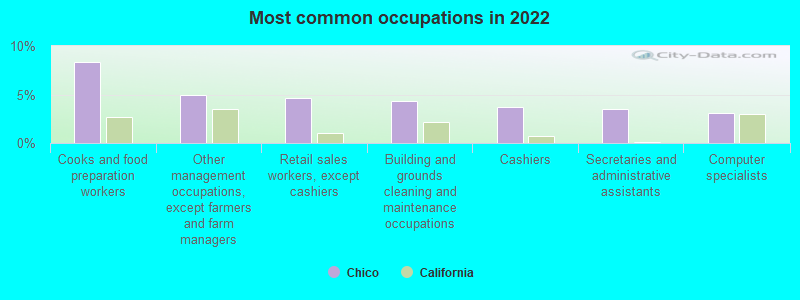
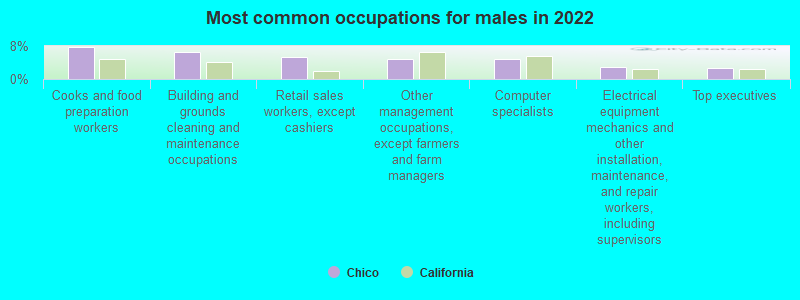
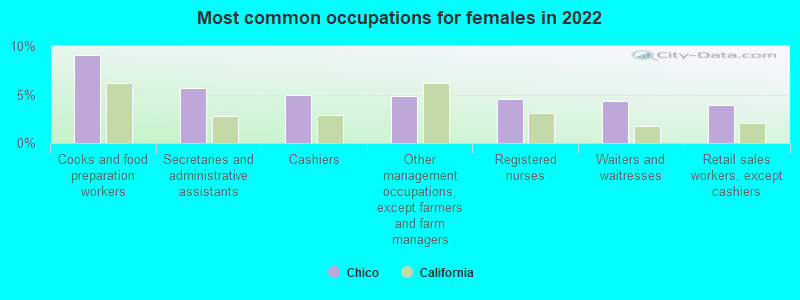

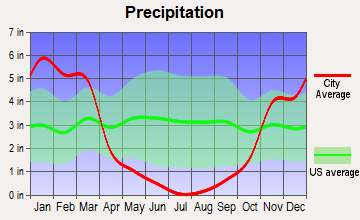
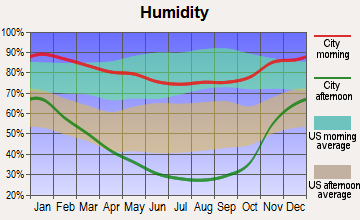
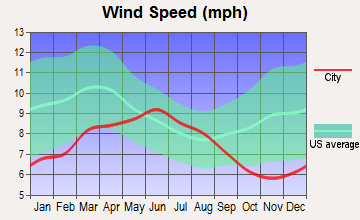
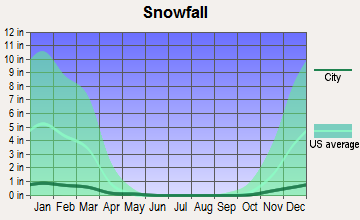
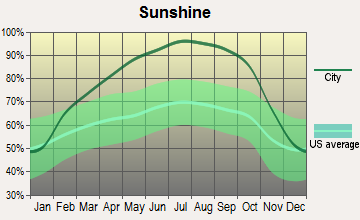
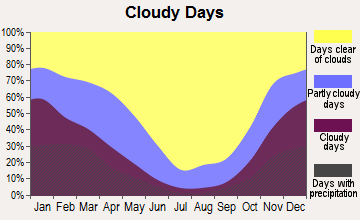
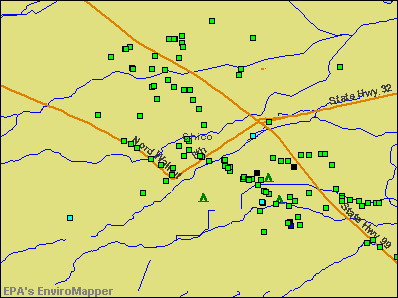

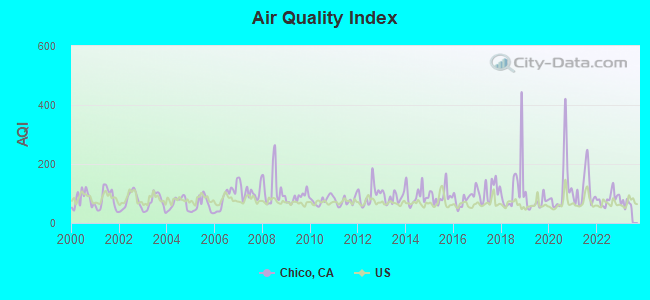
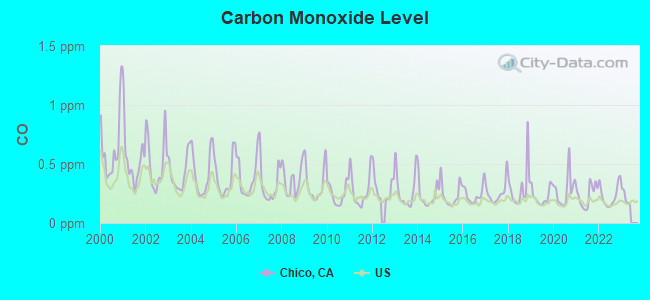
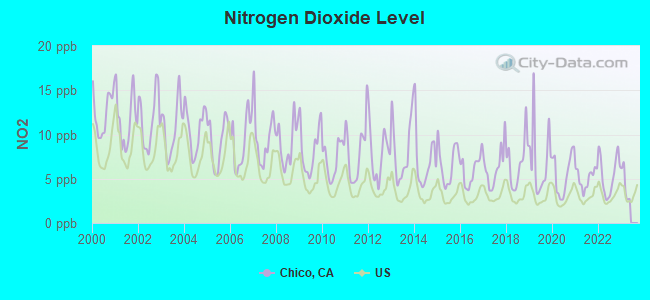
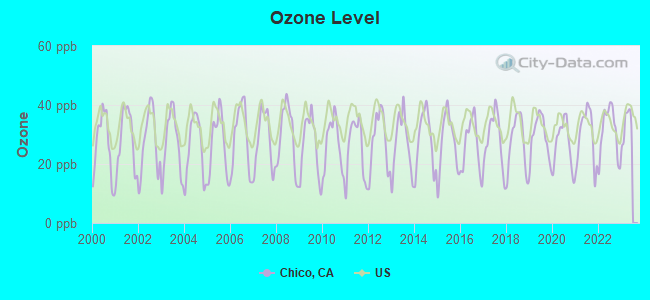
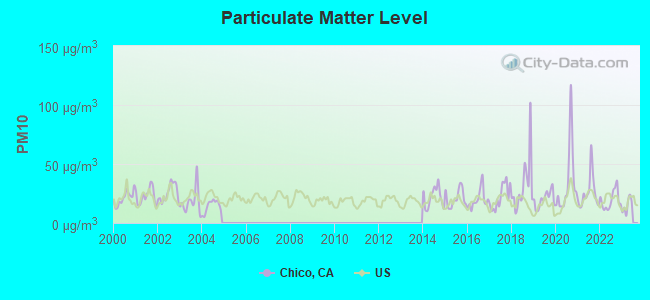
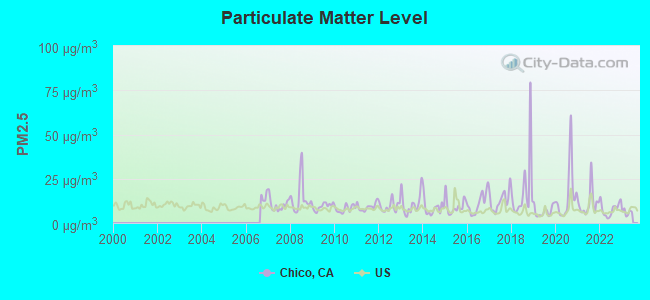
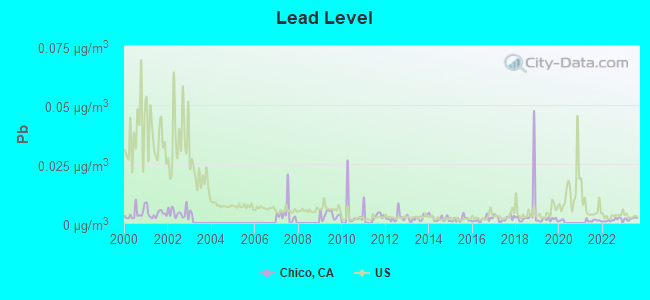
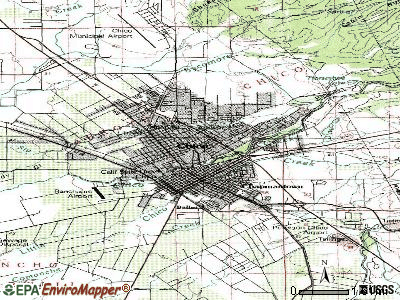
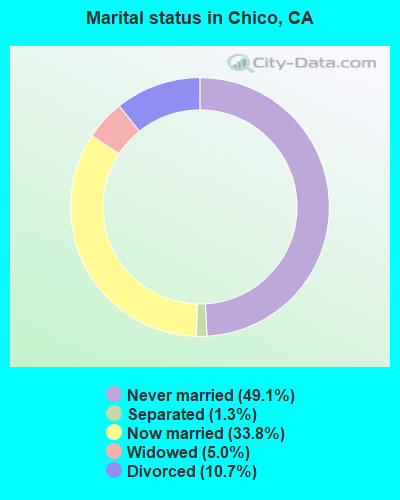
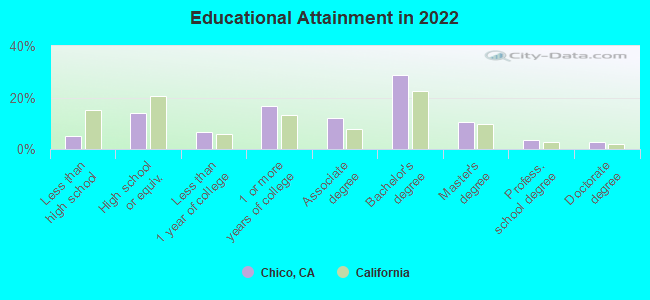
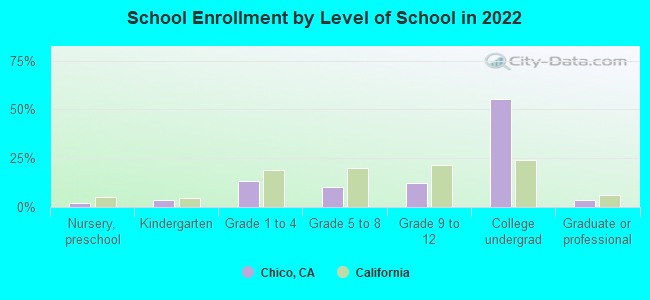
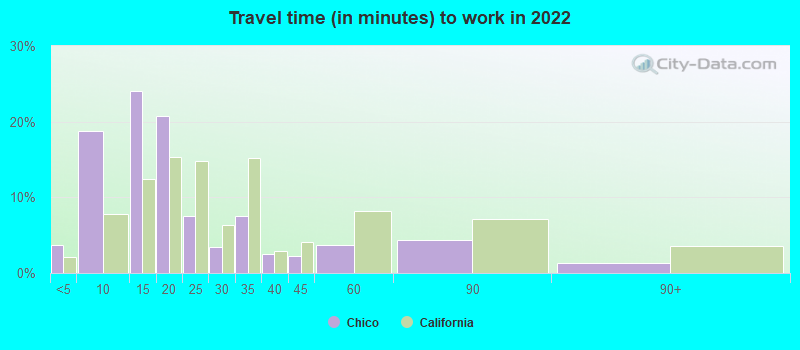
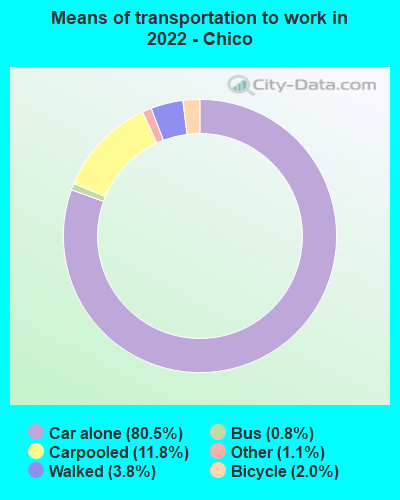
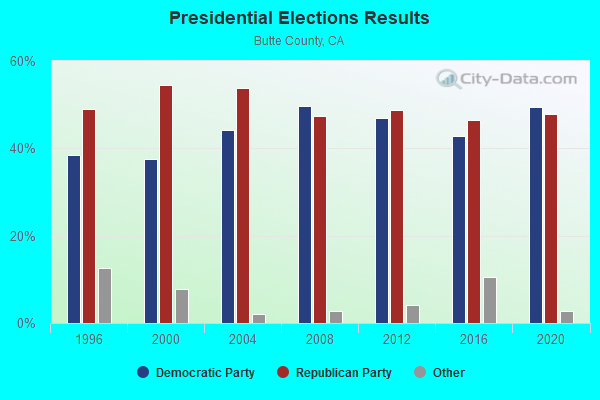
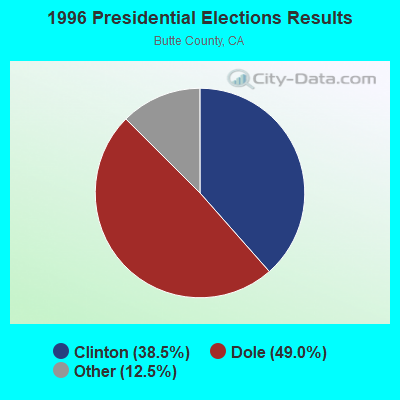
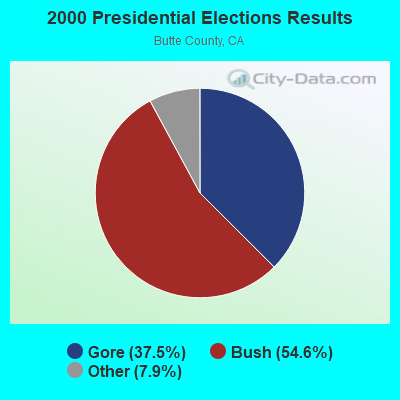
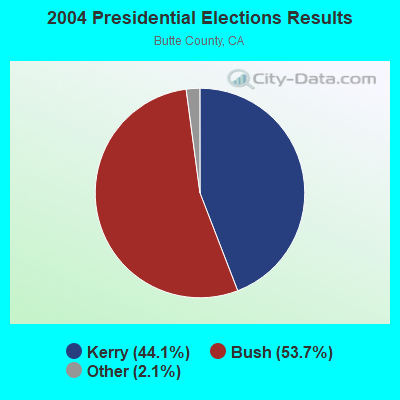
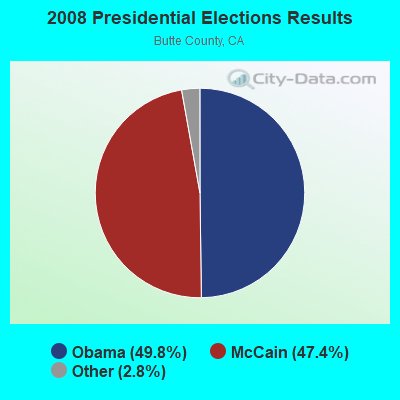
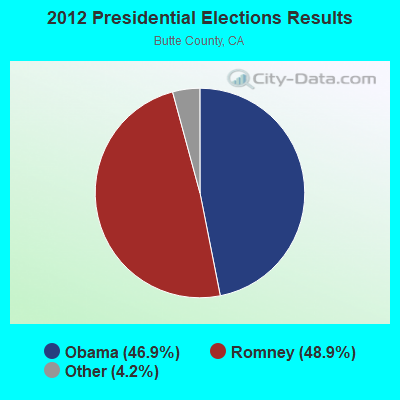
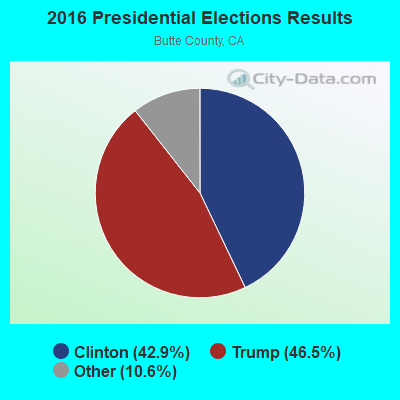
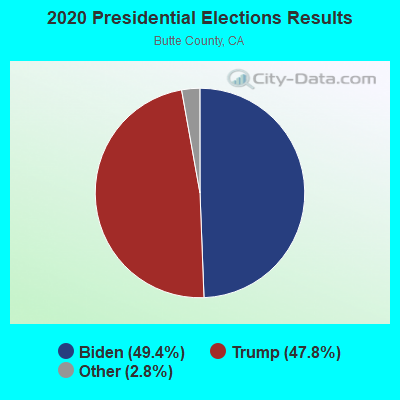
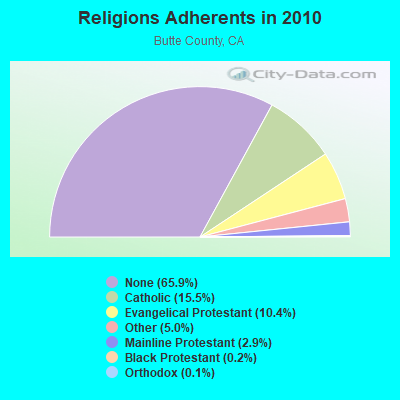
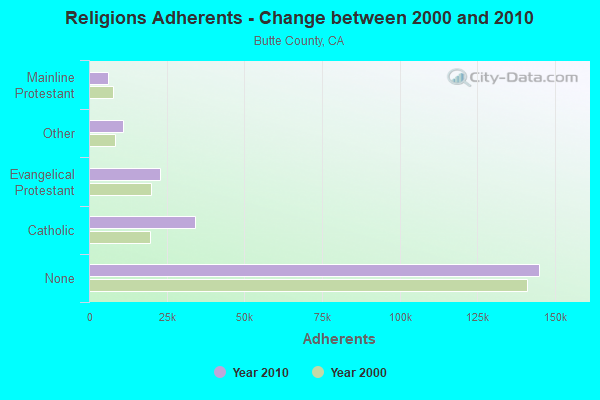
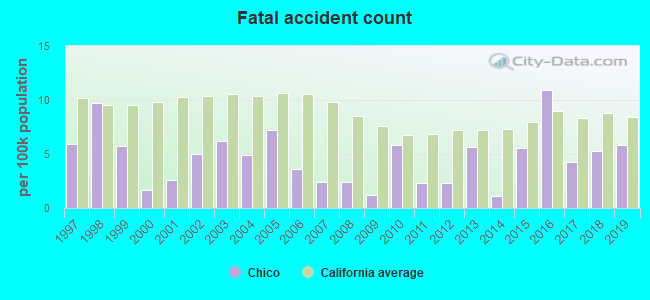
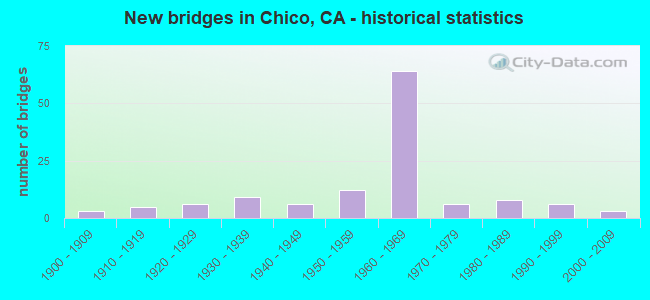
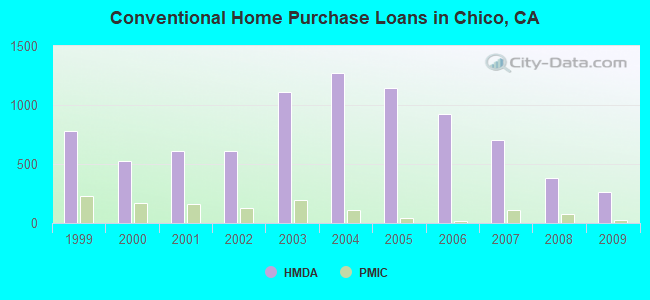
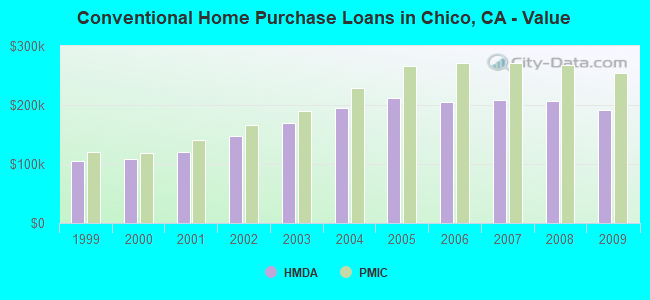
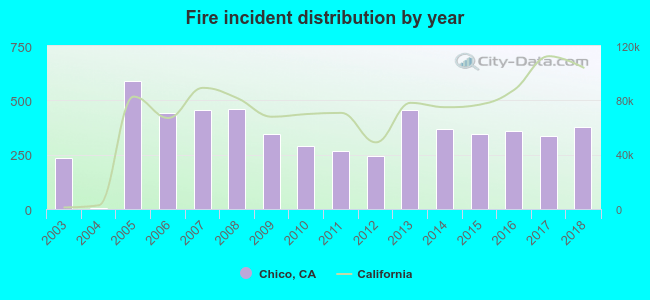 According to the data from the years 2003 - 2018 the average number of fires per year is 348. The highest number of reported fires - 589 took place in 2005, and the least - 6 in 2004. The data has a growing trend.
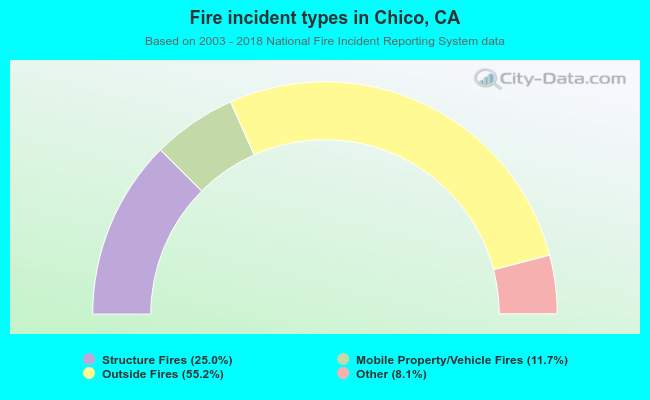 When looking into fire subcategories, the most reports belonged to: Outside Fires (55.2%), and Structure Fires (25.0%).