Estimated zip code population in 2022: 34,432 Zip code population in 2010: 33,865 Zip code population in 2000: 31,585
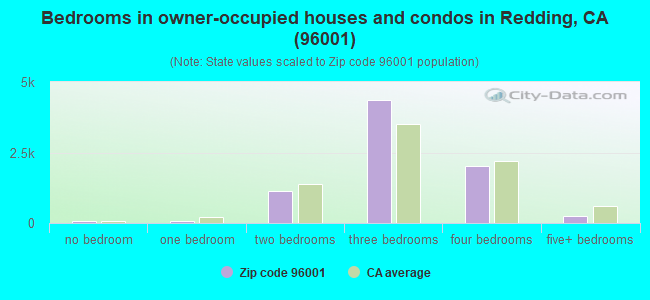
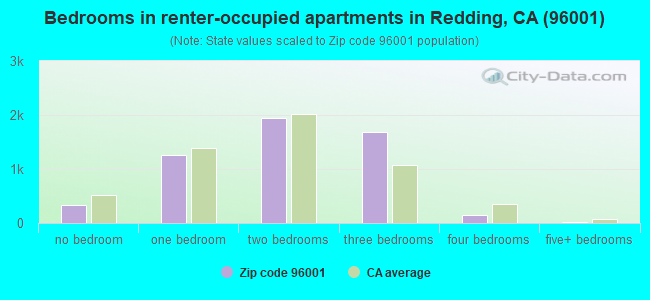
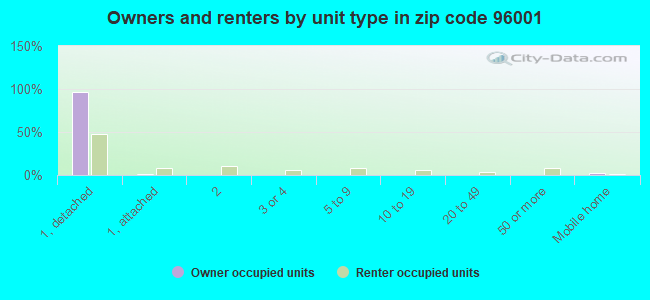
Houses and condos: 14,623 Renter-occupied apartments: 5,408
% of renters here:
40%
State:
44%
March 2022 cost of living index in zip code 96001: 95.1 (less than average, U.S. average is 100)
Land area: 88.0 sq. mi. Water area: 1.6 sq. mi.
Population density: 391 people per square mile
(very low).
OSM Map
General Map
Google Map
MSN Map
OSM Map
General Map
Google Map
MSN Map
OSM Map
General Map
Google Map
MSN Map
OSM Map
General Map
Google Map
MSN Map
Please wait while loading the map...
Real estate property taxes paid for housing units in 2022:
This zip code:
0.7% ($2,649)
California:
0.7% ($4,831)
Median real estate property taxes paid for housing units with mortgages in 2022: $2,783 (0.7%) Median real estate property taxes paid for housing units with no mortgage in 2022: $2,520 (0.6%)
Averages for the 2020 tax year for zip code 96001, filed in 2021:
Average Adjusted Gross Income (AGI) in 2020: $71,480 (Individual Income Tax Returns)
Here:
$71,480
State:
$95,910
Salary/wage: $56,690 (reported on 76.0% of returns)
Here:
$56,690
State:
$77,331
(% of AGI for various income ranges: 1221.2% for AGIs below $25k, 3614.8% for AGIs $25k-50k, 6408.0% for AGIs $50k-75k, 9616.5% for AGIs $75k-100k, 18932.1% for AGIs $100k-200k, 83265.3% for AGIs over 200k)
Taxable interest for individuals: $1,427 (reported on 39.0% of returns)
This zip code:
$1,427
California:
$2,294
(% of AGI for various income ranges: 18.4% for AGIs below $25k, 23.7% for AGIs $25k-50k, 60.3% for AGIs $50k-75k, 163.4% for AGIs $75k-100k, 189.3% for AGIs $100k-200k, 1717.1% for AGIs over 200k)
Ordinary dividends: $6,287 (reported on 18.6% of returns)
Here:
$6,287
State:
$10,949
(% of AGI for various income ranges: 35.3% for AGIs below $25k, 43.1% for AGIs $25k-50k, 147.6% for AGIs $50k-75k, 214.3% for AGIs $75k-100k, 423.2% for AGIs $100k-200k, 4071.2% for AGIs over 200k)
Net capital gain/loss in AGI: +$18,692 (reported on 18.5% of returns)
Here:
+$18,692
State:
+$49,306
(% of AGI for various income ranges: 9.8% for AGIs below $25k, 31.2% for AGIs $25k-50k, 141.7% for AGIs $50k-75k, 218.2% for AGIs $75k-100k, 798.5% for AGIs $100k-200k, 22397.6% for AGIs over 200k)
Profit/loss from business: +$21,051 (reported on 15.6% of returns)
Here:
+$21,051
State:
+$15,671
(% of AGI for various income ranges: 113.3% for AGIs below $25k, 173.2% for AGIs $25k-50k, 293.6% for AGIs $50k-75k, 432.2% for AGIs $75k-100k, 974.2% for AGIs $100k-200k, 13438.2% for AGIs over 200k)
Taxable individual retirement arrangement distribution: $20,467 (reported on 9.5% of returns)
96001:
$20,467
California:
$23,505
(% of AGI for various income ranges: 63.2% for AGIs below $25k, 114.3% for AGIs $25k-50k, 274.9% for AGIs $50k-75k, 454.7% for AGIs $75k-100k, 809.7% for AGIs $100k-200k, 4547.6% for AGIs over 200k)
Self-employed (Keogh) retirement plans: $33,527 (reported on 1.0% of returns)
96001:
$33,527
California:
$30,163
(% of AGI for various income ranges: 29.1% for AGIs $50k-75k, 79.2% for AGIs $100k-200k, 2224.1% for AGIs over 200k)
Total itemized deductions: $33,065 (reported on 10.5% of returns)
Here:
$33,065
State:
$39,517
(% of AGI for various income ranges: 59.7% for AGIs below $25k, 128.1% for AGIs $25k-50k, 446.4% for AGIs $50k-75k, 737.0% for AGIs $75k-100k, 1487.4% for AGIs $100k-200k, 10758.2% for AGIs over 200k)
Charity contributions: $10,986 (reported on 7.9% of returns)
Here:
$10,986
State:
$12,598
(% of AGI for various income ranges: 2.8% for AGIs below $25k, 15.3% for AGIs $25k-50k, 46.6% for AGIs $50k-75k, 99.1% for AGIs $75k-100k, 324.4% for AGIs $100k-200k, 4411.2% for AGIs over 200k)
Taxes paid: $7,724 (reported on 10.5% of returns)
96001:
$7,724
State:
$8,807
(% of AGI for various income ranges: 9.3% for AGIs below $25k, 24.1% for AGIs $25k-50k, 99.0% for AGIs $50k-75k, 224.2% for AGIs $75k-100k, 436.6% for AGIs $100k-200k, 1908.8% for AGIs over 200k)
Earned income credit: $1,997 (reported on 15.1% of returns)
Here:
$1,997
State:
$2,074
(% of AGI for various income ranges: 80.6% for AGIs below $25k, 69.3% for AGIs $25k-50k, 1.0% for AGIs $50k-75k)
Percentage of individuals using paid preparers for their 2020 taxes: 94.2%
Here:
94%
State:
92%
(% for various income ranges: 93.3% for AGIs below $25k, 94.9% for AGIs $25k-50k, 95.5% for AGIs $50k-75k, 93.3% for AGIs $75k-100k, 94.4% for AGIs $100k-200k, 94.9% for AGIs over 200k)
Averages for the 2012 tax year for zip code 96001, filed in 2013:
Average Adjusted Gross Income (AGI) in 2012: $57,637 (Individual Income Tax Returns)
Here:
$57,637
State:
$72,726
Salary/wage: $45,887 (reported on 76.0% of returns)
Here:
$45,887
State:
$59,079
(% of AGI for various income ranges: 69.0% for AGIs below $25k, 66.4% for AGIs $25k-50k, 63.4% for AGIs $50k-75k, 64.6% for AGIs $75k-100k, 64.6% for AGIs $100k-200k, 44.8% for AGIs over 200k)
Taxable interest for individuals: $1,744 (reported on 42.5% of returns)
This zip code:
$1,744
California:
$2,146
(% of AGI for various income ranges: 1.6% for AGIs below $25k, 1.3% for AGIs $25k-50k, 1.4% for AGIs $50k-75k, 1.2% for AGIs $75k-100k, 1.0% for AGIs $100k-200k, 1.3% for AGIs over 200k)
Ordinary dividends: $5,502 (reported on 21.1% of returns)
Here:
$5,502
State:
$9,308
(% of AGI for various income ranges: 2.0% for AGIs below $25k, 1.7% for AGIs $25k-50k, 1.5% for AGIs $50k-75k, 1.4% for AGIs $75k-100k, 1.9% for AGIs $100k-200k, 3.0% for AGIs over 200k)
Net capital gain/loss in AGI: +$6,025 (reported on 18.7% of returns)
Here:
+$6,025
State:
+$30,460
(% of AGI for various income ranges: 0.2% for AGIs $25k-50k, 0.5% for AGIs $50k-75k, 0.7% for AGIs $75k-100k, 1.9% for AGIs $100k-200k, 5.6% for AGIs over 200k)
Profit/loss from business: +$24,059 (reported on 16.8% of returns)
Here:
+$24,059
State:
+$17,064
(% of AGI for various income ranges: 7.6% for AGIs below $25k, 5.8% for AGIs $25k-50k, 4.8% for AGIs $50k-75k, 3.8% for AGIs $75k-100k, 4.2% for AGIs $100k-200k, 14.1% for AGIs over 200k)
Taxable individual retirement arrangement distribution: $15,346 (reported on 12.5% of returns)
96001:
$15,346
California:
$19,557
(% of AGI for various income ranges: 3.2% for AGIs below $25k, 3.1% for AGIs $25k-50k, 3.2% for AGIs $50k-75k, 3.7% for AGIs $75k-100k, 4.2% for AGIs $100k-200k, 2.4% for AGIs over 200k)
Self-employment retirement plans: $26,325 (reported on 1.2% of returns)
96001:
$26,325
California:
$24,530
(% of AGI for various income ranges: 0.2% for AGIs below $25k, 0.3% for AGIs $50k-75k, 0.3% for AGIs $100k-200k, 1.8% for AGIs over 200k)
Total itemized deductions: $24,169 (22% of AGI, reported on 35.3% of returns)
Here:
$24,169
State:
$34,004
Here:
22.4% of AGI
State:
22.7% of AGI
(% of AGI for various income ranges: 11.0% for AGIs below $25k, 11.8% for AGIs $25k-50k, 14.4% for AGIs $50k-75k, 15.4% for AGIs $75k-100k, 17.2% for AGIs $100k-200k, 15.3% for AGIs over 200k)
Charity contributions: $3,638 (reported on 28.4% of returns)
Here:
$3,638
State:
$4,659
(% of AGI for various income ranges: 0.7% for AGIs below $25k, 1.2% for AGIs $25k-50k, 1.6% for AGIs $50k-75k, 1.7% for AGIs $75k-100k, 2.1% for AGIs $100k-200k, 2.3% for AGIs over 200k)
Taxes paid: $8,713 (reported on 35.1% of returns)
96001:
$8,713
State:
$14,448
(% of AGI for various income ranges: 1.8% for AGIs below $25k, 2.4% for AGIs $25k-50k, 3.7% for AGIs $50k-75k, 4.7% for AGIs $75k-100k, 6.7% for AGIs $100k-200k, 8.3% for AGIs over 200k)
Earned income credit: $2,049 (reported on 18.7% of returns)
Here:
$2,049
State:
$2,286
(% of AGI for various income ranges: 6.1% for AGIs below $25k, 1.0% for AGIs $25k-50k)
Percentage of individuals using paid preparers for their 2012 taxes: 55.6%
Here:
56%
State:
64%
(% for various income ranges: 47.4% for AGIs below $25k, 54.4% for AGIs $25k-50k, 60.8% for AGIs $50k-75k, 61.8% for AGIs $75k-100k, 67.8% for AGIs $100k-200k, 82.6% for AGIs over 200k)
Averages for the 2004 tax year for zip code 96001, filed in 2005:
Average Adjusted Gross Income (AGI) in 2004: $50,930 (Individual Income Tax Returns)
Here:
$50,930
State:
$58,600
Salary/wage: $40,687 (reported on 78.8% of returns)
Here:
$40,687
State:
$49,455
(% of AGI for various income ranges: 158.8% for AGIs below $10k, 70.9% for AGIs $10k-25k, 69.9% for AGIs $25k-50k, 71.3% for AGIs $50k-75k, 72.0% for AGIs $75k-100k, 50.7% for AGIs over 100k)
Taxable interest for individuals: $2,114 (reported on 50.4% of returns)
This zip code:
$2,114
California:
$2,365
(% of AGI for various income ranges: 9.1% for AGIs below $10k, 2.5% for AGIs $10k-25k, 2.2% for AGIs $25k-50k, 1.5% for AGIs $50k-75k, 1.5% for AGIs $75k-100k, 2.2% for AGIs over 100k)
Taxable dividends: $3,048 (reported on 26.2% of returns)
Here:
$3,048
State:
$4,746
(% of AGI for various income ranges: 8.0% for AGIs below $10k, 2.0% for AGIs $10k-25k, 1.5% for AGIs $25k-50k, 1.4% for AGIs $50k-75k, 1.2% for AGIs $75k-100k, 1.5% for AGIs over 100k)
Net capital gain/loss: +$14,019 (reported on 23.8% of returns)
Here:
+$14,019
State:
+$23,418
(% of AGI for various income ranges: -4.0% for AGIs below $10k, 0.6% for AGIs $10k-25k, 1.1% for AGIs $25k-50k, 1.5% for AGIs $50k-75k, 2.0% for AGIs $75k-100k, 13.2% for AGIs over 100k)
Profit/loss from business: +$25,917 (reported on 17.7% of returns)
Here:
+$25,917
State:
+$16,826
(% of AGI for various income ranges: 7.5% for AGIs below $10k, 6.3% for AGIs $10k-25k, 5.7% for AGIs $25k-50k, 5.5% for AGIs $50k-75k, 5.7% for AGIs $75k-100k, 13.2% for AGIs over 100k)
IRA payment deduction: $3,336 (reported on 3.4% of returns)
96001:
$3,336
California:
$3,192
(% of AGI for various income ranges: 0.5% for AGIs below $10k, 0.3% for AGIs $10k-25k, 0.3% for AGIs $25k-50k, 0.3% for AGIs $50k-75k, 0.2% for AGIs $75k-100k, 0.1% for AGIs over 100k)
Self-employed pension: $19,768 (reported on 1.9% of returns)
Here:
$19,768
California:
$17,688
(% of AGI for various income ranges: 0.2% for AGIs $25k-50k, 0.3% for AGIs $50k-75k, 0.4% for AGIs $75k-100k, 1.4% for AGIs over 100k)
Total itemized deductions: $20,683 (22% of AGI, reported on 39.8% of returns)
Here:
$20,683
State:
$28,113
Here:
22.2% of AGI
State:
25.3% of AGI
(% of AGI for various income ranges: 28.5% for AGIs below $10k, 12.8% for AGIs $10k-25k, 16.4% for AGIs $25k-50k, 17.9% for AGIs $50k-75k, 18.7% for AGIs $75k-100k, 15.0% for AGIs over 100k)
Charity contributions deductions: $3,008 (3% of AGI, reported on 34.3% of returns)
Here:
$3,008
State:
$3,923
Here:
3.1% of AGI
State:
3.3% of AGI
(% of AGI for various income ranges: 1.8% for AGIs below $10k, 1.0% for AGIs $10k-25k, 1.6% for AGIs $25k-50k, 2.1% for AGIs $50k-75k, 2.3% for AGIs $75k-100k, 2.3% for AGIs over 100k)
Total tax: $8,663 (reported on 76.3% of returns)
96001:
$8,663
State:
$10,761
(% of AGI for various income ranges: 5.0% for AGIs below $10k, 4.3% for AGIs $10k-25k, 6.8% for AGIs $25k-50k, 9.0% for AGIs $50k-75k, 10.5% for AGIs $75k-100k, 19.3% for AGIs over 100k)
Earned income credit: $1,590 (reported on 14.9% of returns)
Here:
$1,590
State:
$1,763
Percentage of individuals using paid preparers for their 2004 taxes: 60.3%
Here:
60%
State:
66%
(% for various income ranges: 50.9% for AGIs below $10k, 55.4% for AGIs $10k-25k, 61.0% for AGIs $25k-50k, 62.6% for AGIs $50k-75k, 66.5% for AGIs $75k-100k, 79.7% for AGIs over 100k)
Likely homosexual households (counted as self-reported same-sex unmarried-partner households)
Lesbian couples: 0.0% of all households
Gay men: 0.1% of all households
Household received Food Stamps/SNAP in the past 12 months: 2,388 Household did not receive Food Stamps/SNAP in the past 12 months: 11,144
Women who had a birth in the past 12 months: 355 (202 now married, 154 unmarried) Women who did not have a birth in the past 12 months: 6,709 (2,313 now married, 4,410 unmarried)
Housing units in zip code 96001 with a mortgage: 5,296 (416 second mortgage, 355 both second mortgage and home equity loan) Houses without a mortgage: 138
Median monthly owner costs for units with a mortgage: $1,987 Median monthly owner costs for units without a mortgage: $661
Residents with income below the poverty level in 2022:
This zip code:
13.0%
Whole state:
12.2%
Residents with income below 50% of the poverty level in 2022:
This zip code:
6.0%
Whole state:
6.2%
Median number of rooms in houses and condos:
Here:
6.2
State:
6.0
Median number of rooms in apartments:
Here:
4.4
State:
3.9
Notable locations in this zip code not listed on our city pages
Notable locations in zip code 96001: Redding Gun Club (A), Menning Golf Course (B), Veterans Memorial Building (C), Shasta County Library (D), Shasta County Jail (E), Shasta County Courthouse (F), Old Redding City Hall Building (G), Redding Convention Center (H), American Medical Response Station 1 (I), Reach Air Medical Services (J), Mercy Medical Ground Ambulance (K), Keswick Volunteer Fire Company Shasta County Fire Station 53 (L), Centerville Volunteer Fire Company Station 52 (M), Redding Fire Department Station 3 (N), Redding Fire Department Station 1 (O), Redding Fire Department Station 4 (P), Redding Fire Department Station 2 (Q), Shasta Fire District Station 56 (R). Display/hide their locations on the map
Churches in zip code 96001 include: Trinity Evangelical Lutheran Church (A), Saint Josephs Roman Catholic Church (B), Foursquare Church (C), First Church of Christ Scientist (D), First Baptist Church (E), The Church of Jesus Christ of Latter Day Saints (F), Church of Jesus Christ (G), Church of Christ (H), Bethel Assembly of God Church (I). Display/hide their locations on the map
Streams, rivers, and creeks: Boulder Creek (A), Cottonwood Creek (B), Dry Fork (C), Jenny Creek (D), Middle Creek (E), Motion Creek (F), Tadpole Creek (G), Spring Creek (H), South Fork Squaw Creek (I). Display/hide their locations on the map
Parks in zip code 96001 include: Clear Creek Gold Discovery Historical Marker (1), Cascade Park (2), Turtle Bay Bird Sanctuary (3), Woods Memorial Park (4), Kutras Park (5). Display/hide their locations on the map
4,766 married couples with children.
1,923 single-parent households (740 men, 1,183 women).
92.7% of residents of 96001 zip code speak English at home.
3.4% of residents speak Spanish at home (80% very well, 17% well, 3% not well, 1% not at all).
1.5% of residents speak other Indo-European language at home (84% very well, 9% well, 7% not well).
1.7% of residents speak Asian or Pacific Island language at home (63% very well, 24% well, 12% not well).
0.4% of residents speak other language at home (63% very well, 36% well, 1% not well).
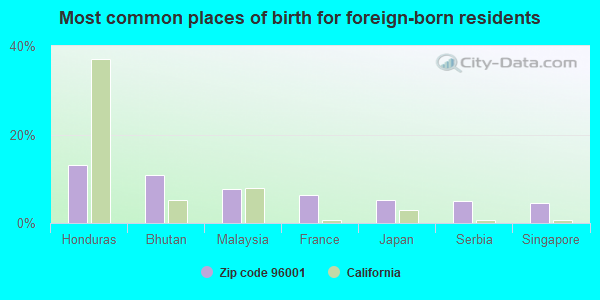
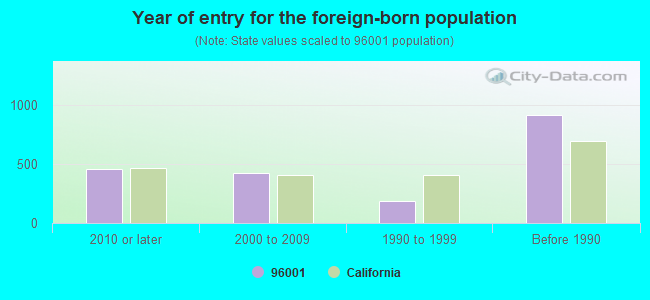
Foreign born population: 1,493 (4.3%) (56.9% of them are naturalized citizens)
Major facilities with environmental interests located in this zip code:
J F SHEA COMPANY INCORPORATED (17400 CLEAR CREEK ROAD in REDDING, CA)
AIR SYNTHETIC MINOR (AIRS/AFS) (Integrated Compliance Information System) - ICIS-09-1993-0028, FORMAL ENFORCEMENT ACTION CRITERIA AND HAZARDOUS AIR POLLUTANT INVENTORY (Inventory of air pollution sources) Small Quantity Generators, between 100 kg and 1000 kg of hazardous waste/month (Resource Conservation and Recovery Act (tracking hazardous waste)) - notification Business SIC classification: ASPHALT PAVING MIXTURES AND BLOCKS; CERAMIC WALL AND FLOOR TILE; READY-MIXED CONCRETE Organizations: J F SHEA AND EDMOND H SHEA (CONTACT/OWNER)
Alternative names: JF SHEA-AGGREGATE PRODUCTS
MAGIC AUTO PAINTING (3750 EASTSIDE RD in REDDING, CA) . Federal Facility
STATE MASTER (California - Hazardous Waste Tracking) - HAZARDOU WASTE PROGRAM CRITERIA AND HAZARDOUS AIR POLLUTANT INVENTORY (Inventory of air pollution sources) Small Quantity Generators, between 100 kg and 1000 kg of hazardous waste/month (Resource Conservation and Recovery Act (tracking hazardous waste)) - notification Business SIC classification: TOP, BODY, AND UPHOLSTERY REPAIR SHOPS AND PAINT SHOPS Business NAICS classification: AUTOMOTIVE BODY, PAINT, AND INTERIOR REPAIR AND MAINTENANCE. Organizations: DAVE HIXONBAUGH (CONTACT/OWNER)
Alternative names: MIRACLE AUTO PAINTING
MILLER AUTO CTR (1150 CALIFORNIA ST in REDDING, CA)
STATE MASTER (California - Hazardous Waste Tracking) - HAZARDOU WASTE PROGRAM CRITERIA AND HAZARDOUS AIR POLLUTANT INVENTORY (Inventory of air pollution sources) Small Quantity Generators, between 100 kg and 1000 kg of hazardous waste/month (Resource Conservation and Recovery Act (tracking hazardous waste)) - notification Business SIC classification: TOP, BODY, AND UPHOLSTERY REPAIR SHOPS AND PAINT SHOPS Organizations: TERRY MILLER (CONTACT/OWNER)
MCCOLLS DAIRY (2500 ANGELO AVE. in REDDING, CA)
STATE MASTER (California - Hazardous Waste Tracking) - HAZARDOU WASTE PROGRAM Small Quantity Generators, between 100 kg and 1000 kg of hazardous waste/month (Resource Conservation and Recovery Act (tracking hazardous waste)) - notification TRI REPORTER (Tracking of toxic chemicals releasing facilities) Business SIC and NAICS classification: FLUID MILK Organizations: MCCOLLS DAIRY COMPANY INC (CONTACT/OWNER)
ACADEMIC OPTIONS (2200 EUREKA WAY in REDDING, CA)
(National Center for Education Statistics) - STATE ID-4530200 Organizations: SHASTA UNION HIGH (SCHOOL DISTRICT)
ALTERNATIVE/OPPORTUNITY (1644 MAGNOLIA AVE. in REDDING, CA)
(National Center for Education Statistics) - STATE ID-4530036 Organizations: SHASTA CO. OFFICE OF EDUCATION (SCHOOL DISTRICT)
MONARCH LEARNING CENTER CHARTER (5307 CEDARS RD in REDDING, CA)
(National Center for Education Statistics) - STATE ID-6117931 Organizations: REDDING ELEMENTARY (SCHOOL DISTRICT)
MODOC CHARTER (1135 PINE ST. SUITE A in REDDING, CA)
(National Center for Education Statistics) - STATE ID-2530129 Organizations: MODOC JOINT UNIFIED (SCHOOL DISTRICT)
IRON MOUNTAIN MINE (OFF HWY 299 9 MI NW OF in REDDING, CA)
SUPERFUND NPL (Superfund database) (Integrated Compliance Information System) - ICIS-09-1997-0157, FORMAL ENFORCEMENT ACTION, ICIS-09-1997-0008, ICIS-09-1987-0013, ICIS-09-1990-0018, ICIS-09-2002-0078, Business SIC classification: IRON ORES; COPPER ORES; LEAD AND ZINC ORES Alternative names: I M M
FREEDOM HIGH (COMMUNITY DAY) (2200 EUREKA WAY in REDDING, CA)
(National Center for Education Statistics) - STATE ID-4530218 Organizations: SHASTA UNION HIGH (SCHOOL DISTRICT)
GRANT ELEMENTARY (8835 SWASEY DR. in REDDING, CA)
(National Center for Education Statistics) - STATE ID-6050330
CALIFORNIA OIL RECYCLERS (501 CLEAR CREEK RD in REDDING, CA)
National Pollutant Discharge Elimination System NON-MAJOR (Tracking pollutant discharge elimination systems) - permit TRANSPORTER (Resource Conservation and Recovery Act (tracking hazardous waste)) USED OIL PROGRAM (Resource Conservation and Recovery Act (tracking hazardous waste)) Organizations: EVERGREEN HOLDINGS INC (CONTACT/OWNER)
FITCH LYNDON B MD INC DBA NOTHRN LABOR (2145 COURT ST in REDDING, CA)
(Resource Conservation and Recovery Act (tracking hazardous waste)) Business NAICS classification: MEDICAL LABORATORIES.
Housing units lacking complete plumbing facilities: 0.2% Housing units lacking complete kitchen facilities: 1.9%
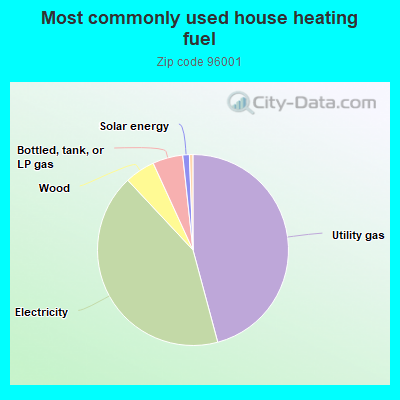
45.6%Utility gas
42.0%Electricity
5.1%Wood
5.1%Bottled, tank, or LP gas
1.1%Solar energy
0.6%Fuel oil, kerosene, etc.
Population in 1990: 30,690. Population change in the 1990s: +895 (+2.9%).
Place of birth for U.S.-born residents:
This state: 24,546
Northeast: 1,005
Midwest: 2,220
South: 1,821
West: 2,685
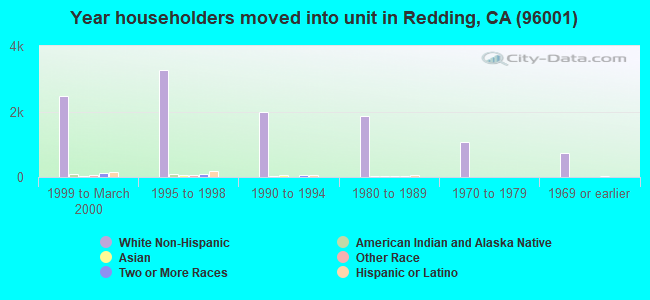
49% of the 96001 zip code residents lived in the same house 5 years ago. Out of people who lived in different houses, 65% lived in this county. Out of people who lived in different counties, 50% lived in California.
84% of the 96001 zip code residents lived in the same house 1 year ago. Out of people who lived in different houses, 66% moved from this county. Out of people who lived in different houses, 23% moved from different county within same state. Out of people who lived in different houses, 5% moved from different state. Out of people who lived in different houses, 3% moved from abroad.
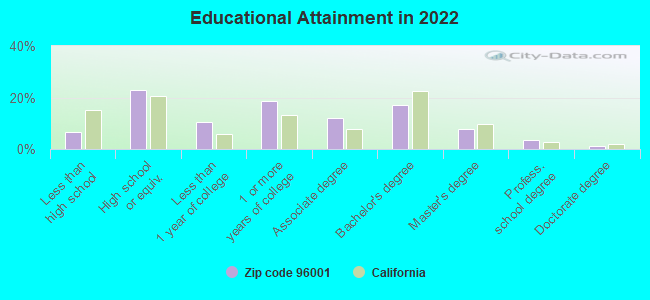
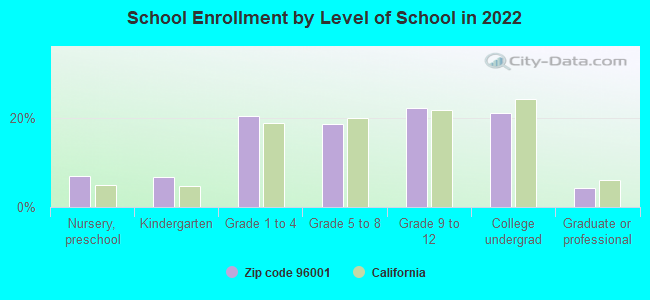
Private vs. public school enrollment:
Students in private schools in grades 1 to 8 (elementary and middle school): 743
Here:
23.7%
California:
10.5%
Students in private schools in grades 9 to 12 (high school): 110
Here:
6.3%
California:
8.5%
Students in private undergraduate colleges: 514
Here:
30.4%
California:
15.9%
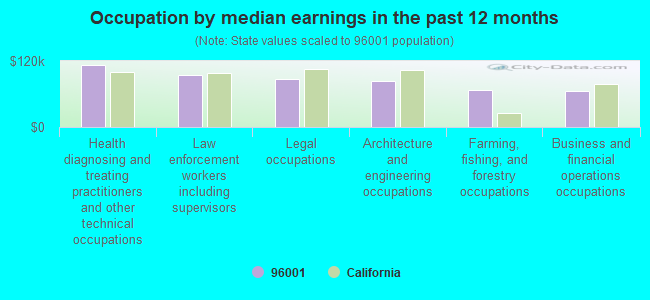
Occupation by median earnings in the past 12 months ($)
112,085Health diagnosing and treating practitioners and other technical occupations
95,326Law enforcement workers including supervisors
86,769Legal occupations
83,312Architecture and engineering occupations
67,536Farming, fishing, and forestry occupations
65,995Business and financial operations occupations
Companies with federal contracts located in this zip code:
D T K COMPANY INC (8803 LANDMARK CIRCLE in REDDING, CA; small business) : $6,204,138 in 44 contractsfrom 1999 to 2006
Contracts for Maintenance, Repair or Alteration of Real Property -- Other Administrative Facilities and Service Buildings, Construction of Structures and Facilities -- Other Administrative Facilities and Service Buildings, Maintenance, Repair or Alteration of Real Property -- Family Housing Facilities, Maintenance, Repair or Alteration of Real Property -- Office Buildings, and moreby Air Force, Navy, U.S. Army Corps of Engineers - civil program financing only Signed by year:2000: $1,346,857; 2001: $1,818,693; 2002: $1,477,637; 2003: $178,091; 2004: $0; 2005: $790,514; 2006: $5,063.
Biggest contracts:
$536,571 with Air Force for Maintenance, Repair or Alteration of Real Property -- Other Administrative Facilities and Service Buildings. Signed on 2002-07-23. Completion date: 2002-11-22.
$500,000 with Air Force for Construction of Structures and Facilities -- Other Administrative Facilities and Service Buildings. Signed on 2002-09-29. Completion date: 2003-01-06.
$499,688, same as above.Signed on 2001-09-29. Completion date: 2002-01-31.
$399,000 with Air Force for Maintenance, Repair or Alteration of Real Property -- Family Housing Facilities. Taking place in AZ. Signed on 1999-10-19. Completion date: 2000-08-01.
ROSEWOOD TERRACE CARE CENTER (2940 COURT ST in REDDING, CA) : $2,592,067 in 46 contractsfrom 2000 to 2004
Contracts for Nursing Home Care Contracts by Department of Veterans Affairs Signed by year:2000: $291,000; 2001: $552,000; 2002: $762,124; 2003: $296,019; 2004: $690,924; 2005: $0; 2006: $0.
Biggest contracts:
$229,426 with Department of Veterans Affairs for Nursing Home Care Contracts. Signed on 2004-04-02. Completion date: 2005-04-01.
$206,000, same as above.Signed on 2002-03-15. Completion date: 2002-12-15.
$197,000, same as above.Signed on 2001-08-15. Completion date: 2001-12-15.
$180,000, same as above.Signed on 2001-06-15. Completion date: 2001-12-15.
ORTHOPEDIC OUTFITTERS INC (9230 SILVER KING RD in REDDING, CA; small business) : $14,363 in 5 contractsfrom 2004 to 2005
Contracts for Medical and Surgical Instruments, Equipment, and Supplies by Navy Signed by year:2000: $0; 2001: $0; 2002: $0; 2003: $0; 2004: $5,900; 2005: $8,463; 2006: $0.
Biggest contracts:
$8,463 with Navy for Medical and Surgical Instruments, Equipment, and Supplies. Signed on 2005-04-28. Completion date: 2005-05-11.
$3,184, same as above.Signed on 2004-08-11. Completion date: 2004-08-10.
$2,575, same as above.Signed on 2004-04-19. Completion date: 2004-04-30.
$94, same as above.Signed on 2004-05-21. Completion date: 2004-04-30.
QUALITY INSULATION FABRICATORS (16538 CLEAR CREEK RD in REDDING, CA; small business)
$10,007 with Army for Wallboard, Building Paper, and Thermal Insulation Materials. Signed on 2004-05-20. Completion date: 2004-05-16.
WEAVER DISCOUNT PLYWOOD AND LU (5660 WEST SIDE RD in REDDING, CA; small business)
$3,065 with Army for Plywood and Veneer. Signed on 2004-08-24. Completion date: 2004-08-25.
Moss Lumber Company, Inc (5321 Eastside Rd in Redding, CA; small business)
$2,984 with Bureau of Reclamation for Lumber and Related Basic Wood Materials. Signed on 2004-04-16. Completion date: 2004-04-16.
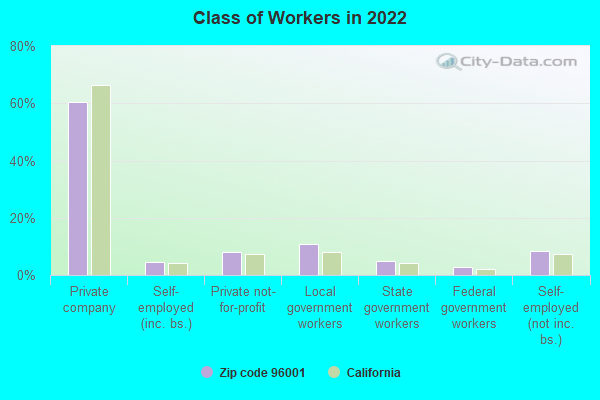
Top industries in this zip code by the number of employees in 2005:
Health Care and Social Assistance: Offices of Physicians (except Mental Health Specialists) (50-99 employees: 1 establishment, 20-49 employees: 11 establishments, 10-19 employees: 20 establishments, 5-9 employees: 26 establishments, 1-4 employees: 89 establishments)
Health Care and Social Assistance: General Medical and Surgical Hospitals (500-999: 1, 50-99: 1)
2005 - 2018 National Fire Incident Reporting System (NFIRS) incidents
According to the data from the years 2005 - 2018 the average number of fire incidents per year is 152. The highest number of reported fires - 251 took place in 2005, and the least - 47 in 2018. The data has a decreasing trend.
When looking into fire subcategories, the most reports belonged to: Outside Fires (52.1%), and Structure Fires (28.8%).
Fire incident types reported to NFIRS in Zip Code 96001
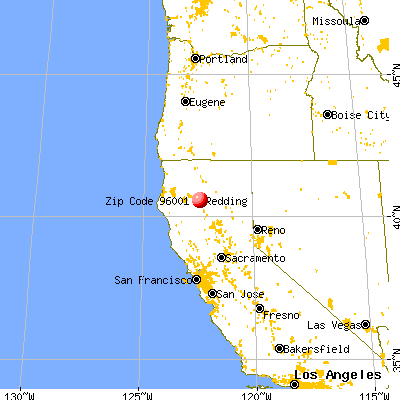


 Nearest zip codes: 96019, 96002, 96087, 96033, 96007, 96047.


 According to the data from the years 2005 - 2018 the average number of fire incidents per year is 152. The highest number of reported fires - 251 took place in 2005, and the least - 47 in 2018. The data has a decreasing trend.
 When looking into fire subcategories, the most reports belonged to: Outside Fires (52.1%), and Structure Fires (28.8%).